The financial resource gap of the economy narrowed further in 2015-16 in an environment characterised by benign commodity prices and moderation in capital formation. Currency and deposits gave way to ‘loans and borrowings’ as the most preferred financial instruments. Within the financial sector, liabilities of other depository corporations, which constitute mainly banks, declined mainly due to lower overall deposits. Non-bank financial corporations (NBFCs) grew in importance as suppliers of finance in the Indian economy. The financial surplus of the household sector continued to increase during the year. I. Introduction This article presents the flow of funds (FoF) accounts of the Indian economy for 2015-16 and updates for 2014-15 and 2013-14, which are consistent with the United Nations System of National Accounts (SNA) 20081. FoF accounts map instrument-wise financial flows across five major institutional sectors of the Indian economy on a ‘from-whom-to-whom’ basis. These institutional sectors2 comprise (i) financial corporations (FCs); (ii) non-financial corporation (NFCs) including in both public3 and private4 sectors; (iii) general government (GG) comprising both central and state governments5; (iv) the household (HH) sector; and (v) the rest of the world (RoW) (Exhibit 1). Financial instruments include currency, deposits, debt securities, loans and borrowings, equity, investment funds (such as mutual funds), insurance, pension and provident funds, monetary gold, other accounts (including trade debt) and other liabilities/ assets not elsewhere classified (Others n.e.c.). The rest of the article is organised into five sections. Section II presents the financial resource gaps across different sectors. Section III analyses movements in sectoral and instrument-wise FoF. Section IV highlights instrument-wise financial flows. Select indicators of financial development are presented and discussed in Section V. Concluding observations are set out in Section VI. II. Sectoral Financial Resource Gaps In the Indian economy, NFCs and GG constitute the major deficit sectors, while FCs and HHs are the major surplus sectors. The overall financial resource balance in the economy – measured by the net acquisition of financial assets less net increase in liabilities – as a proportion to net national income (NNI) at current market prices moved further into the surplus zone in 2015-16 from a marginal surplus in 2014-15, contrasting a deficit in 2013-14. This improvement was primarily driven by a reduction in net borrowings of non-financial corporations (NFCs), and a sustained improvement in net lending from the household sector as it shifted its portfolio from physical assets to financial assets albeit marginally (Table 1). While the NFCs increased their saving, benefitting from lower input costs due to decline in international commodity prices, financial corporations witnessed moderation in net lending owing to lower flow of credit from commercial banks and non-bank financial companies (NBFCs) as asset quality concerns mounted. Despite slippages at the sub-national level, the resource gap of the general government sector reduced marginally on account of fiscal consolidation by the central government. | Table 1: Sectoral Financial Resource Balance (per cent of Net National Income or NNI at current market prices) | | Components | 2013-14 | 2014-15 | 2015-16 | | 1 Non-Financial Corporations (NFCs) | -6.4 | -5.1 | -4.6 | | a. Public Non-Financial Corporations (PuNFCs) | -2.6 | -2.4 | -2.9 | | b. Private Non-Financial Corporations (PvNFCs) | -3.8 | -2.7 | -1.7 | | 2 Financial Corporations (FCs) | 2.6 | 2.5 | 1.8 | | 3 General Government (GG) | -5.8 | -5.7 | -5.5 | | 4 Household Sector (HH) | 8.4 | 8.4 | 9.0 | | 5 Total (1+2+3+4) | -1.2 | 0.1 | 0.7 | III. Sectoral Movements in Financial Flows6 In this section, movements in financial flows to the deficit sectors viz., NFCs and GG, are tracked followed by an analysis of flows from the surplus sectors i.e., the FCs and the HHs.7 The total acquisition of financial liabilities by all sectors (including the RoW sector) declined steadily from 2013-14 to 2015-16 (Chart 1). The financial liabilities of financial corporations declined from 26.2 per cent of NNI in 2013-14 to 22.7 per cent in 2014-15 and further to 17.7 per cent in 2015-16 on account of lower resource mobilisation by other depository corporations (ODCs) and other financial corporations (OFCs). Acquisition of financial liabilities by HH, on the other hand, increased, reflecting improved financial conditions. III.1 Non-Financial Corporations The share of financial liabilities of NFCs in total liabilities remained stable at around 34.2 per cent in 2015-16. III.1.a Private Non-Financial Corporations Operations of PvNFCs continued to benefit from benign global commodity prices in 2015-16. A slowdown in sales growth was offset by contraction in expenses on raw materials and components. Consequently, their operating profits soared and shrank the resource gap further from a year ago (Chart 2 and Statement 2.2). The declining role of banks in the financing of PvNFCs is reflective of the twin balance sheet problem - corporates and banks. The space created by ODCs was filled by other intra-sectoral flows. Furthermore, the role of RoW also waned, indicating lower role of external finance in the operations of PvNFCs on heightened risk perceptions relating to Indian corporates. As regards financial assets, the increase in equity flows of PvNFCs was substantial due to improved profitability. This could have led to higher investments in other non-financial firms, which experienced relatively lower investment demand than the previous year. III.1.b Public Non-Financial Corporations8 The financial resource gap of PuNFCs widened on account of lower retained profits as net revenues of these entities continued to shrink. Reflecting this, the overall borrowings of central public enterprises increased - despite a decline in capital expenditure in 2015-16 - indicating higher financing requirements of revenue expenditure (Chart 3 and Statement 2.1). III.2 General Government The financial resource gap of the GG sector essentially reflected the deterioration in the finances of state governments in 2015-16. There was a slippage in the consolidated gross fiscal deficit of states from budgeted levels partly due to an increase in capital outlays, and also due to loans and advances to power projects (around ₹990 billion were borrowed under Ujwal DISCOM Assurance Yojana (UDAY) by eight states during 2015-16)9 (Chart 4 and Statement 3). On the financing side, ODCs provided the bulk of resources to the GG sector, followed by OFCs - primarily via debt securities. The contribution of the central bank, however, declined markedly, reflecting lower ways and means advances (WMA) and higher market borrowings. III.3 Rest of the World The acquisition of financial liabilities and assets by the RoW sector was shaped by a variety of push and pull factors. Divergent monetary policies in advanced economies, the slowdown in China and other emerging market economies (EMEs) and uncertainties about the global recovery were the major push factors. The major pull factors included strong domestic macrofundamentals, entrenched macroeconomic stability, and easing of norms for foreign direct investment (FDI). During 2015-16, netflows from the RoW sector to the Indian economy declined further due to portfolio outflows, both debt and equity - despite increased FDI inflows. Net external commercial borrowings (ECBs) to PvNFCs also contracted in 2015-16 as corporates repaid high cost foreign currency denominated borrowings in the process of deleveraging (Chart 5 and Statement 5). 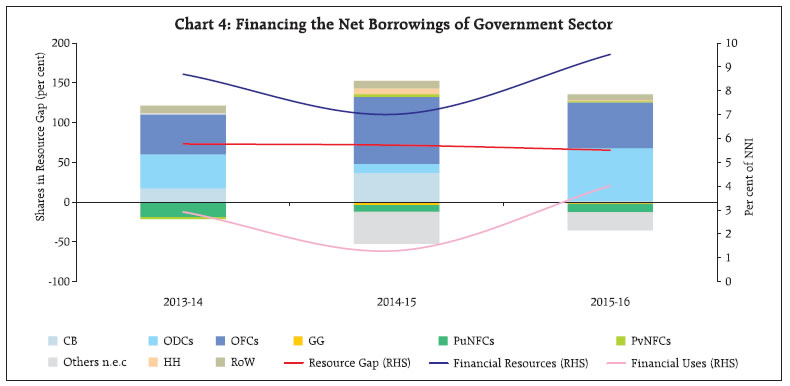 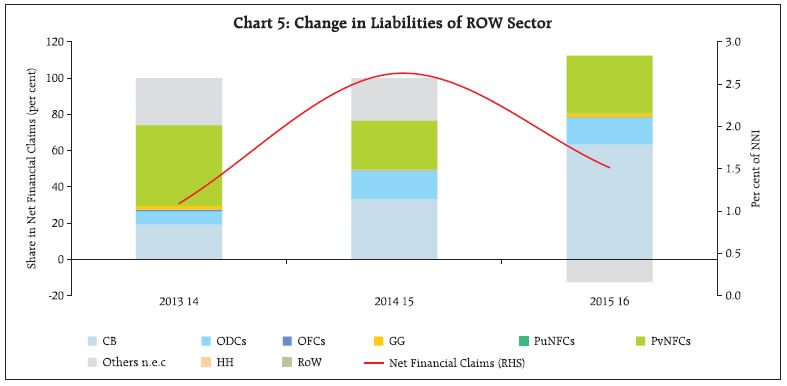 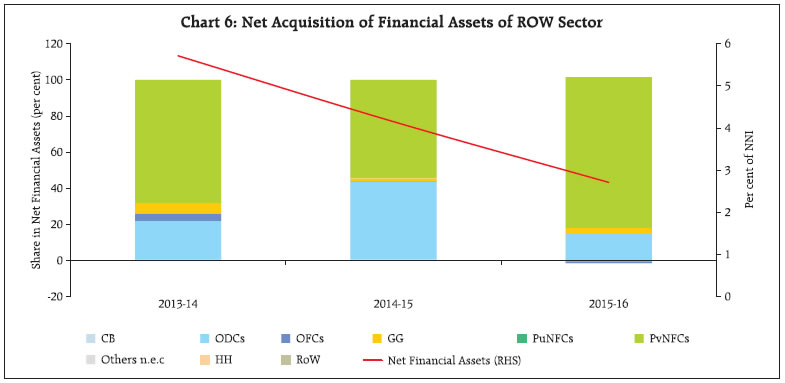 Despite a decline in acquisition of net financial assets by RoW, it was comfortably able to meet India’s external financing requirement during 2015-16 (Chart 6). In the aggregate, net foreign assets of the RoW sector with NFCs and GG increased while their deposits with ODCs declined. III.4 Household Sector The financial surplus of the household sector improved further in 2015-16 (Chart 7 and Statement 4). The share of ODCs in uses of funds of HHs (mainly commercial bank deposits) declined due to reduction in bank deposit rates and higher demand for currency assets. HHs’ assets with OFCs increased sizeably reflecting diversification of household investments in life insurance, retirement funds and mutual funds. However, as in the past,the bulk of the liabilities of HHs was owed to ODCs. III.5 Financial Corporations Financial corporations (FCs) play a dominant role in facilitating flow of resources from surplus units of the Indian financial system to the deficit units. With the growing diversification of the Indian financial system, which has so far been largely bank-based, the financial liabilities of FCs has been on a declining path. III.5.a Depository Corporations: Central Bank The financial liabilities of the Reserve Bank of India expanded considerably during 2015-16 led by currency largely demanded by the household sector. Deposits of scheduled commercial banks (SCBs) with the Reserve Bank and ‘other liabilities and provisions’ also contributed to this increase. The expansion in other liabilities was on account of the increase in the Currency and Gold Revaluation Account (CGRA). On the financial assets side, foreign currency assets invested in debt securities expanded with an accretion of US$ 15.9 billion to the foreign exchange reserves. The Reserve Bank’s investments in central government debt securities increased significantly, providing the wherewithal for sterilisation operations in the context of heavy capital inflows. III.5.b Other Depository Corporations Compositional shifts were observed within the total liabilities of ODCs during 2015-16 (Chart 8 and Statement 1.2). The role of deposits declined in importance as flows from households remained stagnant and deposits from GG sector contracted, while loans from OFCs increased significantly. Deposits of the NFC sector increased further in 2015-16, reflecting easing of resource pressures. Equity liabilities of ODCs also increased with capital infusion by the Union Government and capital raising by private scheduled commercial banks to meet the Basel capital requirements. Financial assets of ODCs declined during 2015-16, largely on account of deceleration in credit to NFCs and OFCs, even as credit flow to HHs and non-profit institutions serving households (NPISHs) increased noticeably (Chart 9). The composition of financial assets of the ODC sector also tilted towards debt securities, reflecting risk avoidance due to deterioration in asset quality. III.5.c Other Financial Corporations Financial liabilities of OFCs declined in 2015-16 on account of contraction in the liabilities of non-deposit taking NBFCs, decline in assets under management with mutual funds and lower gains recorded on the investments of insurance companies (Chart 10 and Statement 1.3). One peculiar feature is that a dominant portion of OFCs’ liabilities are intra-sectoral, which are effectively raised from the household sector through insurance, provident and pension funds, and units of mutual funds. In line with liabilities, the acquisition of financial assets by the OFC sector declined drastically, and strikingly by non-financial corporations, though investment in government bonds also declined. This reflected mark-to-market losses of mutual funds and insurance companies, and a cautious approach adopted by NBFCs in lending to infrastructure projects (Chart 11). IV. Financial Flows by Instruments Compositional shifts in the instrument-wise flow of funds were evident in 2015-16. Currency and deposits, which have been historically the most preferred financial instruments were replaced by debt securities. In terms of acquisition of financial assets, the composition of instruments changed significantly with equity instruments turning out to be the most favoured instrument, followed by loans and borrowings (Chart 12 and Statement 7). V. Select Indicators of Financial Development The role of the financial system in the economy can be gauged by behavioral ratios based on the issue and acceptance of financial liabilities by various sectors of the economy as they borrow from and lend to each other. In a secular perspective, these ratios provide insights into the relationship between financial development and overall economic growth. The finance ratio, defined as the ratio of total financial liabilities to national income, declined to 0.49 in 2015-16 from 0.54 in 2014-15. This suggests a minor deceleration in the pace of financial deepening in the economy, attributable mainly to lower resource mobilisation by the financial sector (Table 2). In this context, it may be noted that the role of external finance seems to have declined for PvNFCs, and the role of intra-sectoral flows has increased. The intermediation ratio reflects the degree of dependence of the economy on the financial sector. Measured as the ratio of liabilities of the financial sector (or secondary issues) to liabilities issued by the non-financial sector (or primary issues), it has fallen sharply to 0.56 in 2015-16 from 0.72 and 0.84 in 2014-15 and 2013-14, respectively. This may also be a factor in explaining the decline in the finance ratio. The relationship between financial development and the growth of physical investment is captured by the financial inter-relation ratio. This ratio defined as the ratio of total financial liabilities to net domestic capital formation, fell to 1.9 in 2015-16 from 2.0 in 2014-15 and 2.2 in 2013-14. This was probably on account of lower input prices facing the non-financial sector. The uptick observed in the new issue ratio-primary issues as a proportion to net domestic capital formation, also captures the increase in primary issuances in 2015-16 over a year ago. | Table 2: Select Indicators of Financial Development: 2013-14 to 2015-16 | | (Amount in ₹ Billion) | | | 2013-14 | 2014-15 | 2015-16 | | 1. Secondary Issues# | 25,956 | 24,811 | 21,333 | | 2. Primary Issues## | 30,728 | 34,563 | 37,928 | | 2.1 Domestic Sectors | 29,650 | 31,688 | 36,101 | | 2.2 Rest of the World | 1,078 | 2,875 | 1,827 | | 3. Total Issues (1+2) | 56,684 | 59,374 | 59,261 | | 4. Net Domestic Capital Formation@ | 25,940 | 29,331 | 31,130 | | 5. National Income@ | 98,977 | 1,09,538 | 1,20,769 | | 6. Finance Ratio (Ratio of 3 to 5) | 0.57 | 0.54 | 0.49 | | 7. Financial Inter-relations Ratio (Ratio of 3 to 4) | 2.19 | 2.02 | 1.90 | | 8. New Issue Ratio ( Ratio of 2 to 4) | 1.18 | 1.18 | 1.22 | | 9. Intermediation Ratio (Ratio of 1 to 2) | 0.84 | 0.72 | 0.56 | # Refers to issues by financial intermediaries (i.e., ODCs and OFCs).
## Refers to issues by all sectors other than financial intermediaries.
@ At Current Prices. | VI. Conclusion The FoF accounts for 2015-16 provide interesting insights into financing of the Indian economy. Some of the key highlights are set out below. • From an economy wide perspective, the decline in overall financial liabilities in the economy largely reflects heightened stress in the balance sheets in the ODC and NFC sectors. • The decline in net financial flows from the RoW sector also reflects subdued domestic demand conditions. • Debt securities emerged as the most dominant instrument of acquisition of financial liabilities, while equity turned out to be the most favoured instrument for acquisition of financial assets. • In the financial sector, liabilities of ODCs during 2015-16 came down mainly due to lower overall deposits, while those of OFCs contracted mainly on account of valuation changes. • For non-financial corporations, the resource deficit of PvNFCs continued to decline, benefitting from sustained softening of global commodity prices. By contrast, the resource gap of PuNFCs widened, mostly on account of lower revenue growth. Moreover, operating profits of PvNFCs also rose sizeably. • The RoW sector remained a major contributor of finance for PvNFCs even though its share was lower than in the previous year. • As far as households are concerned, their financial surpluses continued to increase in 2015-16, with a tilt towards OFCs on account of lower interest rate on deposits offered by the banking sector, however, households increased their reliance on ODCs for credit purposes. The trends in financial flows during 2015-16 throw some valuable insights into the stage of financial development and India’s economic growth. Household surplus will continue to act as the lynchpin to Indian financial flows. As the Indian economy diversifies from traditionally a bank-based financial system, the need for increasing the size, depth and liquidity of the financial markets to support the weak investments, particularly in the private sector, cannot be overemphasised for propelling a virtuous cycle of growth.
|