The financial resource gap of the economy narrowed in 2014-15 in an environment characterised by ongoing fiscal consolidation, decline in global commodity prices and moderation in net capital formation. Currency and deposits remained the most preferred financial instruments. Indicators of financial interconnectedness highlighted the growing importance of non-bank financial corporations as suppliers of finance in the Indian economy. I. Introduction Flow of Funds (FoF) accounts map instrument-wise financial flows between different sectors of the economy on a whom-to-whom basis. This article presents the FoF for 2014-15 - which has been aligned with the United Nations System of National Accounts (SNA), 2008 - along with revised data commencing from 2011-12, the earliest year for which national accounts under the new series are available. Furthermore, the sectoral classification of FoF in this article corresponds more closely with that adopted by the Central Statistics Office (CSO) in the new series of national accounts as well as in its ‘Sequence of Accounts’1. The FoF accounts divide the economy into five institutional sectors, namely (i) the financial corporations sector, which includes the central bank (CB), other depository corporations (ODCs) - commercial banks, co-operative banks, deposit-taking non-banking financial companies (NBFCs-D) and deposit-taking housing finance companies (HFCs-D) - and other financial corporations (OFCs) that mainly comprise all-India financial institutions, non-deposit taking nonbanking financial companies (NBFCs-ND), non-deposit taking housing finance companies (HFCs-ND), insurance corporations, provident funds and pension funds and mutual funds; (ii) non-financial corporations, including both public2 and private3 non-financial corporations; (iii) general government (GG) that comprises the central government and the state governments4; (iv) the household (HH) sector; and (v) rest of the world (RoW).5 Financial instruments across sources and uses of funds of the various institutional sectors include currency and deposits, debt securities, loans and borrowings, equity, investment funds (such as mutual funds), insurance, pension and provident funds, monetary gold, other accounts (including trade debt) and other liabilities/assets not elsewhere classified (NEC). The remainder of the article is organised into six sections. Section II presents the financial resource gaps across different sectors. Section III analyses movements in sectoral and instrument-wise FoF. Measures of financial interconnectedness and select indicators of financial development are covered in Section IV. The divergence in the overall saving-investment gap and financial resource gap is presented in Section V. Concluding observations are set out in Section VI. II. Sectoral Financial Resource Gaps The overall financial resource balance in the economy - measured by the net acquisition of financial assets less net increase in liabilities - as a proportion to net national income (NNI) at current market prices, narrowed in 2014-15 from its level a year ago. This improvement was primarily driven by a reduction in net borrowings of non-financial corporations, which benefited from saving on input costs due to decline in commodity prices, and general government reflecting the ongoing fiscal consolidation at the central government level. Net lending by financial corporations moderated from a year ago, mainly on account of the deceleration in bank credit on asset quality concerns in an environment of subdued investment activity. Although net lending by households was unchanged from its preceding year’s level, they remained the largest suppliers of finance to the economy (Table 1). | Table 1: Sectoral Financial Resource Balance (% of NNI at current market prices) | | | 2011-12 | 2012-13 | 2013-14 | 2014-15 | | 1 Non-Financial Corporations | -9.0 | -7.6 | -6.6 | -5.2 | | 1.a Public Non-Financial Corporations | -0.6 | -0.9 | -1.9 | -1.1 | | 1.b Private Non-Financial Corporations | -8.4 | -6.7 | -4.8 | -4.1 | | 2 Financial Corporations | 2.1 | 1.4 | 1.8 | 0.5 | | 3 General Government | -9.8 | -7.6 | -8.8 | -8.5 | | 4 Household Sector | 8.3 | 8.4 | 8.7 | 8.7 | | 5 Total (1+2+3+4) | -8.4 | -5.4 | -4.9 | -4.5 | III. Sectoral Movements in FoF6 Total liabilities of all sectors (including the RoW sector) declined steadily from over 60 per cent of NNI in 2011-12 to about 53 per cent in 2014-15 (Chart 1). Private non-financial corporations (PvNFCs), ODCs and the central government have generally accounted for relatively higher shares; even so, the combined share of these three sectors in total liabilities declined from 43 per cent in 2011-12 to 32 per cent in 2014-15. On the other hand, the combined shares of OFCs, the RoW and state governments rose to 15 per cent in 2014-15 from 7 per cent in 2011-12.
III.1 Non-Financial Corporations III.1.a Private Non-Financial Corporations7 With softer international commodity prices, operating expenses of PvNFCs decelerated and more than offset the decline in sales, resulting in an improvement in their profit margins. On the other hand, the presence of considerable slack and the lacklustre business environment muted their capital expenditure and borrowing requirements. As a consequence, the financial resource gap of the PvNFC sector declined from its level a year ago (Chart 2 and Statement 2.2). In terms of its financing, the share of the RoW sector increased substantially in 2014-15 in the form of robust foreign investment inflows, both direct and portfolio. Financing by insurance corporations and NBFCs-ND also remained strong. While bank financing declined - reflecting risk aversion among banks on account of stressed balance sheets - the improvement in the profitability of PvNFCs enabled them to build up financial assets in the banking system in the form of deposits. III.1.b Public Non-Financial Corporations8 Pulled down by a large decline in capital expenditure, the financial resource balance of public non-financial corporations (PuNFCs) narrowed, notwithstanding a contraction of 20 per cent in net profits. While DISCOMs faced an accumulation of liabilities to the banking system and OFCs, central public sector non-financial enterprises (CPSNFEs) improved their resource position on account of the decline in fixed investment alluded to earlier (Chart 3 and Statement 2.1). III.2 General Government The moderation in the financial resource gap of the GG sector essentially reflected the improvement in the finances of the central government in 2014-15. Although the central government remained steadfast in its commitment to fiscal targets, there was a slippage in the gross fiscal deficits of states from budgeted levels due to an increase in capital outlays and some categories of revenue expenditure (Chart 4 and Statement 3). On the financing side, OFCs - primarily insurance companies - provided the bulk of resources to the GG sector. This was followed by ODCs, although lower than in the preceding year. The contribution of the RoW sector, however, increased in 2014-15, reflecting the issuance of non-interest bearing non-negotiable rupee securities to the International Monetary Fund (IMF) as part of the payments towards quota subscriptions under the 14th general quota review by which India’s quota is the eighth largest among IMF member countries.9 There was also an increase in the holdings of government securities by foreign portfolio investors. III.3 Rest of the World A combination of push factors – ultra accommodative monetary policy stances in advanced economies – and pull factors – improved perceptions about the Indian economy; easing of norms for foreign direct investment; allowing portfolio investors to invest coupons from government securities outside the residual maturity limit of three years set in July 2014 (which was subsequently extended to corporate bonds) – resulted in substantial financial flows into India from the RoW sector. While these inflows mainly took the form of equity investments, flows into debt securities also picked up from a contraction in the preceding year. Net inflows in the form of loans or external commercial borrowings by PvNFCs moderated during 2014-15, mainly due to large repayments. In the aggregate, net foreign assets of the RoW sector in PvNFCs and GG picked up in 2014-15 (Chart 5 and Statement 5). With accretions to non-resident deposits with Indian commercial banks falling away in relation to the bulge of FCNR(B) deposits accumulated through the special swap window in the previous year, the RoW sector’s financial assets in the form of deposits with ODCs moderated.  Financial inflows from the RoW sector comfortably met the economy’s external financing requirement during 2014-15 and also enabled a substantial accretion to foreign exchange reserves, which were largely invested in foreign debt securities (Chart 6). III.4 Household Sector The financial surplus of the household sector, as a share of NNI, remained unchanged during 2014-15 (Chart 7 and Statement 4). Among its financial uses, the share of ODCs (mainly reflecting commercial bank deposits) recorded a moderate decline during 2014-15, partly in response to the reduction in term deposit rates. On the other hand, the shares of other financial corporations (reflecting household investment in instruments such as insurance funds, provident and pension funds and mutual funds) and the central bank (reflecting currency holdings of households) increased. III.5 Financial Corporations III.5.a Central Bank Financial flows emanating from the RBI during 2014-15 were influenced by (i) the institution of a revised liquidity management framework with effect from early September 2014; and (ii) the changes in the RBI’s accounting policies as recommended by the Technical Committee (Chairman: Shri Y. H. Malegam). A major accounting change relates to the classification of repos under the Liquidity Adjustment Facility (LAF) and Marginal Standing Facility (MSF) as lending to commercial and co-operative banks (instead of purchase of government securities) and reverse repos as deposits with the RBI (instead of sale of government securities). As a result, net repo operations are now being shown as the RBI’s credit to the banks and the commercial sector (instead of the RBI’s credit to the general government). 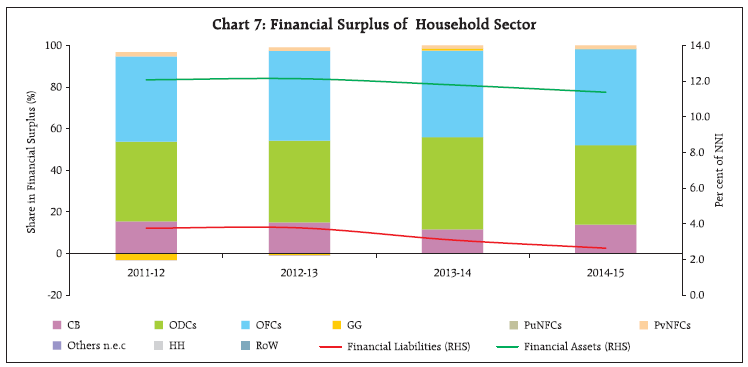 The rate of expansion of total financial liabilities of the RBI was considerably lower during 2014-15 than in the previous year. On the one hand, the demand for currency (largely by the household sector) increased at a faster pace while deposits of banks (ODCs) with the RBI under ‘deposits - others’ also increased substantially, largely reflecting LAF reverse repo operations. On the other hand, banks’ deposits with the RBI - representing banks’ reserves both statutory and excess - slackened, pari passu with a slowdown in their deposit mobilisation from the public. At the same time, balances held in the Currency and Gold Revaluation Account (CGRA), shown under ‘other liabilities’ of the RBI, declined during 2014-15 as against a substantial expansion in the previous year. On the financial assets side, foreign currency assets of the RBI expanded substantially during 2014-15 in the face of strong financial inflows. LAF reverse repo operations and OMO sales conducted with a view to sterilising the domestic liquidity impact of foreign exchange interventions as also the accounting changes alluded to above were reflected in a contraction in the RBI’s holdings of central government debt securities, offsetting the increase in loans (LAF repos and marginal standing facility) provided to banks. III.5.b Other Depository Corporations Compositional shifts were observed within the total liabilities of ODCs during 2014-15 (Chart 8 and Statement 1.2). First, the base effect of the substantial mobilisation of FCNR(B) deposits from the rest of the world during 2013-14 was clearly evident. Secondly, in the face of lower credit off-take and the consequent reduction in resource requirements, the issuances of certificates of deposit (CDs) by banks dwindled in 2014- 15 and turned in a substantial outflow. Thirdly, deposits of PvNFCs increased during 2014-15, reflecting easing of resource pressures. Fourthly, loans from the RBI increased significantly, as discussed earlier. Finally, deposits of the household sector were sluggish during 2014-15, even as they remained the predominant component. Financial assets of ODCs declined during 2014-15, largely on account of slackening of credit to private and public non-financial corporations as well as a reduction in intra-ODCs transactions (Chart 9). Partially offsetting this contraction were the sizable increase in credit to the OFCs as well as higher deposits with the RBI, as discussed earlier.
III.5.c Other Financial Corporations Financial liabilities of OFCs picked up in 2014-15, largely driven by the substantial issuances of nonconvertible debentures (NCDs) and commercial paper (both classified under debt securities) by non-deposit taking NBFCs.10 Competitive rates vis-à-vis bank lending rates have boosted the share of these securities in the total liabilities of OFCs in recent years (Chart 10 and Statement 1.3). Mutual funds (under the OFC sector) continued to be the predominant holder of CPs, even as the share of banks (under ODCs) increased sharply during 2014-15. Despite a fall in their share, households remained the predominant source of funds for the OFCs, largely reflecting their investment in life insurance and provident funds. 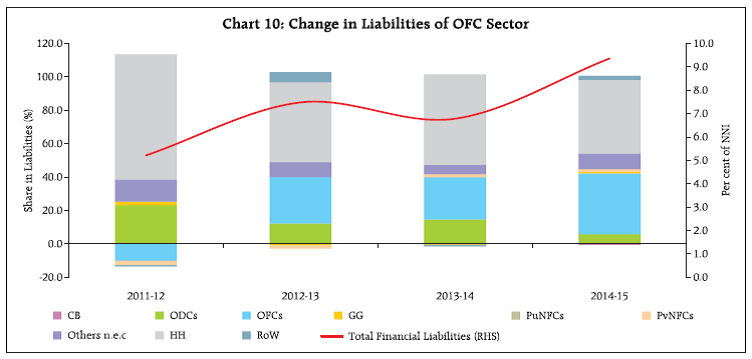 On the financial assets side, intra-sectoral flows expanded substantially, particularly amongst NBFCs- ND, insurance companies and mutual funds. The share of PvNFCs also moved up in 2014-15, mirroring the comparatively stronger expansion in NBFC-ND’s credit to sectors such as infrastructure, medium and largescale industries and transport (Chart 11). Investment by OFCs (largely insurance companies) in debt securities of the central and state governments increased further in 2014-15. III.8 Financial Flows by Instruments Compositional shifts in the instrument-wise flow of funds were evident in 2014-15. Currency and deposits were the preferred financial instruments as in previous years, even as debt securities gained importance in 2014-15 in view of the significant increase in the foreign currency assets of the RBI. The share of loans and borrowings declined steadily over 2011-12 to 2014-15. This was largely because of the slackening of non-food credit extended by ODCs to PvNFCs and increase in issuance of CPs to OFC sector. In the aggregate, debt securities, deposits and loans and borrowings accounted for more than 60 per cent of total liabilities issued during 2011-12 to 2014-15. Amongst the remaining financial instruments, the share of ‘equity and investment fund shares’ and ‘insurance, pension and provident funds’ increased to 17 per cent and 6.1 per cent, respectively in 2014-15 (Chart 12 & Statement 7). IV.1 Financial Interconnectedness In the context of FoF, the power of dispersion index (PDI) and the sensitivity of dispersion index (SDI) are alternative measures of financial interconnectedness across sectors of the economy11. While the PDIs of all sectors have hovered around unity since 2011-12, the contour of the PDI shifted somewhat towards the RoW during 2014-15, reflecting increasing inter-linkages with the global economy (Chart 13). On the other hand, SDIs for the ODCs and households have been much higher than those of the other sectors, largely reflecting their significant roles as suppliers of finance (Chart 14). Even so, the SDI contour for 2014-15 moved away from ODCs and households towards OFCs, in particular. This underlines the growing importance of OFCs as finance suppliers, not only within their own sector but also to PvNFCs and the government sector.
IV. 2 Select Indicators of Financial Development The role of the financial system in the economy can be gauged by behavioural ratios based on the issue and acceptance of financial liabilities by various sectors of the economy as they borrow from and lend to each other. In a secular perspective, these ratios provide insights into the relationship between financial development and overall economic growth. The finance ratio, defined as the ratio of total financial liabilities in a year to national income, declined to 0.53 in 2014-15 from 0.56 in 2012-13. This suggests a deceleration in the pace of financial deepening in the economy, attributable to the moderation in liabilities issued by ODCs in 2014-15 (Table 2). The intermediation ratio reflects the degree of dependence of the economy on the financial sector. Measured as the ratio of liabilities of the financial sector (or secondary issues) to liabilities issued by the non-financial sector (or primary issues), it has shown an uneven profile in recent years – falling to 0.72 in 2013- 14 before rising to 0.74 in 2014-15. The pick-up in the ratio in 2014-15 occurred on the back of an increase in intra-sectoral liabilities of the OFCs, particularly those issued to insurance companies. The relationship between financial development and the growth of physical investment is captured by the financial inter-relations ratio, defined as the ratio of total liabilities issued to net domestic capital formation. The ratio dipped to 1.8 in 2012-13 before picking up to around 2 in 2014-15, which is indicative of total issuances of liabilities outpacing physical investment. V. Correspondence between FoF and Saving- Investment Balances The CSO’s sequence of accounts provides measures of sectoral and economy-wide saving-investment balances. The FoF accounts depict the financing of these resource balances, although gaps in coverage, valuation and timing impede a perfect correspondence between the two. Nevertheless, directional co-movements are discernible (Chart 15 and Annex I). | Table 2: Financial Ratios: 2011-12 to 2014-15 | | (Amount in ₹ Billion) | | | 2011-12 | 2012-13 | 2013-14 | 2014-15 | | 1. Secondary Issues# | 18,584 | 22,257 | 23,374 | 24,807 | | 2. Primary Issues## | 27,800 | 27,118 | 32,437 | 33,448 | | 2.1 Domestic Sectors | 27,634 | 26,103 | 29,825 | 29,462 | | 2.2 Rest of the World | 167 | 1,015 | 2,612 | 3,986 | | 3. Total Issues (1+2) | 46,384 | 49,375 | 55,811 | 58,255 | | 4. Net Domestic Capital Formation@ | 24,858 | 27,828 | 27,131 | 29,430 | | 5. National Income@ | 77,421 | 87,746 | 99,344 | 1,10,076 | | 6. Finance Ratio (Ratio of 3 to 5) | 0.60 | 0.56 | 0.56 | 0.53 | | 7. Financial Inter-relations Ratio (Ratio of 3 to 4) | 1.87 | 1.77 | 2.06 | 1.98 | | 8. New Issue Ratio (Ratio of 2 to 4) | 1.12 | 0.97 | 1.20 | 1.14 | | 9. Intermediation Ratio (Ratio of 1 to 2) | 0.67 | 0.82 | 0.72 | 0.74 | #: Refers to issues by financial intermediaries (i.e. ODCs and OFCs).
##: Refers to issues by all sectors other than financial intermediaries.
@ At current prices. |
V. Conclusion The FoF accounts for 2014-15 provide interesting insights into the working of the Indian economy and the movements in financial flows driven by it. From an economy-wide perspective, there was a decline in issuances of financial liabilities in the economy reflecting moderation in domestic resource requirements. This is corroborated by a narrowing of the current account deficit. Within the financial sector, a noteworthy development was the rising importance of OFCs (other than deposit-taking entities) pointing to their growing role in intermediating financial flows in the economy. Moreover, they also increased their share in households’ financial surplus, reflecting a shift in preference of the latter’s choice of savings instruments for mutual funds, insurance and pension funds and away from the traditional bank deposits. At the same time, financial linkages among the OFCs proliferated, increasing their vulnerability to intra-sectoral shocks. Turning to the corporate sector, the decline in financial resource requirements alongside compositional shifts in financing patterns is indicative of several factors at work – asset quality concerns among banks; and deleveraging and repayments to the banking sector. In addition, a sizeabl pick-up in deposits by the corporate sector in the banking system narrowed its financing gap. As regards households, their financial surplus remained unchanged but underwent a compositional change, migrating from depository corporations to other financial corporations. This could imply greater sensitivity to return differentials across financial instruments and consumption smoothing. Key indicators thrown up by the FoF point to growing financial intermediation in the economy. While this is indicative of institutional deepening, the relatively higher financial inter-relations ratio suggests higher absorption of resources into uses within the financial sector in view of subdued capital formation in the economy.
Annex I | Net Saving and Net Investment of Different Sectors [As percentage of Net National Income (NNI) at current market prices] | | (Per cent) | | | 2011-12 | 2012-13 | 2013-14 | 2014-15 | | 1.i Public Non-Financial Corporations | | | | | | (i) Net Saving | -0.1 | -0.2 | -0.3 | -0.5 | | (ii) Net Capital Formation | 2.7 | 2.5 | 2.2 | 2.0 | | (iii) Resource Gap [(i) - ii)] | -2.5 | -2.3 | -2.3 | -2.4 | | 1.ii Private Non-Financial Corporations | | | | | | (i) Net Saving | 4.8 | 5.2 | 6.2 | 7.9 | | (ii) Net Capital Formation | 9.9 | 10.4 | 9.9 | 10.7 | | (iii) Resource Gap [(i) - ii)] | -4.8 | -5.1 | -3.3 | -2.3 | | 2 Financial Corporations | | | | | | (i) Net Saving | 3.4 | 3.4 | 2.9 | 3.0 | | (ii) Net Capital Formation | 0.5 | 0.3 | 0.3 | 0.4 | | (iii) Surplus [(i) - ii)] | 3.4 | 3.5 | 3.0 | 2.9 | | 3 General Government | | | | | | (i) Net Saving | -3.3 | -3.0 | -2.7 | -2.3 | | (ii) Net Capital Formation | 2.7 | 2.7 | 3.0 | 3.6 | | (iii) Resource Gap [(i) - ii)] | -7.0 | -6.8 | -6.5 | -5.9 | | 4 Household Sector | | | | | | (i) Net Saving | 22.5 | 21.0 | 19.3 | 17.3 | | (ii) Net Capital Formation | 13.7 | 12.3 | 10.3 | 8.2 | | (iii) Surplus [(i) - ii)] | 8.7 | 8.8 | 9.1 | 9.1 | | 5 Total (1 to 4) | | | | | | (i) Net Saving | 27.2 | 26.3 | 25.4 | 25.3 | | (ii) Net Capital Formation | 29.5 | 28.2 | 25.6 | 24.8 | | (iii) Resource Gap [(i) - ii)] | -2.3 | -1.8 | -0.1 | 0.5 | | 6 Valuables | 3.3 | 3.1 | 1.6 | 1.8 | | 7 Errors and Omissions | -0.7 | 0.4 | 0.0 | 0.2 | | 8 Overall Resource Gap [5(iii)-6-7] | -4.9 | -5.3 | -1.7 | -1.5 | Note: The sectoral data on net saving are adjusted for capital transfers receivable/payable.
Source: Central Statistical Office. |
 |