The global economy is continuing with the heightened uncertainties emanating from fragile geopolitics and supply chain pressures. The domestic economy has navigated the external uncertainties well, underpinned by healthy demand conditions and resilient performance of the industrial and services sector. Headline retail inflation inched up in June while core inflation, especially excluding precious metals remained low. Liquidity conditions improved further, supporting the ongoing robust credit growth. India’s external sector remains steady with improving outlook, aided by inflows of foreign investments. Introduction The global economy has been navigating through a tumultuous phase with high uncertainty. The breakdown of ceasefire talks in West Asia has again thrown the global supply chain networks in turmoil, reversing fragile recoveries. Artificial intelligence (AI) led technological transformation and related investments are continuing to support the global economy. Prospects of easing tensions in West Asia through June helped stabilise markets and business sentiment, although the truce remained short lived with the collapse of the peace arrangement in early July, pushing the outlook for global trade and inflation risks back into the zone of uncertainty. Moreover, volatility in AI and technology related stocks have also picked up of late, adding to the uncertainties facing the financial markets. Considering the economic impact of the war in West Asia which is getting partly offset by positive momentum in the global technology cycle, the International Monetary Fund (IMF), in its July 2026 World Economic Outlook Update, revised down its global growth forecast for 2026 by 10 basis points relative to its April projections. The global headline inflation is also projected to rise from 4.1 per cent in 2025 to 4.7 per cent in 2026, reflecting persistent price pressures from the supply constraints. High-frequency indicators for June suggest resilience in global economic activities. After being steady in April and May, global composite purchasing manager’s index (PMI) expanded in June as services activities strengthened. Commodity prices moderated with the prices of crude oil, natural gas, fertiliser and industrial metals largely retracing back to their pre-conflict levels in early July. However, a renewed flare-up in West Asia tension has brought back uncertainty to energy markets, with crude oil prices firming up. Global equity markets rallied in June on easing tensions and prospects of lower crude oil prices. However, markets turned volatile in July amidst fears of renewed conflict and correction in technology stocks on valuation concerns. The US 10-year treasury yield remained elevated in June; it hardened further in early July amidst expectations of a tighter monetary policy before easing in response to soft inflation data. The central bank actions diverged across the economies depending on the evolving growth-inflation balance. The domestic economy continued to remain buoyant in June. Demand conditions remained healthy, supported by a pickup in rural demand and firm urban demand. High frequency indicators suggest robust industrial performance and a resilient services sector. There has been a delayed kharif sowing due to the uneven progress in southwest monsoon amidst the prevailing El Niño conditions. High public foodgrain stocks should provide some cushion against price pressures. The momentum in external trade sustained as reflected in high growth in exports and imports in Q1:2026-27. Headline consumer price index (CPI) inflation edged up in June driven by food and fuel components. Core (CPI excluding food and fuel) inflation, however, remained unchanged. Wholesale price index (WPI) inflation inched up in June. The Centre’s fiscal deficit was higher during April-May 2026-27 as compared to the corresponding period of the previous year while the fiscal deficit of the states declined. System liquidity moderated in the second half of June. It improved in the first half of July amidst waning pressure from the tax outflows and faster government spending before tightening later in the month. The weighted average call rate (WACR) hovered in the upper half of the policy corridor in June and moved towards the policy rate in July. The yields on 91-day treasury bills, 3-month commercial papers, certificates of deposit and dated government securities also moderated in June and into early July, before rebounding following the breakdown of the ceasefire talks in West Asia. The gross and net foreign direct investment (FDI) were higher in April-May 2026 than the previous year. Net foreign portfolio investment (FPI) flows turned positive in June and maintained positive flows in July amidst policy support and easing geopolitical tensions. The Indian equity markets gained in June. However, following the cessation of the ceasefire in early July, equity markets remained range bound. India’s key external sector vulnerability indicators remained well-anchored as at end-March 2026. Foreign exchange reserves continued to remain comfortable. In view of the strengthening of the US dollar, currencies of the major emerging market economies (EMEs) including India depreciated in July. The remainder of the article is presented in four sections. Section II covers the evolving developments in the global economy. Section III provides an assessment of domestic macroeconomic conditions. Section IV presents the financial conditions prevailing in India, while Section V offers concluding observations. II. Global Setting The IMF, in its July 2026 update for World Economic Outlook, revised the global growth projection for 2026 downwards by 10 basis points vis-à-vis its projections in April 2026, reflecting the adverse effects of the West Asia conflict, partly offset by stronger AI-driven investments. The growth in 2027 is projected to be higher. However, there may be asymmetric recovery across countries (Table II.1). The global headline inflation is expected to rise to 4.7 per cent in 2026 from 4.1 per cent in 2025 and decline to 3.9 per cent in 2027. Overall, the risk to growth outlook remains tilted to the downside, clouded by the possibilities of renewed tensions in West Asia, associated disruptions in global supply chains and sustained inflationary pressures. There was a moderation in geopolitical risk through June, supported by sustained progress in diplomatic efforts in West Asia (Chart II.1a). This was reflected in easing concerns over energy supply and global trade. However, financial market volatility in EMEs ticked up in early July due to capital outflows amidst higher US yields, geopolitical tensions and pick-up in crude prices. In contrast, volatility remained largely contained in advanced economies (AEs), supported by robust earnings, easing inflation concerns and safe-haven capital inflows (Chart II.1b). | Table II.1: IMF: GDP Growth Projections of Select AEs and EMDEs | | Projection for | 2026 | 2027 | | Month of Projection | April 2026 | July 2026 | April 2026 | July 2026 | | World | 3.1 | 3.0 | 3.2 | 3.4 | | Advanced Economies (AEs) | 1.8 | 1.7 | 1.7 | 1.8 | | US | 2.3 | 2.3 | 2.1 | 2.2 | | UK | 0.8 | 1.0 | 1.3 | 1.3 | | Euro area | 1.1 | 0.9 | 1.2 | 1.2 | | Japan | 0.7 | 0.6 | 0.6 | 0.7 | | Emerging Market and Developing Economies (EMDEs) | 3.9 | 3.8 | 4.2 | 4.5 | | Emerging Market and Developing Europe | 2.0 | 1.9 | 2.1 | 2.1 | | Russia | 1.1 | 1.1 | 1.1 | 1.1 | | Emerging and Developing Asia | 4.9 | 5.0 | 4.8 | 4.8 | | India# | 6.5 | 6.4 | 6.5 | 6.7 | | China | 4.4 | 4.6 | 4.0 | 4.1 | | Latin America and the Caribbean | 2.3 | 2.4 | 2.7 | 2.7 | | Mexico | 1.6 | 1.2 | 2.2 | 1.9 | | Brazil | 1.9 | 2.4 | 2.0 | 2.2 | | Middle East and Central Asia | 1.9 | 0.7 | 4.6 | 6.5 | | Sub-Saharan Africa | 4.3 | 4.3 | 4.4 | 4.5 | | South Africa | 1.0 | 1.1 | 1.3 | 1.3 | Note: #: India’s data is on a fiscal year basis (April-March), while for all other countries it is for calendar years.
Source: IMF’s World Economic Outlook Update, July 2026. | Traffic through the Strait of Hormuz witnessed a brief recovery in the later part of June, with vessel transits rebounding from near-zero levels following the memorandum of understanding (MoU) between the US and Iran (Chart II.2). However, intermittent skirmishes and subsequently the collapse of the US-Iran peace agreement in July have stymied a return to normalcy. The global output, as reflected in the composite PMI, expanded in June after remaining steady during April-May 2026. Manufacturing, which had outperformed services since the onset of the West Asia conflict, saw its growth ease slightly due to inventory cycle shifts.1 Services activity strengthened, supported by lower energy prices easing operating costs that benefitted consumer-services industries. New export orders continued to remain in contraction, reflecting the persistence of subdued international trade environment (Table II.2).
Major EMEs such as India and China, despite sequential moderation, grew faster than AEs in terms of composite output in June (Chart II.3a). New export orders mostly remained in contraction, with India, South Africa, Japan and Italy being the notable exceptions (Chart II.3b). Commodity prices eased in June, driven by crude oil, natural gas, fertiliser, and metal prices. The Brent crude futures reflected evolving geopolitical developments in West Asia (Chart II.4).
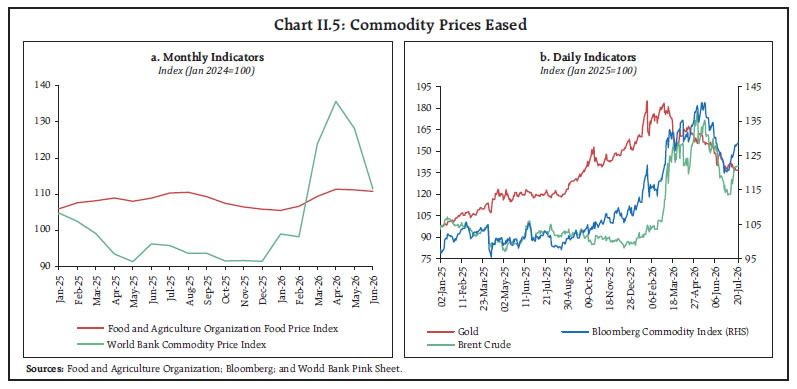
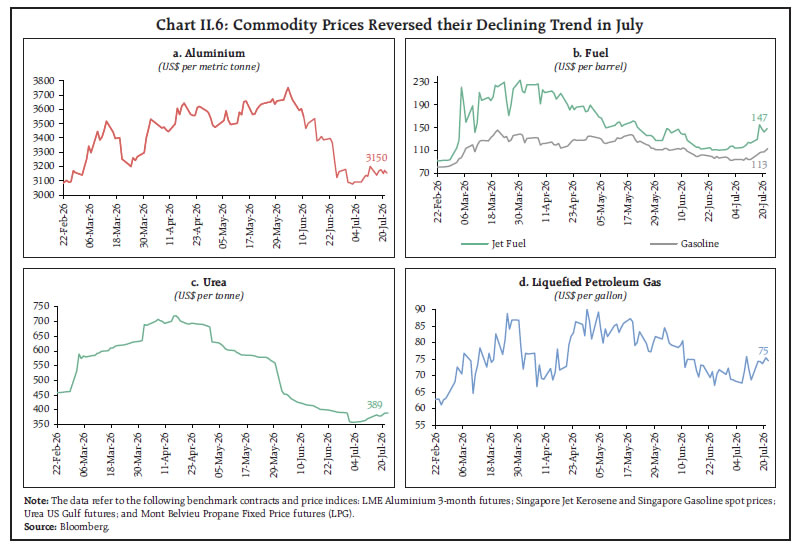
The Food and Agriculture Organization (FAO) food price index was almost steady in June on account of moderation in prices of sugar, cereals, and dairy products, coupled with an increase in prices of vegetable oils and meat. Gold prices continued to moderate in July amidst expectations of higher interest rates and a stronger US Dollar (Chart II.5a and b). Prices of commodities like crude oil, fertilisers and industrial metals dropped to their pre-conflict levels in early July, unwinding much of the geopolitical risk premium accumulated over the months (Chart II.6). However, renewed tensions in West Asia have added uncertainty to global commodity markets, particularly for energy prices. 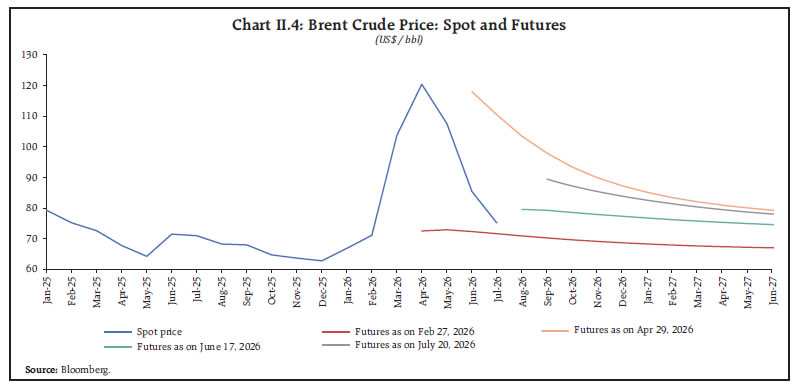
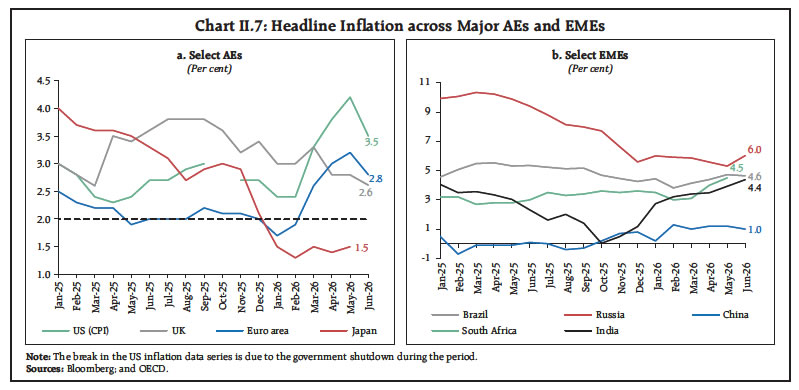 Inflation across major AEs and EMEs continued to remain elevated in June. Among major AEs, inflation in the US moderated on the back of normalisation of gasoline price. In the Euro area, the fall in Brent crude oil price drove headline inflation lower. Inflation eased in the UK, led by decline in transport costs. In Japan, inflation witnessed an uptick in May after the expiration of government fuel subsidy (Chart II.7a). Among EMEs, inflation marginally softened in Brazil, driven by lower food and beverages and housing prices. Easing energy and commodity prices kept inflation benign in China. Inflation, however, rose in Russia, led by gasoline shortages (Chart II.7b). Equity markets generally gained on the back of easing geopolitical tensions following the progress in US-Iran peace negotiations and lower crude oil prices in June. Markets turned volatile in early July, led by a sell-off in technology stocks and renewed geopolitical tensions in West Asia. S&P 500 fell in June amidst higher-for-longer interest rate expectations and profit booking in tech stocks, before stabilising in early July. Euro area equities maintained their strength in June and early July, with gains broadening across industrials, financials, and defence stocks. Nikkei 225 posted positive returns in June before showing two-way movements in early July, on global technology sell-off, currency volatility and global macroeconomic uncertainty. The emerging market equities corrected towards the end of June from their all-time highs on profit booking after AI rally. The fall has deepened further in July, driven by concerns over collapse of US-Iran peace deal (Chart II.8a). During June, the US 10-year treasury yield remained elevated while exhibiting volatility. It hardened further in early July amidst expectations of a tighter monetary policy before easing in response to soft inflation data (Chart II.8b). The US Dollar Index strengthened during June, but pared gains in July, driven by easing inflation (Chart II.8c). Foreign investors reduced exposure to emerging market equities in June, while debt inflows partly offset the sell-off (Chart II.8d). 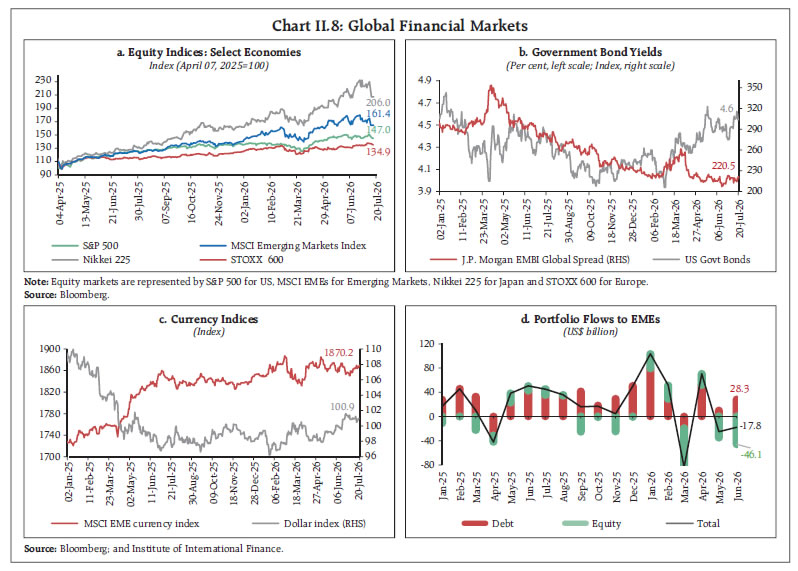 Central banks’ policy decisions remained divergent but cautious in June (Chart II.9). Amidst rising inflationary pressures, the Euro area and Japan raised policy rates and signalled further monetary tightening. The US, the UK, Switzerland and Australia held policy rates. Among EMEs, Russia and Brazil lowered policy rates while Indonesia and Philippines raised rates. Mexico and Thailand held policy rates. In July, New Zealand and South Korea raised their benchmark interest rates to contain inflationary pressures while Malaysia and Canada kept their overnight policy rates unchanged in view of stable prices and resilient economic growth. China held its policy rate, reflecting caution amidst the West Asia conflict. III. Domestic Developments The high-frequency indicators for June suggest sustained economic activity. Industrial growth remained strong, and the services sector showed resilience. Aggregate Demand High-frequency indicators reflected strong economic activity in June. E-way bills continued to achieve double-digit growth. Goods and Services Tax (GST) revenue growth picked up during the month, driven largely by a sharp increase in tax revenues from imports.2 Meanwhile, growth in petrol and diesel consumption gained strength in June despite an upward revision in the prices. However, the overall consumption of petroleum products continued to fall, albeit at a slower pace due to decline in consumption of liquified petroleum gas (LPG), bitumen and naphtha. Electricity demand continued to register double digit growth partly due to warm conditions and the delayed onset of monsoon. The monthly number of toll transactions remained on a declining trajectory following the introduction of the FASTag Annual Pass scheme in August 20253. Digital payments value registered steady growth driven by Real-Time Gross Settlement (RTGS) transactions.4 Both volume and value of digital transactions maintained double digit growth, with the value growth of more than 20 per cent for the first time in the last 19 months (Table III.1). 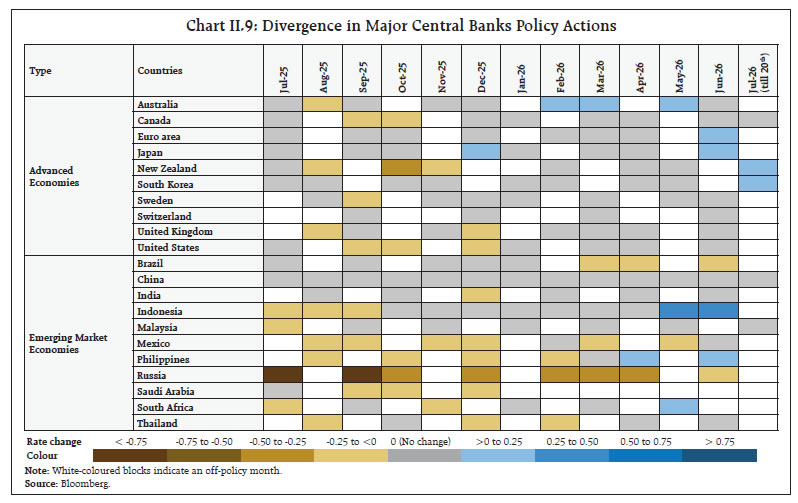 Domestic demand was supported by a sharp pick-up in rural demand in June. Tractor sales accelerated with the commencement of kharif sowing activities, while two-wheeler sales recorded robust growth—underpinned by strong entry-level demand, gradual normalisation of supply chains, and rising electric vehicle adoption5. Urban demand also remained firm, with passenger vehicle sales benefiting from sustained demand for SUVs, new model launches, and attractive financing schemes. The domestic air passenger traffic declined amidst capacity rationalisation by major aviation carriers and escalating aviation turbine fuel costs (Table III.2). 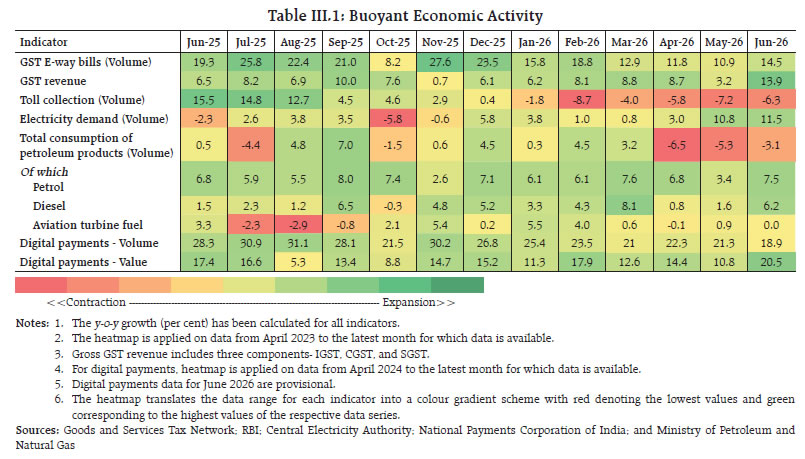 In June, the all-India unemployment rate measured by the current weekly status, remained stable with a decline in rural unemployment rate, while the urban unemployment rate ticked up.6 The labour force participation rate and worker-population ratio also remained unchanged as compared to previous month in rural areas, whereas they increased marginally in urban areas.7 While PMI employment indicators moderated in June due to slower growth in new orders, white collar hiring—indicated by Naukri JobSpeak Index—picked up supported by the insurance, fast-moving consumer goods (FMCG) and telecom sectors (Table III.3). 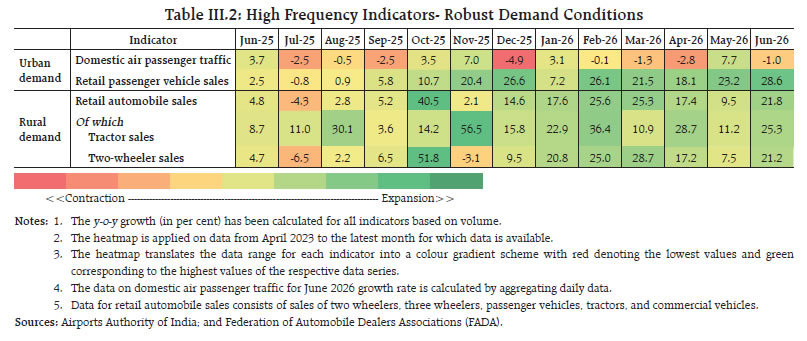 The Viksit Bharat–Guarantee for Rozgar and Ajeevika Mission Gramin (VB-G RAM G), has been implemented since July 01, 2026, replacing Mahatma Gandhi National Rural Employment Guarantee Scheme (MGNREGS). It aims to strengthen rural livelihoods, improve the quality of public assets and introduce technology-driven implementation. VB-G RAM G guarantees 125 days of annual employment, empowers the states to notify an aggregated 60-day pause during the agricultural season, brings artificial intelligence, global positioning system (GPS), and biometric-based monitoring, and shifts the scheme’s focus on Centre-designated areas.8 It has replaced projection-based fund allocation with Centre-determined state-wise normative allocations.9 Government has also revised the national average notified wage from ₹298.8 per day under MGNREGS to ₹327.4 per day under VB–G RAM G and has introduced a minimum national floor wage of ₹300 per day across the country.10 Government Finances The Central Government’s key deficit indicators, viz., gross fiscal deficit (GFD), revenue deficit and the primary deficit showcased different patterns in April-May: 2026-27. While the GFD as per cent of budget estimates (BE) was higher than the corresponding period of the previous financial year11, both the revenue and primary accounts recorded surpluses, albeit lower than the previous year (Chart III.1a). The higher fiscal deficit was driven by expansion in both revenue and capital expenditure, alongside a contraction in non-debt total receipts.12 The growth in revenue expenditure was due to higher spending on major subsidies and interest payments.13 Meanwhile, capital expenditure sustained its double-digit growth, reflecting Government’s sustained focus on public investment. Conversely, non-debt total receipts contracted due to lower non-tax revenue and non-debt capital receipts (Chart III.1b).14 The key deficit indicators of the State Governments as per cent of budget estimates were lower in April-May: 2026-27 as compared to last year primarily due to higher revenue receipts (Chart III.2). Within revenue receipts, state GST collections recorded strong growth, accompanied by increase in state excise duties, stamp duties and registration fees. On the expenditure side, revenue expenditure was higher, while capital expenditure contracted. Trade Merchandise exports recovered in Q1:2026-27 from a contraction in the corresponding quarter of the previous year.15 The imports also grew at double-digit.16 However, the merchandise trade deficit stood higher than the last year in Q1:2026-27, primarily driven by faster rise in the imports of electronic goods, petroleum products and gold.17 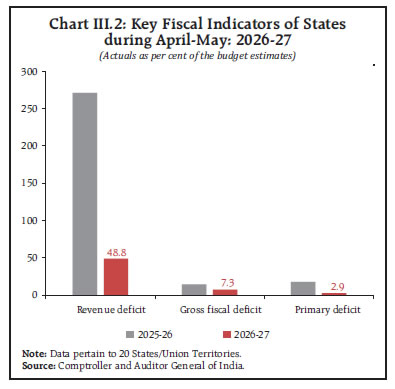 Through June 2026, both exports and imports recorded a strong growth for the third consecutive month.18 Export growth was driven by products like engineering goods; electronic goods; and gems and jewellery.19,20 However, petroleum products exports were the lowest since the onset of the war.21 The growth of imports was led by commodities such as petroleum, crude and related products; electronic goods; and fertilisers.22 There has been a very high growth (triple-digit) in imports from countries such as Oman, Brazil, and Nigeria, reflecting India’s recent initiatives to diversify the source of petroleum, crude and products imports.23 Gold imports, although at a 12-month low, recorded a positive growth in June, while silver imports fell.24 The merchandise trade deficit widened to a five-month high in June 2026, and also increased on a year-on-year (y-o-y) basis (Chart III.3).25 The higher trade deficit was driven by oil and electronic goods, with the deficit on account of electronics goods nearly doubling over the previous year.26 As part of India’s trade diversification efforts, the India-UK Comprehensive Economic and Trade Agreement (CETA) came into effect from July 15, 2026. The agreement grants Indian exporters a near-universal duty-free access to the UK market from day one, while India’s trade liberalisation is gradual and selective, spread over a decade, with agriculture largely protected and automobiles subject to some restrictions. In May 2026, net services exports declined marginally with imports growing at a faster pace than exports (Chart III.4).27 Services exports grew in May 2026 mainly driven by business and transport services, while imports increased at a faster rate through a rise in software, transport, and business services.28 Aggregate Supply Agriculture The cumulative southwest monsoon rainfall (up to July 20) has been below normal with skewed temporal and spatial distribution (Chart III.5.a). As a result, the reservoir storage turned out lower than the decadal average, but, higher than the previous El Niño year of 2023 (Chart III.5.b). During ongoing kharif season, the difference in acreage with that of the previous year is narrowing down (Chart III.5.c).29 The India Meteorological Department (IMD) has forecast below-normal rainfall for July. While monsoon performance remains important for farm sector, the dependency of agriculture on southwest monsoon has been gradually declining due to increasing irrigation coverage and decreasing share of kharif crops—which are relatively more dependent on monsoon than rabi crops—in total foodgrain production (Chart III.6). Furthermore, robust procurement of wheat and rice30, following the record production in 2025-26, has resulted in comfortable public foodgrain stocks31. Monthly Indicators of Industrial Activity Based on high frequency indicators, industrial activity remained robust despite the geopolitical tensions in West Asia. In May, y-o-y growth in the Index of Industrial Production (IIP) edged up on account of strong manufacturing activity and electricity production. In June, the Manufacturing PMI stayed in the expansionary zone, despite some moderation. Automobile production registered robust growth in June as compared to last year, aided by reduced GST rates. Electricity generation also surged as the country experienced prolonged heatwave conditions (Table III.4). Capital goods imports witnessed the highest growth since June 2021, driven by electronic goods. The Index of Core Industries (ICI) [revised series with base year 2022-23 and inclusion of iron ore as 9th industry] accelerated to a 5-month high in June 2026, led by electricity and iron ore. Monthly Indicators of Services Activity Services sector remained resilient in June. While the Services PMI declined over the previous month, it remained firmly in the expansion territory led by new export orders. Domestic logistics operations also showed steady growth as reflected by an improvement in railway freight traffic. In road transport sector, retail commercial vehicle sales registered robust growth bolstered by light and medium segments. On the other hand, international air passenger traffic continued to contract, weighed down by flight disruptions, airspace closures, rerouting, and increased fuel cost, although the pace of decline eased. Steel consumption strengthened in May, reflecting sustained demand from infrastructure and construction sectors. Port cargo traffic growth accelerated in May (Table III.5). 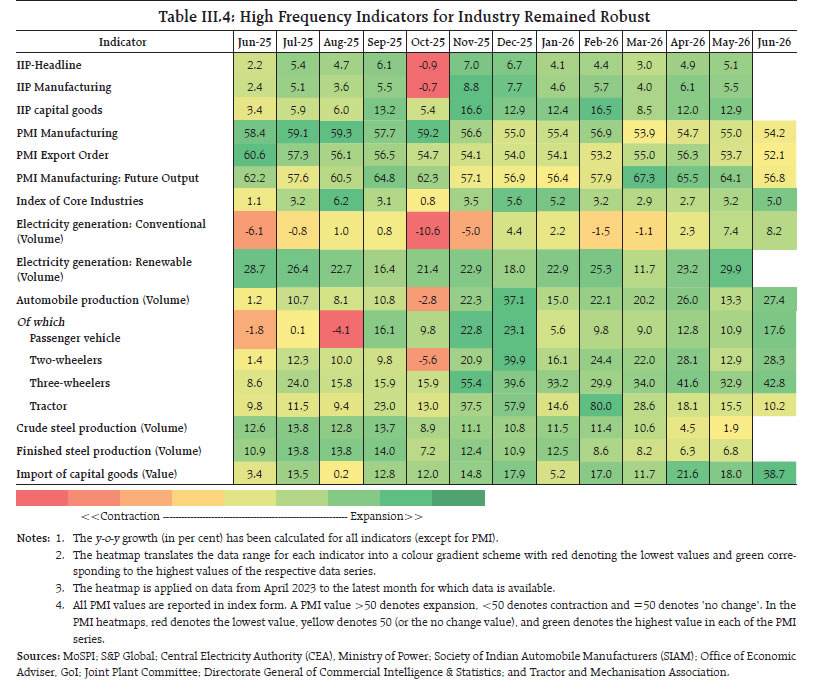
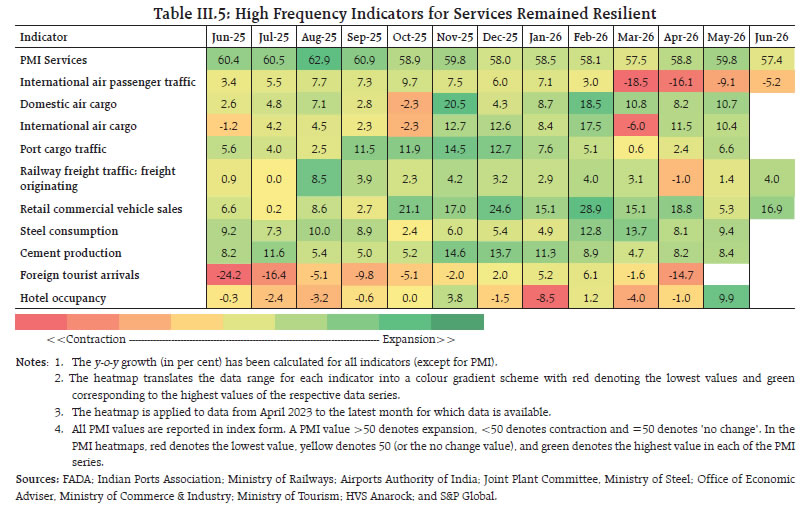 The Ministry of Statistics and Programme Implementation (MoSPI) released the Index of Services Production (ISP) [base year: 2024–25] on July 14, 2026, on a trial basis. It fills an important gap in India’s statistical system by providing a monthly measure32 of formal services sector activity, complementing the Index of Industrial Production (IIP). It is compiled using GST data and sector-specific administrative records. ISP covers 19 service sub-sectors, accounting for around 60 per cent of the services sector.33 In April 2026, 14 of the 19 sectors registered double-digit growth led by accommodation & food, and retail trade (Chart III.7). Inflation The headline Consumer Price Index (CPI) inflation34 crossed the target for the first time since January 2025, increasing to an 18-month high of 4.4 per cent in June 2026 from 3.9 per cent in May. The pick-up in inflation was driven by ‘food and beverages’ and ‘fuel’ components while core inflation stood unchanged (Chart III.8).35 Eight out of 12 divisions36 witnessed a sequential increase in inflation in June (Chart III.9). The increase in ‘food and beverages’ inflation remained broad-based driven by meat, edible oils, fruits and spices.37 On a month-on-month (m-o-m) basis also all the sub-components of ‘food and beverages’ in the CPI basket edged up in June. Fuel inflation spiked in June,38 driven by increase in retail prices of petrol, diesel and liquified petroleum gas (LPG).39 Core inflation remained stable at 3.9 per cent (y-o-y) in June 2026, amidst decline in ‘personal care, social protection and miscellaneous goods and services’; partially offset by rise in ‘restaurant and accommodation services’. Precious metal prices fell on a m-o-m basis but continued to witness elevated y-o-y inflation. Excluding precious metals, core inflation, remained muted at 2.5 per cent in June, indicating that the underlying price pressures continued to remain broadly contained.
The inflation edged up both in urban and rural areas40 and most of the states/UTs recorded inflation in the range of 2-6 per cent (Chart III.10).41 The sequential increases in key food items appeared to be broad based in July so far (up to July 20). Within foodgrains, prices of key staples (rice and wheat) recorded an uptick, while pace of increase in pulses prices moderated sequentially, with moong dal recording a marginal decline m-o-m. Edible oil prices continued to show a broad-based increase amidst use of edible oils for biofuel production42. Within perishables, prices of major vegetables, viz., potato, onion and tomato increased further in July with the largest spike recorded in onion (Chart III.11).
Retail prices of petrol and diesel remained unchanged in July. Domestic household LPG prices also remained steady in July43 (Table III.6). The price of the Indian basket crude oil44 eased to US$ 75.6 per barrel in July (up to 20) from the peak of US$ 114.5 in April45 (Chart III.12). | Table III.6: Steady Petroleum Products Prices | | Item | Unit | Domestic Prices | Month-over-month (per cent) | | Jul-25 | Jun-26 | July-26^ | Jun-26 | July-26^ | | Petrol | ₹/litre | 101.1 | 108.7 | 108.7 | 4.4 | 0.0 | | Diesel | ₹/litre | 90.5 | 98.1 | 98.1 | 5.0 | 0.0 | | Kerosene (subsidised) | ₹/litre | 43.0 | 46.8 | 46.8 | 0.0 | 0.0 | | LPG (non-subsidised) | ₹/cylinder | 863.3 | 946.5 | 952.3 | 2.5 | 0.6 | ^: For the period July 01-20, 2026.
Note: Other than kerosene, prices represent the average Indian Oil Corporation Limited (IOCL) prices in four major metros (Delhi, Kolkata, Mumbai and Chennai). For kerosene, prices denote the average of the subsidised prices in Kolkata, Mumbai and Chennai.
Sources: IOCL; Petroleum Planning and Analysis Cell (PPAC); and RBI staff calculations. | WPI inflation rose to 9.9 per cent in June 2026 from 9.7 per cent in May 2026 (see Annex Box 1). The inflation in fuel and power group remained elevated at 27.4 per cent in June 2026. Inflation in primary articles firmed up to 7.0 per cent in June 2026 from 5.0 per cent in May 2026. The input price pressures, as reflected in the industrial cost inflation remained elevated, while that of farm inputs recorded a rise.46 Output producer price index (OPPI) exhibited sequential increase in inflation to 9.6 per cent (y-o-y) in June from 9.4 per cent in the previous month, primarily driven by ‘agriculture, forestry & fishing’. The PMI for input prices for manufacturing firms recorded a sequential easing, while remaining in the expansionary phase. The PMI for output prices for manufacturing firms also moderated, albeit at a slower pace, narrowing the wedge between expansion of input and output prices. In the services sector also, the PMIs for both output and input prices moderated sequentially, though remained in the expansionary zone (Chart III.13). IV. Financial Conditions From a mild surplus in June, system liquidity47 improved during first half of July.48 After remaining comfortable during the first half of June, liquidity surplus moderated and briefly slipped into deficit amidst advance tax and GST-related outflows in the second half of the month. Liquidity conditions, on average, improved in first half of July as pressures from tax outflows waned amidst faster government spending before tightening in the second half of July (up to July 20). To address the transient liquidity shortage during June-July, the Reserve Bank conducted 23 variable-rate repo (VRR) auctions.49 Banks continued to park large surplus funds under the standing deposit facility, while the usage of the marginal standing facility remained stable (Chart IV.1).50 Money Market The weighted average call rate (WACR) hovered in the upper half of the policy corridor during June and July. As liquidity conditions improved in July, it traded close to the policy rate (Chart IV.2a).51 Rates in the collateralised overnight segment moved in tandem with the WACR. The yields on treasury bills, commercial papers (CPs) and certificates of deposit (CDs) softened in early July over June (Chart IV.2b).52 However, following the breakdown of ceasefire in West Asia on July 08, the money market rates hardened. The CD rates witnessed a sharp uptick in the second week of July amidst moderation in surplus liquidity and persistent funding pressures with credit growth outpacing deposit growth. The average spread between the yield on 3-month CP and 91-day treasury bill narrowed.53 Government Securities (G-Sec) Market Dated G-sec yields eased across maturities during June and early July with easing of tensions in the West Asia and due to measures undertaken by the Government and the Reserve Bank to attract foreign capital into Indian debt markets. Yields, however, hardened marginally following the resurgence of West Asia conflict (Chart IV.3).54
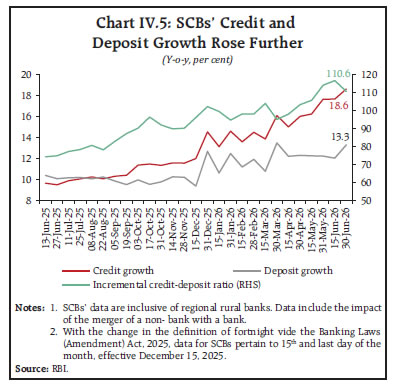
The Union Government reviewed the interest rates on various small savings instruments, which are linked to secondary market yields on G-secs of comparable maturities and kept them unchanged for Q2:2026-27.55 The prevailing rates on these instruments exceed their formula-based rates, except for the Public Provident Fund (PPF). Corporate Bond Market New corporate bond issuances increased in May as compared to April. On a cumulative basis, the total issuances remained lower in the current financial year.56 Average corporate bond yields eased across tenors and the rating spectrum in July (up to July 20), tracking moderation in the Government bond yields (Table IV.1). Money and Credit The reserve money (adjusted for cash reserve ratio) continued to grow in June 2026, with currency in circulation sustaining a double-digit growth since December 2025.57 The money supply growth also edged up in June 2026 (Chart IV.4).58 Scheduled commercial banks’ (SCBs’) credit and deposit growth rose in June, with the former outpacing the latter consistently since September 2025. However, the incremental credit-deposit ratio moderated (Chart IV.5).59 During 2026-27 (up to June 30), the total flow of financial resources to the commercial sector rose significantly as compared to the previous year, backed by non-food bank credit and foreign direct investment (FDI)60 [Table IV.2a and b]. | Table IV.1: Average Corporate Bonds Yields Softened in July | | Instrument | Interest Rates
(Per cent) | Spread
(Basis points) | | June 2026 | July 2026
(up to July 20) | Variation | June 2026 | July 2026
(up to July 20) | Variation | | 1 | 2 | 3 | (4 = 3-2) | 5 | 6 | (7 = 6-5) | | (i) AAA (1-year) | 7.61 | 7.39 | -22 | 173 | 168 | -5 | | (ii) AAA (3-year) | 7.54 | 7.42 | -12 | 114 | 110 | -4 | | (iii) AAA (5-year) | 7.65 | 7.49 | -16 | 93 | 93 | 0 | | (iv) AA (3-year) | 8.34 | 8.21 | -13 | 194 | 189 | -5 | | (v) BBB minus (3-year) | 11.95 | 11.80 | -15 | 555 | 548 | -7 | Note: Yields and spreads are computed as averages for respective periods.
Source: Fixed Income Money Market and Derivatives Association of India. |
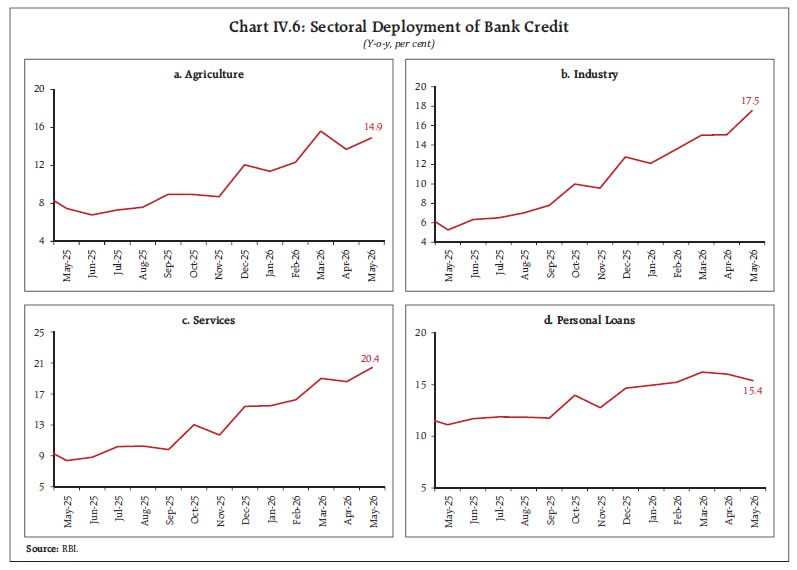
 Bank credit continued to record robust growth across major sectors in May 2026.61 Credit to the agricultural sector picked up, and the industrial credit growth sustained its momentum with expansion in credit to large industries. Credit flow to the services sector also strengthened, driven by the bank lending to non-banking financial companies (NBFCs). Personal loans decelerated in segments like housing, vehicle and gold vis-à-vis April 2026 (Chart IV.6). | Table IV.2a: Flow of Financial Resources to Commercial Sector Increased | | (₹ lakh crore) | | Source | April-March | Up to June 30 | | 2024-25 | 2025-26 | 2025-26 | 2026-27 P | | A. Non-Food Bank Credit | 18.08 | 29.19 | 0.50 | 5.05 | | B. Non-Bank Sources (B1+B2) | 18.15 | 17.69 | 2.62 | 2.68 | | B1. Domestic Sources | 14.91 | 12.66 | 1.69 | 0.96 | | B2. Foreign Sources | 3.25 | 5.03 | 0.94 | 1.72 | | C. Total Flow of Resources (A+B) | 36.23 | 46.88 | 3.12 | 7.73 | P: Provisional.
Notes: 1. Figures in the columns may not add up to the total due to rounding off of numbers.
2. For detailed notes and data, please refer to Current Statistics Table No: 18(a).
Sources: RBI; SEBI (Securities and Exchange Board of India); AIFIs (All India Financial Institutions); and RBI staff calculations. | Credit from NBFCs registered double-digit growth (y-o-y) across major sectors (except industry) in May 2026.62 While agricultural credit growth expanded at a robust pace, industrial credit growth moderated led by deceleration in credit to infrastructure, the largest segment within industry. Growth in credit to services sector decelerated largely due to trade and transport operator segments, even as credit to commercial real estate segment accelerated. Retail loans gathered pace, propelled by robust growth in loans against gold jewellery and housing63, while vehicle loans growth eased marginally (Chart IV.7). | Table IV.2b: Higher Outstanding Credit to Commercial Sector | | (₹ lakh crore; Figures in parentheses are y-o-y changes in per cent) | | Source | At End-March | As on June 30 | | 2025 | 2026 | 2025 | 2026 P | | A. Non-Food Bank Credit | 183.72 | 212.91 | 184.22 | 217.96 | | | (10.9) | (15.9) | (9.3) | (18.3) | | B. Non-Bank Sources (B1+B2) | 88.86 | 101.59 | 90.28 | 102.94 | | | (14.6) | (14.3) | (15.5) | (14.0) | | B1. Domestic Sources | 66.37 | 75.11 | 67.55 | 75.84 | | | (17.3) | (13.2) | (18.3) | (12.3) | | B2. Foreign Sources | 22.49 | 26.48 | 22.73 | 27.09 | | | (7.2) | (17.7) | (8.0) | (19.2) | | C. Total Credit (A+B) | 272.58 | 314.50 | 274.50 | 320.90 | | | (12.1) | (15.4) | (11.3) | (16.9) | P: Provisional.
Notes: 1. Figures in the columns may not add up to the total due to rounding off of numbers.
2. Data on non-bank sources excludes issuances of equities and hybrid instruments under domestic sources and foreign direct investment in equities under foreign sources.
3. Flows based on outstanding data may not tally with the flows provided in Table IV.2a due to:
(a) Conversion of some Housing Finance Companies into Non-Banking Financial Companies; and
(b) Valuation effect in case of foreign sources.
4. For detailed notes and data, please refer to Current Statistics Table No: 18(b).
Sources: RBI; SEBI; AIFIs; and RBI staff calculations. |
 Deposit and Lending Rates During the current easing cycle (February 2025– May 2026), SCBs have lowered both repo-linked external benchmark-based lending rates (EBLR) and marginal cost of funds-based lending rates (Table IV.3). Pass-through to fresh lending rates was strong in the infrastructure sector and EBLR-mandated sectors (Chart IV.8).64 Among domestic banks, private sector banks exhibited stronger pass-through to lending rates relative to public sector banks. The pass-through for both deposit and lending rates has been higher for foreign banks (Chart IV.9). 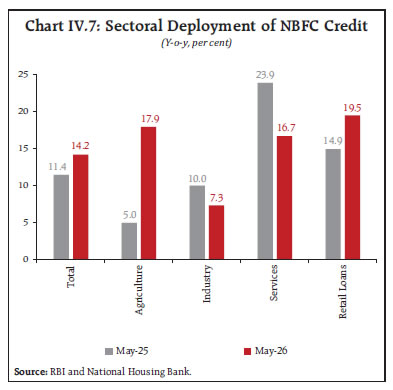
Table IV.3: Transmission to Banks’ Deposit and Lending Rates
(Basis points) | | Period | Repo Rate | Term Deposit Rates | Lending Rates | | WADTDR-Fresh Deposits | WADTDR-Outstanding Deposits | EBLR | 1-Year MCLR (Median) | WALR - Fresh Rupee Loans | WALR-Outstanding Rupee Loans | | Overall | Interest Rate Effect# | | (1) | (2) | (3) | (4) | (5) | (6) | (7) | (8) | (9) | Tightening Cycle
May 2022 to Jan 2025 | 250 | 259 | 206 | 250 | 175 | 182 | 191 | 115 | Easing Cycle
Feb 2025 to May 2026 | -125 | -78 | -52 | -125 | -35 | -82 | -85 | -90 | #: Calculated at January 2025 weights.
WALR: Weighted average lending rate; WADTDR: Weighted average domestic term deposit rate;
MCLR: Marginal cost of funds-based lending rate; EBLR: External benchmark-based lending rate.
Note: Data on EBLR pertain to 32 domestic banks.
Source: RBI. | Equity Markets Indian equity markets gained in June and early July, reflecting the improved sentiment following the US-Iran ceasefire agreement, easing crude oil prices and a rebound in net buying by foreign portfolio investors (FPI) (since mid-June) [Chart IV.10]. With the announcement of the cessation of the ceasefire in West Asia on July 08, the equity markets witnessed a correction amidst soaring crude oil prices.65 Thereafter, markets have remained range bound.
External Sources of Finance During April-May 2026, FDI remained higher in both gross and net terms, supported by lower repatriation (Chart IV.11a).66 Japan, Singapore, and Mauritius accounted for around 74 per cent of the total equity inflows. Financial services received the highest share of equity inflows, followed by manufacturing, retail and wholesale trade, and computer services; these sectors together accounted for around 80 per cent of total inflows. Of the outward FDI, around 74 per cent of the flows were directed towards the US, Cayman Islands, and the Netherlands; the major sectors included financial, insurance & business services, and manufacturing, accounting for more than 85 per cent of the outward flows during April-May 2026 (Chart IV.11b).
Foreign portfolio investments saw net inflows in June 2026, driven by policy support for the debt segment and easing of geopolitical tensions.67 In July (up to July 20), FPIs infused US$ 3.1 billion with inflows across the equity and debt segments (Chart IV.12). External commercial borrowing (ECB) registrations rose significantly during April-May 2026 over the previous year.68 After adjusting for principal repayments, net ECB inflows were lower. However, net ECB inflows recorded sequential expansion in May 2026 (Chart IV.13).69 Around 37 per cent of the ECBs were mobilised for capital expenditure.
Net inflows under non-resident deposits (NRD) moderated during Apr-May 2026 than the corresponding period previous year, driven by a slowdown in non-resident external rupee account [NR(E)RA] and foreign currency non-Resident bank [FCNR(B)] accounts. With the recent policy measures on NRD, overseas foreign currency borrowings (OFCBs) and ECB inflows by the RBI, including a concessional swap facility for fresh FCNR(B) deposits on June 5, 2026, there was a surge in FCNR(B) deposit inflows amounting to US$ 17.4 billion from June 8 to July 17, 2026.70 The key external sector vulnerability indicators, viz., external debt-to-GDP ratio, net international investment position (NIIP) to GDP ratio, debt service ratio and short-term debt (residual maturity) to reserves remained contained at end-March 2026 (Chart IV.14). India’s external debt was placed at US$ 762.8 billion at end-March 2026.71
India’s foreign exchange reserves remain comfortable, providing cover for more than 10 months72 of goods imports and around 88.5 per cent73 of the external debt outstanding as at end-March 2026 (Chart IV.15). India’s NIIP improved during Q4:2025-26, driven by a decline in India’s external liabilities and an increase in external assets (Chart IV.16).74 The fall in external liabilities reflects the decline in portfolio and direct investment in India and the impact of depreciation of the Indian rupee (INR) against major currencies during the quarter.75 Foreign Exchange Market The INR strengthened in June owing to lower international crude oil prices and improving foreign inflows due to measures taken by the Government and the Reserve Bank. The gains were reversed in July (up to 20) in line with other major EMEs in the context of strengthening of US dollar (Chart IV.17). In real effective terms, INR appreciated in June vis-à-vis its major trading partners, driven by appreciation of INR in nominal effective terms and higher domestic inflation (Chart IV.18). V. Conclusion The global economy is dealing with uncertain economic environment, supply chain disruptions, and fragmented trading relationships. Amidst these uncertainties, India remains among the fastest growing major economies across the globe76 and has been able to sustain the momentum in economic activities through June. Both industrial and services sector indicators remained firm. The farm sector is witnessing uneven southwest monsoon, but the impact on food inflation may be mitigated by comfortable foodgrain stocks. The momentum of external trade sustained as reflected in high growth in exports and imports in Q1:2026- 27. This is likely to be strengthened by the recent operationalisation of the India-UK Comprehensive Economic and Trade Agreement and progress in other bilateral trade agreements. External vulnerability indicators also remained sound. Recovery of foreign investments in recent months shows a revival of confidence in the economy.
Annex Box 1: Revision of WPI Base Year from 2011-12 to 2022-23 The base year for Wholesale Price Index has been revised to 2022-23 from 2011-12 by the Ministry of Commerce and Industry. On June 15, 2026, the new series with provisional data for the month of May 2026 alongside the back series from April 2023 to April 2026 was released. With this change, the base year 2022-23 for WPI is made consistent with that of the revised series of Gross Domestic Product (GDP) and Index of Industrial Production (IIP). The number of items in the revised WPI has increased to 957 from 697 in the earlier base, with the weights of the major groups remaining broadly similar (Table 1). | Table 1: WPI – Items and Weights | | Group/ Category | WPI (2011-12) | WPI (2022-23) | | Items | Weight | Items | Weight | | Primary Articles | 115 | 22.62 | 129 | 22.76 | | Fuel and Power | 18 | 13.15 | 25 | 14.11 | | Manufactured Items | 564 | 64.23 | 803 | 63.13 | | Total | 697 | 100 | 957 | 100 | A comparison of the WPI with the revised base vis-à-vis the earlier one is presented in Table 2. Following the global best practices, there would be a gradual transition from WPI to the Producer Price Index (PPI). The data release for Output PPI, Input PPI (trial basis) and Service Producers’ Price Index has also commenced since June 2026. | Table 2: Comparison of Revised WPI Series and Earlier Base Series | | Parameter | WPI (Base 2011-12) | WPI (Base 2022-23) | | Derivation of Weights | Based on Net Traded Value (NTV) i.e., Gross Value of Output (GVO) + Imports – Exports, approach. | Based on globally accepted and more accurate GVO approach, which reflects economic significance from the domestic producer's perspective77. | | Elementary Index Computation | Long-term formulation method, comparing the current prices directly against the fixed base period prices. | Short-term formulation using the chain-based Jevons method, comparing the current month's prices to the previous month's prices. | | Missing Price Treatment | Relied on the outdated 'carry-forward' method, repeating the last available price. | Utilises the 'Targeted Mean Imputation' method, imputing the missing price based on the geometric mean of price changes of similar available specifications. | | Crude Oil & Gas Classification | Classified under the 'Primary Articles' group. | Shifted to the 'Fuel & Power' group to consolidate and integrate the tracking of the primary energy sector. | | Electricity Coverage and Structure | Tracked conventional electricity sources as a single consolidated item in the basket. | Divided into five distinct electricity generation sources: hydro, thermal, nuclear, solar, and wind. | | Coal Pricing Mechanism | Relied solely on notified prices for tracking coal inflation. | Incorporates both auction prices (via exchanges) and notified prices for coking and non-coking coal. | | Treatment of Captive Mines | Ex-mine prices from captive mines were included. | Excludes prices from captive mines (since their output is for internal consumption, not open market sale), except for copper, lead, and zinc due to non-availability of data. | Source: Office of the Economic Adviser, Ministry of Commerce and Industry. |
|