|
This paper analyses India’s performance in international trade
in goods with a few important economies in South and East Asia, viz.,
China, Hong Kong SAR (China), Taiwan (China), Indonesia, Republic of Korea,
Malaysia, Philippines, Singapore and Thailand based on certain trade indicators
during the years 1980, 1990, 2000, 2001, 2002 and 2003. It is observed that
performance by India in merchandise trade did not compare well with these economies.
However, the study reveals that India managed a less concentrated trade structure
in products exported than many of the economies under study except the USA,
China, Hong Kong SAR (China) and Indonesia. On the other hand, a more concentrated
trade structure signified India’s imports trade. Also, merchandise trade by
India is found below expected levels with many Asian economies under study.
JEL Classification : Classification: F10, F14, F19
Keywords : International Trade, Trade indicator
Introduction
One main objective of the Foreign Trade Policy (2004-09) announced
by the Government of India is to double the country’s percentage share of global
merchandise trade within the next five years. In 2003, India accounted for around
0.75 per cent of world exports and 0.93 per cent of world imports. In 1980 these
shares were 0.42 per cent in case of exports and 0.72 per cent in case of imports.
During the same period a few economies in South and East Asia, viz.,
China, Hong Kong SAR (China), Taiwan (China), Republic
* Assistant Adviser, Balance of Payments Statistics Division
(BPSD), Department of Statistical Analysis & Computer Services (DESACS),
Reserve Bank of India. The views expressed in this article are personal and
not necessarily represent the views of the institution to which the author belongs.
of Korea, Malaysia, Philippines, Singapore and Thailand almost
doubled or more than doubled their exports. The four Newly-Industrializing Countries
(NICs) of East Asia [Hong Kong SAR (China), Singapore, Republic of Korea and
Taiwan (China)] together with the Asean-4 (Indonesia, Malaysia, Philippines
and Thailand) and China accounted for almost 80 per cent of the increase in
the value of manufactures exported by all developing countries from 1980 to
1990 (Maizels). Except Hong Kong SAR (China) and Philippines all the other South
and East Asian economies mentioned above had continuous trade surplus in all
the years from 2000 to 2003. Strong economic performance in East Asia was driven,
to a considerable extent, by robust export growth. Percentage share of exports
to GDP of each of the economies mentioned above rose above thirty per cent in
2003 against a world average of around 21 per cent and around 10 per cent for
India.
A question of considerable interest is how does global trade
in goods by India compares with the emerging economies in South and East Asia
mentioned above. A comparative analysis in that direction is presented in this
paper. The analysis has been done based on certain important trade indicators
as discussed in Section I. Section II describes the data used while Section
III presents the results of the analysis. Section IV concludes.
Section I
Methodology Used
The analysis in this paper has been done based on certain important
trade indicators viz., share in world trade, growth, trade balance, percentage
share to GDP, market concentration indices on commodities traded, country-wise
distribution of exports and imports, terms of trade indices [viz. ‘net barter
terms of trade’ (NBTT) and the income terms of trade’ (ITT)] and trade intensity
indices. Indicators on share in world trade, growth, trade balance, and share
to GDP are quite straightforward in concept. However, a discussion may be helpful
on indices on ‘market concentration’, ‘terms of trade’ and ‘trade intensity’
and this is presented below.
Market Concentration Index on Products Traded
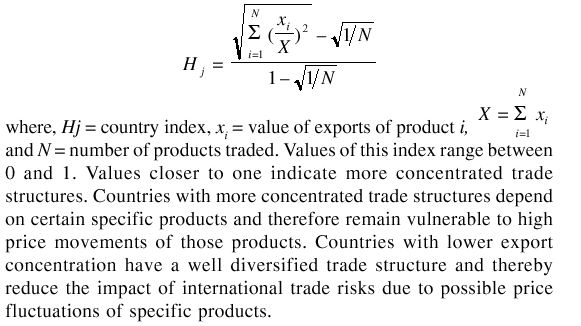
Market concentration index measures the degree to which a country’s
exports is dispersed over various products and is called index of market concentration
or Herfindahl-Hirschman index. The index reveals the degree of market concentration
and is computed according to the following formula:
Terms of Trade: Definition and Concept
Terms of trade of a country refers to two concepts viz. the ‘net barter
terms of trade (NBTT)’ and the ‘income terms of trade (ITT)’. When the phrase
‘terms of trade’ is used without qualification it refers to the NBTT concept.
The terms of trade measures the relative change in export and import prices.
It is defined as percentage ratio of the export unit value index to the import
unit value index. Changes in the relative prices of exports and imports are
important factors in influencing the values of exports and imports and the balance
of payments of a country. A rising terms of trade results if import prices are
rising slower than export prices. Conversely, if import prices are rising faster
than export prices, it results in a fall in the terms of trade. Increase in
the terms of trade index number is an encouraging movement, as a unit of exports
will buy more imports. For the same reason, decline in the terms of trade index
is described as an adverse movement in trade (a unit of exports will buy fewer
imports).
One limitation of NBTT is that it does not take into account
the influence of changes in trade volumes. Due to this fact, the NBTT can not
completely indicate the impact of changing market conditions on the trade balance
of a country. This limitation is overcome by the second concept viz.
‘the income terms of trade’ (ITT). ITT is defined as the NBTT multiplied by
export volume. An alternative interpretation is that the ITT measures the purchasing
power of exports in terms of importable goods and services.
Change in a country’s terms of trade directly affects the balance
of payments position of the country. Any adverse change will worsen a country’s
trade balance. In order to restore balance it will need to export more and/or
import less. Substantial cut in imports may seriously hamper the economic growth
of many developing countries as they depend heavily on imported capital equipment.
On the other hand, a rise in a country’s NBTT, or in its ITT, would allow it
to expand imports, including imports of capital equipment, and thus help the
country for a continuous or accelerated economic growth.
Trade Intensity Index
The trade intensity index (TII) is used to determine whether
the value of trade between two countries is greater or smaller than would be
expected on the basis of their importance in world trade. It is defined as the
share of one country’s exports going to a partner divided by the share of world
exports going to the same partner. It is calculated as:

where xij is the value of country i’s exports to country j, xwj is the value
of world exports to country j, Xit is country i’s total exports and Xwt is total
world exports. In this formula, xwj and Xwt will also include xij and Xit. The
formula given at (1) above may be slightly modified using Rest of the World’s
(RoW) exports instead of world exports as shown below (RoW is defined as World
excluding the country ‘i’):

where x wj = Rest of the World’ s exports to country j = xwj- xij and
X wt = Rest of the World’ s exports = Xwt - Xit
We define T ij as modified TII. For countries with insignificant
share in world exports, values of Tij and T ij will remain almost same.
The difference may be significant for countries with a significant share in
world exports.
Value of the index (Tij or Tij) will be one for an expected bilateral
trade flow. Share of one country’s exports to its partner should be at least
equal to the share of world exports to the same partner for an expected bilateral
trade flow. Otherwise, it means that the country fails to exploit the market
in its partner country and there is scope for expansion of its exports trade
in the partner country. An index of more (less) than one indicates a bilateral
trade flow that is larger (smaller) than expected, given the partner country’s
importance in world trade.
Section II
Sources and Nature of Data
The analysis has been done based on the trade data published
in the United Nations Conference on Trade and Development (UNCTAD) Handbook
of Statistics (2004) and IMF’s Direction of Trade Statistics (DTS) (1997 and
2004). In both the publications, exports data are published as per free on board
(f.o.b.) value while imports data are published as per ‘cost, insurance and
freight’ (c.i.f.) value. Most of the data are published country-wise as well
as various group wise. Data are available at the highest aggregate level
i.e., the world as a whole. In the Handbook (2004), data are also presented
in three broad groups viz. ‘Developed economies’, ‘South East Europe
(SEA) and Commonwealth of Independent States (CIS)’ and ‘Developing economies’.
These three groups are mutually exclusive and combined together present the
world total. India, China and all the East Asian economies mentioned earlier
are in the third group viz. ‘Developing economies’. Needless to mention that
the USA and Japan are in the first group viz. ‘Developed economies’.
Erstwhile USSR is in the second group viz. ‘SEA & CIS’.
Section III
Analysis Based on the Indicators
This section presents the factual analysis based on the values
of the indicators discussed above. Although the focus of this analysis is on
the trade performance of India vis-à-vis the South and East Asian
economies mentioned above, values of the indicators are also presented for the
USA and Japan, the two most important trade partners of the economies under
study. Analysis is also presented for the three groups viz. ‘Developed
economies’, ‘South East Europe (SEA) and Commonwealth of Independent States
(CIS)’ and ‘Developing economies’ mentioned above wherever relevant. Values
of indicators pertaining to growth, market concentration, distribution and terms
of trade were readily available in the UNCTAD Handbook (2004). Indicators pertaining
to share in world trade, percentage share to GDP and trade intensity indices
were compiled using trade data available in the Handbook (2004), IMF’s DTS(2004,
1997) and the UNCTAD website (www.unctad.org). Data used for compilation were
all in US dollar.
Share in World Exports
Table 1 presents the share in world trade by the economies
under study. Share of Developed Economies in exports came down noticeably after
1990 and remained around 65 per cent during the years 2000 to 2003. Share of
the South-East Europe & CIS economies too declined from 5.27 per cent in
1980 to around 2.68 per cent in 2000. The same, however, increased marginally
in the subsequent years and remained around three per cent. During the period
after 1990, Developing Economies have been able to exhibit a significant improvement
in their exports. Share of these economies in world exports increased from 24.21
per cent in 1990 to around 32 per cent in 2000 and remained almost same in the
subsequent three years. The noticeable improvement in the share of Developing
Economies can be mainly attributed to the striking performance of the economies
in the South and East Asia viz. China, Hong Kong SAR (China), Taiwan
(China), Republic of Korea, Malaysia, Singapore and Thailand. Share of China
in world exports increased from 1.78 per
Table 1: Percentage Share in World Exports
| |
1980
|
1990
|
2000
|
2001
|
2002
|
2003
|
|
Developed Economies
|
65.31
|
72.08
|
65.34
|
66.03
|
65.29
|
64.53
|
|
Developing Economies
|
29.43
|
24.21
|
31.97
|
31.18
|
31.87
|
32.39
|
|
South-East Europe and CIS
|
5.27
|
3.70
|
2.68
|
2.79
|
2.84
|
3.08
|
|
USA
|
11.10
|
11.27
|
12.27
|
11.94
|
10.85
|
9.72
|
|
Japan
|
6.42
|
8.24
|
7.53
|
6.59
|
6.51
|
6.34
|
|
China
|
0.89
|
1.78
|
3.92
|
4.35
|
5.09
|
5.88
|
|
Hong Kong SAR (China)
|
0.97
|
2.35
|
3.17
|
3.10
|
3.13
|
3.01
|
|
Taiwan (China)
|
0.97
|
1.92
|
2.32
|
2.00
|
2.04
|
1.94
|
|
India
|
0.42
|
0.51
|
0.67
|
0.71
|
0.77
|
0.75
|
|
Indonesia
|
1.08
|
0.74
|
0.98
|
0.92
|
0.91
|
0.84
|
|
Republic of Korea
|
0.86
|
1.86
|
2.71
|
2.46
|
2.54
|
2.60
|
|
Malaysia
|
0.64
|
0.84
|
1.54
|
1.44
|
1.46
|
1.33
|
|
Philippines
|
0.28
|
0.23
|
0.63
|
0.53
|
0.57
|
0.49
|
|
Singapore
|
0.95
|
1.51
|
2.17
|
1.99
|
1.96
|
1.95
|
|
Thailand
|
0.32
|
0.66
|
1.09
|
1.06
|
1.08
|
1.08
|
| |
|
|
|
|
|
|
|
Source : Author’s
calculation based on UNCTAD Handbook (2004) data.
|
cent in 1990 to 5.88 per cent in 2003 (Chart 1). During the
same period, the share of the USA and Japan declined from 11.27 per cent and
8.24 per cent, respectively, in 1990 to 9.72 per cent and 6.34 per
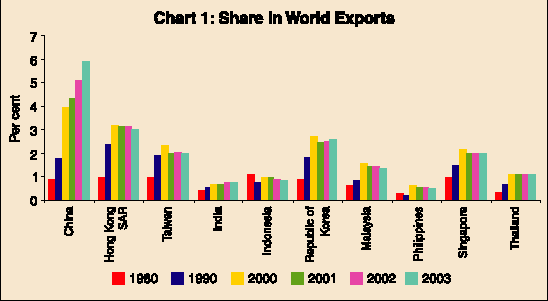
cent, respectively, in 2003. During this period, share of India
in world exports increased from around 0.51 per cent in 1990 to 0.75 per cent
in 2003, substantially lower than many of its South and East Asian neighbours
under study.
Share in World Imports
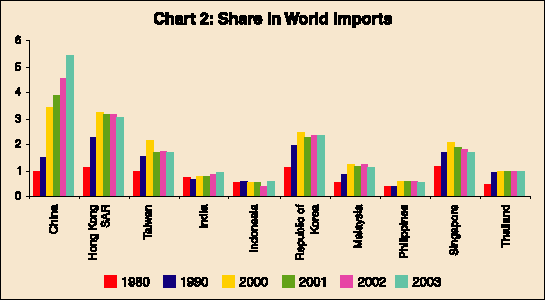
Share in world imports by Developing Economies also followed
similar trends to that of exports during the period 1980 to 2003 (Table 2 and
Chart 2). After 1990 share of these economies significantly went up, mostly
because of the South and East Asian region. China increased its share in world
imports from 1.48 per cent in 1990 to 5.42 per cent in 2003. Share of India
in world imports increased from 0.65 per cent in 1990 to only 0.93 per cent
in 2003. As in case of exports, share in world imports by India did not rise
much during the period under study. The share was found to be lower than all
the economies under study except for Indonesia and Philippines. During the same
period, the share
Table 2: Percentage Share in World Imports
| |
1980 |
1990 |
2000 |
2001 |
2002 |
2003 |
|
Developed Economies |
70.93 |
73.05 |
69.21 |
69.26 |
68.77 |
68.18 |
|
Developing Economies |
23.90 |
22.53 |
28.99 |
28.59 |
28.93 |
29.28 |
|
South-East Europe and CIS |
5.17 |
4.42 |
1.80 |
2.15 |
2.30 |
2.54 |
|
USA |
12.40 |
14.31 |
19.21 |
18.69 |
18.40 |
17.14 |
|
Japan |
6.82 |
6.51 |
5.79 |
5.53 |
5.16 |
5.03 |
|
China |
0.96 |
1.48 |
3.43 |
3.86 |
4.52 |
5.42 |
|
Hong Kong SAR (China) |
1.08 |
2.28 |
3.25 |
3.19 |
3.18 |
3.05 |
|
Taiwan (China) |
0.95 |
1.52 |
2.13 |
1.70 |
1.73 |
1.67 |
|
India |
0.72 |
0.65 |
0.79 |
0.80 |
0.86 |
0.93 |
|
Indonesia |
0.52 |
0.60 |
0.51 |
0.49 |
0.39 |
0.55 |
|
Republic of Korea |
1.08 |
1.93 |
2.45 |
2.24 |
2.33 |
2.35 |
|
Malaysia |
0.52 |
0.81 |
1.25 |
1.17 |
1.22 |
1.08 |
|
Philippines |
0.40 |
0.36 |
0.56 |
0.55 |
0.57 |
0.52 |
|
Singapore |
1.16 |
1.68 |
2.05 |
1.84 |
1.78 |
1.68 |
|
Thailand |
0.44 |
0.91 |
0.94 |
0.98 |
0.99 |
1.00 |
| |
|
|
|
|
|
|
|
Source : Author’s calculation based on UNCTAD Handbook (2004) data. |
of the USA increased from 14.31 per cent to 17.14 per cent.
However, share of Japan in world imports declined from 6.51 per cent in 1990
to 5.03 per cent in 2003. Share of South-East Europe and CIS economies in world
imports trade also declined significantly after 1980 (from 5.17 per cent in
1980 to around 1.80 per cent in 2000) but made a turnaround in 2001.
One important observation regarding share in world trade by
developed economies vis-à-vis developing economies is that the share
of imports by the former, especially the USA, in world imports is found to be
higher in the years under study than the same observed in case of exports (and
the opposite is the observation for the other group).
Growth in Exports
Exports by the Developing Economies experienced rapid growth
than that by the Developed Economies after 1990 except for the year 2000-01
(Table 3). During that year, there was a decline in exports by Developed as
well as Developing Economies. The world trade in exports had a negative growth
of around four per cent in that year. China and India were among the few countries
that showed positive, although lower, growth in that year. Annual average growth
rate of exports from India during the period under study stood above world average
except during the year 2002-03. The growth was also higher than many economies
under study after 1990.
Table 3 : Annual Average Growth in Exports
| |
|
|
|
|
(Per cent) |
| |
|
|
|
|
|
|
Year |
1980-90 |
1990-2000 |
2000-01 |
2001-02 |
2002-03 |
| |
|
|
|
|
|
|
World |
6.0 |
6.6 |
-3.8 |
4.5 |
16.4 |
| |
|
|
|
|
|
|
Developed Economies |
7.3 |
5.7 |
-2.8 |
3.3 |
15 |
| |
|
|
|
|
|
|
Developing Economies |
3.2 |
9.0 |
-6.2 |
6.8 |
18.3 |
| |
|
|
|
|
|
|
South-East Europe and CIS |
2.9 |
6.7 |
0.2 |
6.4 |
26.2 |
| |
|
|
|
|
|
|
USA |
5.7 |
7.3 |
-6.4 |
-5.1 |
4.3 |
| |
|
|
|
|
|
|
Japan |
8.9 |
4.1 |
-15.8 |
3.3 |
13.2 |
| |
|
|
|
|
|
|
China |
12.8 |
14.5 |
6.8 |
22.4 |
34.5 |
| |
|
|
|
|
|
|
Hong Kong SAR (China) |
16.8 |
8.3 |
-5.9 |
5.4 |
11.8 |
| |
|
|
|
|
|
|
Taiwan (China) |
14.9 |
7.2 |
-17.1 |
6.5 |
10.5 |
| |
|
|
|
|
|
|
India |
7.3 |
9.5 |
2.3 |
13.8 |
13.5 |
| |
|
|
|
|
|
|
Indonesia |
-0.9 |
8.1 |
-9.1 |
3.0 |
7.8 |
| |
|
|
|
|
|
|
Republic of Korea |
15.1 |
10.1 |
-12.7 |
8.0 |
19.3 |
| |
|
|
|
|
|
|
Malaysia |
8.6 |
12.2 |
-10.4 |
6.0 |
6.5 |
| |
|
|
|
|
|
|
Philippines |
3.9 |
18.9 |
-17.9 |
11.8 |
0 |
| |
|
|
|
|
|
|
Singapore |
9.9 |
9.9 |
-11.7 |
2.8 |
16.1 |
| |
|
|
|
|
|
|
Thailand |
14.0 |
10.5 |
-5.7 |
5.6 |
17.1 |
| |
|
|
|
|
|
|
Source : UNCTAD Handbook (2004). |
Growth in Imports
As in the case of exports, developing economies experienced higher growth in world trade in imports than developed economies after 1990 except during the year 2000-01. During this year, there was negative growth in world trade in imports. China, however, managed an impressive growth in its import trade by around 8.2 per cent in that year. Barring 2000-01, imports by India grew impressively after 1990 and the growth was above the world average and above that of many other important economies.
Share of Exports and Imports to GDP
Share of exports and imports of Developing Economies to their GDP (at current prices) went up significantly after 1990 and remained
Table 4: Annual Average Growth in Imports
| |
|
|
|
|
(Per cent) |
| |
|
|
|
|
|
|
Year |
1980-90 |
1990-2000 |
2000-01 |
2001-02 |
2002-03 |
| |
|
|
|
|
|
|
World |
6.1 |
6.5 |
-3.7 |
3.6 |
16.5 |
| |
|
|
|
|
|
|
Developed Economies |
6.9 |
6.0 |
-3.7 |
2.8 |
15.5 |
| |
|
|
|
|
|
|
Developing Economies |
4.2 |
8.3 |
-5.1 |
4.8 |
17.9 |
| |
|
|
|
|
|
|
South-East Europe and CIS |
4.2 |
3.5 |
14.7 |
11.1 |
28.5 |
| |
|
|
|
|
|
|
USA |
8.2 |
9.5 |
-6.4 |
2.0 |
8.6 |
| |
|
|
|
|
|
|
Japan |
5.1 |
4.6 |
-8.0 |
-3.4 |
13.6 |
| |
|
|
|
|
|
|
China |
13.5 |
13.1 |
8.2 |
21.2 |
39.9 |
| |
|
|
|
|
|
|
Hong Kong SAR (China) |
15.0 |
8.8 |
-5.5 |
3.3 |
11.7 |
| |
|
|
|
|
|
|
Taiwan (China) |
12.4 |
8.5 |
-23.3 |
5.1 |
12.9 |
| |
|
|
|
|
|
|
India |
4.3 |
10.1 |
-2.2 |
12.2 |
25.1 |
| |
|
|
|
|
|
|
Indonesia |
2.6 |
2.7 |
-7.5 |
-18.1 |
64.2 |
| |
|
|
|
|
|
|
Republic of Korea |
11.9 |
7.1 |
-12.1 |
7.8 |
17.6 |
| |
|
|
|
|
|
|
Malaysia |
7.7 |
9.5 |
-9.9 |
8.1 |
2.6 |
| |
|
|
|
|
|
|
Philippines |
2.9 |
12.5 |
-5.7 |
6.5 |
6.3 |
| |
|
|
|
|
|
|
Singapore |
8.0 |
7.8 |
-13.8 |
0.4 |
9.9 |
| |
|
|
|
|
|
|
Thailand |
12.7 |
5 |
0.2 |
4.2 |
17.3 |
| |
|
|
|
|
|
|
Source : UNCTAD Handbook (2004). |
very high in comparison to that of world ratio as well as to that of Developed Economies and ‘SE Europe and CIS’ economies (Table 5). Share of exports and imports trade to GDP is more than 100 per cent in case of Singapore and Hong Kong SAR (China) and around 100 per cent in case of Malaysia in exports. Philippines, China and Thailand are the other three countries under study which raised their shares of exports and imports to their GDP very significantly. Share of exports and imports to GDP in case of all the developing Asian economies under study except India remained substantially higher than that observed for the USA and Japan.
Trade Balance
Developing economies and ‘S.E. Europe and CIS economies’ had trade surplus consecutively in the first four years of the new
Table 5: Percentage Share of Exports and Imports to GDP
| |
|
Percentage Share of Exports to GDP
|
Percentage Share of Imports to GDP
|
| |
|
|
(at current prices)
|
|
|
(at current prices)
|
|
| |
|
1980
|
1990
|
2000
|
2001
|
2002
|
2003
|
1980
|
1990
|
2000
|
2001
|
2002
|
2003
|
| |
|
|
|
|
|
|
|
|
|
|
|
|
|
|
World
|
|
18.98
|
16.12
|
20.20
|
19.62
|
19.77
|
20.53
|
19.36
|
16.68
|
20.80
|
20.22
|
20.20
|
21.00
|
| |
|
|
|
|
|
|
|
|
|
|
|
|
|
|
Developed
|
|
|
|
|
|
|
|
|
|
|
|
|
|
|
Economies
|
|
16.47
|
14.78
|
17.21
|
16.94
|
16.78
|
17.21
|
18.25
|
15.50
|
18.77
|
18.31
|
18.06
|
18.60
|
| |
|
|
|
|
|
|
|
|
|
|
|
|
|
|
Developing
|
|
|
|
|
|
|
|
|
|
|
|
|
|
|
Economies
|
|
24.76
|
22.55
|
30.75
|
29.25
|
31.09
|
33.31
|
20.51
|
21.72
|
28.72
|
27.65
|
28.83
|
30.81
|
| |
|
|
|
|
|
|
|
|
|
|
|
|
|
|
SE Europe and
|
|
|
|
|
|
|
|
|
|
|
|
|
|
CIS
|
|
45.41
|
14.52
|
23.68
|
20.94
|
19.81
|
20.69
|
45.45
|
17.93
|
16.39
|
16.59
|
16.39
|
17.42
|
| |
|
|
|
|
|
|
|
|
|
|
|
|
|
|
USA
|
|
8.14
|
6.84
|
7.96
|
7.24
|
6.62
|
6.59
|
9.27
|
8.99
|
12.83
|
11.67
|
11.47
|
11.88
|
| |
|
|
|
|
|
|
|
|
|
|
|
|
|
|
Japan
|
|
12.16
|
9.42
|
10.09
|
9.69
|
10.49
|
10.97
|
13.17
|
7.71
|
7.99
|
8.39
|
8.49
|
8.90
|
| |
|
|
|
|
|
|
|
|
|
|
|
|
|
|
China
|
|
8.97
|
17.51
|
23.06
|
22.63
|
25.72
|
31.06
|
9.89
|
15.04
|
20.83
|
20.71
|
23.31
|
29.30
|
| |
|
|
|
|
|
|
|
|
|
|
|
|
|
|
Hong Kong
|
|
|
|
|
|
|
|
|
|
|
|
|
|
|
SAR (China)
|
69.32
|
109.86
|
122.07
|
116.62
|
123.87
|
141.09
|
78.77
|
110.30
|
128.69
|
123.49
|
128.55
|
146.22
|
| |
|
|
|
|
|
|
|
|
|
|
|
|
|
|
Taiwan (China)
|
47.77
|
41.88
|
47.76
|
43.57
|
46.27
|
50.42
|
47.72
|
34.24
|
45.23
|
38.16
|
40.00
|
44.49
|
| |
|
|
|
|
|
|
|
|
|
|
|
|
|
|
India
|
|
4.69
|
5.67
|
9.20
|
9.15
|
10.01
|
9.73
|
8.13
|
7.44
|
11.18
|
10.64
|
11.47
|
12.29
|
| |
|
|
|
|
|
|
|
|
|
|
|
|
|
|
Indonesia
|
|
28.08
|
22.44
|
41.36
|
39.41
|
33.53
|
30.07
|
13.89
|
19.08
|
22.31
|
21.65
|
14.65
|
20.01
|
| |
|
|
|
|
|
|
|
|
|
|
|
|
|
|
Republic of Korea
|
28.15
|
25.74
|
33.67
|
31.22
|
29.71
|
32.02
|
35.83
|
27.65
|
31.36
|
29.28
|
27.81
|
29.54
|
| |
|
|
|
|
|
|
|
|
|
|
|
|
|
|
Malaysia
|
|
51.91
|
66.90
|
108.95
|
100.03
|
98.27
|
96.32
|
43.22
|
66.46
|
90.91
|
83.96
|
84.15
|
79.44
|
| |
|
|
|
|
|
|
|
|
|
|
|
|
|
|
Philippines
|
|
17.66
|
18.31
|
53.21
|
46.00
|
47.54
|
46.07
|
25.51
|
29.33
|
49.52
|
49.17
|
48.42
|
49.86
|
| |
|
|
|
|
|
|
|
|
|
|
|
|
|
|
Singapore
|
|
165.34
|
143.80
|
148.80
|
141.58
|
141.80
|
159.14
|
204.87
|
165.73
|
145.28
|
134.89
|
131.91
|
140.06
|
| |
|
|
|
|
|
|
|
|
|
|
|
|
|
|
Thailand
|
|
20.11
|
27.03
|
56.26
|
56.35
|
54.19
|
56.24
|
28.48
|
38.72
|
50.45
|
53.71
|
50.95
|
52.95
|
| |
|
|
|
|
|
|
|
|
|
|
|
|
|
|
Source :Author’s
calculation based on UNCTAD Handbook (2004) data and GDP values available
on
UNCTAD web site (www.unctad.org).
|
millennium under study (Table 6). Developed Economies had trade deficit in all these years. Trade deficit as percentage of imports for the USA went up from 37.97 per cent in 2000 to 44.55 per cent in 2003. China and all the East Asian economies under study except Hong Kong SAR (China) and Philippines had trade surplus in these years. India had trade deficit in all these years and the same as percentage to imports declined in 2001 and 2002 but increased to 20.83 per cent in 2003. Trade deficit of India as percentage of imports also remained higher than the world average in all these years.
Table 6: Trade Balance as Percentage of Imports
| |
|
1980
|
1990
|
2000
|
2001
|
2002
|
2003
|
|
World
|
|
-1.98
|
-3.36
|
-2.91
|
-2.99
|
-2.11
|
-2.24
|
|
Developed Economies
|
-9.75
|
-4.63
|
-8.33
|
-7.52
|
-7.06
|
-7.48
|
|
Developing
|
Economies
|
20.69
|
3.84
|
7.07
|
5.78
|
7.84
|
8.13
|
|
South-East Europe and CIS
|
-0.08
|
-19.02
|
44.44
|
26.19
|
20.88
|
18.77
|
|
USA
|
|
-12.23
|
-23.87
|
-37.97
|
-38.02
|
-42.30
|
-44.55
|
|
Japan
|
|
-7.68
|
22.18
|
26.28
|
15.59
|
23.59
|
23.21
|
|
China
|
|
-9.24
|
16.40
|
10.71
|
9.26
|
10.31
|
6.01
|
|
Hong Kong SAR (China)
|
-12.01
|
-0.40
|
-5.14
|
-5.56
|
-3.64
|
-3.51
|
|
Taiwan (China)
|
0.11
|
22.34
|
5.61
|
14.20
|
15.70
|
13.31
|
|
India
|
|
-42.24
|
-23.80
|
-17.75
|
-13.98
|
-12.75
|
-20.83
|
|
Indonesia
|
|
102.22
|
17.58
|
85.36
|
82.03
|
128.93
|
50.26
|
|
Republic of Korea
|
-21.44
|
-6.91
|
7.34
|
6.62
|
6.80
|
8.38
|
|
Malaysia
|
|
20.09
|
0.66
|
19.85
|
19.14
|
16.77
|
21.26
|
|
Philippines
|
|
-30.76
|
-37.58
|
7.44
|
-6.46
|
-1.82
|
-7.59
|
|
Singapore
|
|
-19.29
|
-13.24
|
2.42
|
4.96
|
7.50
|
13.63
|
|
Thailand
|
|
-29.40
|
-30.19
|
11.52
|
4.92
|
6.36
|
6.22
|
| |
|
|
|
|
|
|
|
|
Source : Author’s
calculation based on UNCTAD Handbook (2004) data.
|
Table 7 presents trade balance as a per cent of GDP (at current prices). Developed Economies’ trade deficit to GDP ratio remained below two per cent. But, in the case of the USA, trade deficit as per cent of GDP increased from 1.13 per cent in 1980 to 5.29 per cent in 2003.
Market Concentration Indices for Commodities Traded
Table 8 furnishes the market concentration indices on exports and imports for commodities traded in the years 1992 and 2002, respectively. As noted earlier, the index value closer to one indicates higher market concentration which means higher impact on trade due to possible price fluctuations of specific products. Data in Table-8 show that merchandise trade of the Developing Economies has higher concentration than that of Developed Economies. The indices reveal very low market concentration of merchandise trade by the USA indicating a well diversified trade structure. In case of exports trade, China also shows very low concentration. In case of imports the same
Table 7: Trade Balance as Percentage of GDP
| |
1980 |
1990 |
2000 |
2001 |
2002 |
2003 |
| |
|
|
|
|
|
|
|
World |
-0.38 |
-0.56 |
-0.61 |
-0.61 |
-0.43 |
-0.47 |
| |
|
|
|
|
|
|
|
Developed Economies |
-1.78 |
-0.72 |
-1.56 |
-1.38 |
-1.28 |
-1.39 |
| |
|
|
|
|
|
|
|
Developing Economies |
4.24 |
0.83 |
2.03 |
1.60 |
2.26 |
2.51 |
| |
|
|
|
|
|
|
|
SE Europe and CIS |
-0.04 |
-3.41 |
7.28 |
4.35 |
3.42 |
3.27 |
| |
|
|
|
|
|
|
|
USA |
-1.13 |
-2.15 |
-4.87 |
-4.44 |
-4.85 |
-5.29 |
| |
|
|
|
|
|
|
|
Japan |
-1.01 |
1.71 |
2.10 |
1.31 |
2.00 |
2.07 |
| |
|
|
|
|
|
|
|
China |
-0.91 |
2.47 |
2.23 |
1.92 |
2.40 |
1.76 |
| |
|
|
|
|
|
|
|
Hong Kong SAR (China) |
-9.46 |
-0.44 |
-6.62 |
-6.87 |
-4.68 |
-5.13 |
| |
|
|
|
|
|
|
|
Taiwan (China) |
0.05 |
7.65 |
2.54 |
5.42 |
6.28 |
5.92 |
| |
|
|
|
|
|
|
|
India |
-3.43 |
-1.77 |
-1.98 |
-1.49 |
-1.46 |
-2.56 |
| |
|
|
|
|
|
|
|
Indonesia |
14.20 |
3.35 |
19.05 |
17.76 |
18.88 |
10.06 |
| |
|
|
|
|
|
|
|
Republic of Korea |
-7.68 |
-1.91 |
2.30 |
1.94 |
1.89 |
2.48 |
| |
|
|
|
|
|
|
|
Malaysia |
8.69 |
0.44 |
18.04 |
16.07 |
14.11 |
16.89 |
| |
|
|
|
|
|
|
|
Philippines |
-7.85 |
-11.02 |
3.69 |
-3.18 |
-0.88 |
-3.79 |
| |
|
|
|
|
|
|
|
Singapore |
-39.53 |
-21.94 |
3.52 |
6.69 |
9.90 |
19.08 |
| |
|
|
|
|
|
|
|
Thailand |
-8.37 |
-11.69 |
5.81 |
2.64 |
3.24 |
3.29 |
|
Source:Author’s calculation based on UNCTAD Handbook (2004)
data and GDP valuesavailable in UNCTAD web site (www.unctad.org). |
is observed for Japan. Among other Asian economies under study, concentration indices on products traded increased significantly in the case of Hong Kong SAR (China), Republic of Korea, Malaysia, Philippines, Singapore and Taiwan (China).
Indices indicate that India’s exports were somewhat more diversified in 2002 in comparison to the position in 1992. In 2002, market concentration of India in products exported was lower than the world average as well to all other economies under study except USA, China, Hong Kong SAR (China) and Indonesia. However, in case of imports trade, degree of concentration increased in 2002 in comparison to 1992 and was higher than all the economies under study in 1992 and all economies except Malaysia and Philippines in 2002. High oil imports along with higher prices of oil might have increased the concentration in import trade for India.
Table 8: Concentration Indices for Products Traded
| |
|
Export
|
|
Import
|
|
| |
|
1992
|
2002
|
1992
|
2002
|
|
World
|
|
0.139
|
0.157
|
0.083
|
0.103
|
|
Developed
|
Economies
|
0.098
|
0.115
|
0.074
|
0.088
|
|
Developing
|
economies
|
0.25
|
0.234
|
0.096
|
0.139
|
|
USA
|
|
0.081
|
0.084
|
0.096
|
0.102
|
|
Japan
|
|
0.14
|
0.149
|
0.106
|
0.099
|
|
China
|
|
..
|
0.085
|
..
|
0.113
|
|
Hong Kong SAR (China)
|
0.09
|
0.119
|
0.065
|
0.118
|
|
Taiwan (China)
|
0.089
|
0.153
|
0.085
|
0.165
|
|
India
|
|
0.14
|
0.13
|
0.195
|
0.248
|
|
Indonesia
|
|
0.195
|
0.12
|
0.063
|
0.119
|
|
Republic of Korea
|
0.109
|
0.148
|
0.107
|
0.139
|
|
Malaysia
|
|
0.156
|
0.216
|
0.12
|
0.262
|
|
Philippines
|
|
0.293
|
0.417
|
0.161
|
0.305
|
|
Singapore
|
|
0.184
|
0.249
|
0.107
|
0.203
|
| |
|
|
|
|
|
|
Source :
UNCTAD Handbook (2004) (data on Thailand were not available).
|
Distribution of Exports by Main Regions of Destination
Table 9 furnishes the percentage distribution of exports by main regions of destination for the years 1990, 1995, 2000 and 2003. Due to unspecified destinations, the total may not add to 100 per cent for some economies. It is observed that in case of all the Asian economies under study except China, share of exports to the Developing Economies in ‘Other Asia1’ (Asia other than West Asia2) increased significantly and share of exports to the Developed Economies decreased with almost equal proportion after 1990. Similar change in direction of exports trade is also observed in case of the USA and Japan. In case of Hong Kong SAR (China), Philippines, Singapore and Thailand, the reduction in share of exports to Europe, the USA and Canada is more prominent. In case of Korea, the decrease in share is more prominent in case of exports to the USA, Canada and Japan. Share of exports to ‘Other Asia’ from China declined substantially from about 54 per cent in 1990 to around 33 per cent in 2003 but share of exports to Europe, the USA and Canada increased with almost equal proportion.
Table 9 : Distribution of Exports by Main Regions of Destination*
| |
|
|
|
|
|
|
|
|
|
|
(Per cent) |
| |
|
Developed |
Economies |
|
SEA & |
|
Developing Economies |
|
| |
Year |
Total |
Europe |
USA & |
Japan |
Other |
CIS |
Total |
America |
Africa |
West |
Other |
| |
|
|
|
Canada |
|
|
|
|
|
|
Asia2 |
Asia1 |
|
China |
1990 |
35.7 |
11 |
9.2 |
14.7 |
0.8 |
3.7 |
59.8 |
1.2 |
2.1 |
2.2 |
54.1 |
| |
1995 |
52.2 |
14.1 |
17.6 |
19.1 |
1.4 |
1.5 |
46.3 |
2.1 |
1.7 |
2.2 |
40.4 |
| |
2000 |
58.4 |
16.5 |
24.2 |
15.8 |
1.9 |
1.2 |
40.4 |
2.6 |
1.8 |
2.3 |
33.7 |
| |
2003 |
56.2 |
18.3 |
22.4 |
13.6 |
1.9 |
2.4 |
41.5 |
2.7 |
2.3 |
3.2 |
33.2 |
|
Hong Kong |
|
|
|
|
|
|
|
|
|
|
|
|
|
SAR (China) |
1990 |
53.6 |
20 |
26 |
5.7 |
1.9 |
0.3 |
46.1 |
1.8 |
1.8 |
1.4 |
40.8 |
| |
1995 |
47.4 |
16.1 |
23.3 |
6.1 |
1.8 |
0.2 |
52.3 |
2.8 |
1.5 |
1.4 |
46.6 |
| |
2000 |
48.6 |
16.4 |
24.9 |
5.5 |
1.8 |
0.1 |
51.3 |
2.4 |
0.9 |
1.1 |
46.7 |
| |
2003 |
41.5 |
14.4 |
20 |
5.4 |
1.7 |
0.2 |
58.3 |
1.4 |
0.7 |
1.2 |
54.9 |
|
Taiwan (China) |
1990 |
68.3 |
18.3 |
35.1 |
12.5 |
2.4 |
0.2 |
30.9 |
1.9 |
1.1 |
1.8 |
26.1 |
| |
1995 |
52.7 |
13.9 |
25 |
11.8 |
2.1 |
0.2 |
46.4 |
2.4 |
1.5 |
1.7 |
40.8 |
| |
2000 |
53.5 |
15.8 |
24.8 |
11.2 |
1.7 |
0.2 |
45.6 |
2.6 |
0.9 |
1.4 |
40.6 |
| |
2003 |
42.8 |
13.9 |
19.4 |
7.7 |
1.7 |
0.4 |
56.1 |
2.8 |
0.8 |
1.4 |
50.9 |
|
India |
1990 |
57.3 |
30.5 |
16 |
9.3 |
1.5 |
16.8 |
21.5 |
0.4 |
2.5 |
6.3 |
12.2 |
| |
1995 |
55.8 |
28.6 |
18.3 |
7 |
1.9 |
3.8 |
36.4 |
1.2 |
4.9 |
8.3 |
22 |
| |
2000 |
54.6 |
25.5 |
22.8 |
4.1 |
2.2 |
2.7 |
39.4 |
2.2 |
5.3 |
10.9 |
20.9 |
| |
2003 |
52 |
24.5 |
22 |
3.2 |
2.4 |
1.7 |
42.9 |
3 |
4.8 |
8.4 |
26.5 |
|
Indonesia |
1990 |
70.5 |
12.4 |
13.6 |
42.5 |
1.9 |
0.4 |
29.1 |
0.4 |
0.7 |
2.7 |
25.2 |
| |
1995 |
59.5 |
15.4 |
14.7 |
27.1 |
2.3 |
0.4 |
40.1 |
1.6 |
1.4 |
3.3 |
33.6 |
| |
2000 |
54.7 |
14.6 |
14.3 |
23.2 |
2.6 |
0.3 |
45 |
1.7 |
1.8 |
3.3 |
38.1 |
| |
2003 |
52 |
13.8 |
12.7 |
22.3 |
3.2 |
0.6 |
47.5 |
1.4 |
2 |
3.3 |
40.6 |
|
Japan |
1990 |
59.1 |
22.1 |
34 |
0 |
3 |
1 |
39.9 |
3.4 |
1.9 |
3.2 |
31.1 |
| |
1995 |
48.2 |
16.9 |
28.9 |
0 |
2.4 |
0.3 |
51.5 |
4.2 |
1.7 |
1.9 |
43.6 |
| |
2000 |
51.6 |
17.6 |
31.7 |
0 |
2.3 |
0.2 |
48.2 |
3.9 |
1 |
2 |
41.2 |
| |
2003 |
45.5 |
16.5 |
26.3 |
0 |
2.7 |
0.5 |
54 |
3.2 |
1.2 |
2.8 |
46.2 |
|
Republic of Korea |
1990 |
67.1 |
15.7 |
31.2 |
18.6 |
1.6 |
.. |
24.6 |
3 |
1.8 |
3 |
16.7 |
| |
1995 |
48.6 |
14 |
19.9 |
13 |
1.7 |
1.7 |
44.7 |
5.4 |
2.3 |
3.2 |
33.7 |
| |
2000 |
52.4 |
15 |
23.4 |
11.9 |
2.1 |
0.9 |
46.7 |
5.3 |
1.9 |
4.1 |
35 |
| |
2003 |
44.7 |
14.5 |
19.8 |
8.4 |
2.2 |
1.2 |
54.5 |
6.2 |
2.4 |
4 |
41.3 |
|
Malaysia |
1990 |
50.8 |
15.8 |
17.7 |
15.3 |
1.9 |
0.8 |
48.4 |
0.7 |
0.8 |
2.4 |
44.5 |
| |
1995 |
50.4 |
14.6 |
21.6 |
12.5 |
1.8 |
0.2 |
48.9 |
1.6 |
1.1 |
2.4 |
43.8 |
| |
2000 |
51.4 |
14.2 |
21.4 |
13 |
2.8 |
0.1 |
48.4 |
1.5 |
0.8 |
2 |
44.1 |
| |
2003 |
46.3 |
13.4 |
20.9 |
9.4 |
2.6 |
0.3 |
53.3 |
2.8 |
1.1 |
2 |
47.4 |
|
Philippines |
1990 |
79.3 |
18.8 |
39.4 |
19.8 |
1.3 |
0 |
20.6 |
0.9 |
0.3 |
1.6 |
17.5 |
| |
1995 |
71.6 |
17.9 |
36.9 |
15.8 |
1 |
0 |
28.3 |
1.1 |
0.2 |
1.2 |
25.6 |
| |
2000 |
64.7 |
18.3 |
30.8 |
14.7 |
1 |
0 |
34.9 |
1.1 |
0.1 |
0.4 |
33.2 |
| |
2003 |
52.7 |
15.2 |
21.8 |
14.4 |
1.4 |
0.1 |
47.2 |
1.8 |
0.2 |
0.5 |
44.7 |
|
Singapore |
1990 |
50.3 |
16.4 |
22.1 |
8.8 |
3 |
0.9 |
48.8 |
1.3 |
2.1 |
2.4 |
41.8 |
| |
1995 |
43.6 |
14.3 |
18.7 |
7.8 |
2.7 |
0.9 |
55.6 |
1.4 |
1.3 |
1.4 |
51 |
| |
2000 |
42.5 |
14.5 |
17.7 |
7.5 |
2.8 |
0.1 |
57.4 |
1.9 |
1.2 |
1.5 |
52.2 |
| |
2003 |
39.7 |
14.7 |
14.6 |
6.7 |
3.8 |
0.2 |
60 |
1.8 |
1.2 |
1.9 |
54.5 |
|
Thailand |
1990 |
68.1 |
24.8 |
24 |
17.2 |
2.1 |
0.6 |
30.8 |
1.4 |
2.5 |
4.8 |
22 |
| |
1995 |
54.1 |
17 |
18.7 |
16.6 |
1.8 |
0.9 |
45 |
1 |
1.7 |
4 |
35.6 |
| |
2000 |
57.7 |
17.2 |
22.5 |
14.7 |
3.3 |
0.2 |
41.7 |
1.5 |
1.9 |
2.4 |
35.8 |
| |
2003 |
52.4 |
16.4 |
18.2 |
14.2 |
3.7 |
0.5 |
47 |
1.5 |
2.1 |
2.9 |
40.4 |
|
USA |
1990 |
64.9 |
28.2 |
21.1 |
12.4 |
3.3 |
1 |
33.8 |
13.7 |
2 |
2.6 |
15.4 |
| |
1995 |
58.6 |
22.9 |
21.6 |
11 |
3.1 |
0.8 |
40.5 |
16.5 |
1.7 |
2.5 |
19.8 |
| |
2000 |
57 |
23.2 |
22.6 |
8.4 |
2.8 |
0.5 |
42.4 |
21.6 |
1.4 |
2 |
17.2 |
| |
2003 |
56.4 |
22.8 |
23.4 |
7.2 |
3 |
0.6 |
43 |
20.6 |
1.5 |
2.1 |
18.7 |
| |
|
|
|
|
|
|
|
|
|
|
|
|
|
* Total may not lead to 100 per cent due to unspecified destinations. Source: UNCTAD Handbook (2004). |
Share of Indian exports to developing economies in ‘Other Asia’, notwithstanding an increase after 1990, remained substantially lower than the other Asian economies under study. Share of exports from India to Europe and Japan reduced by around 12 percentage points in 2003 vis-à-vis that in 1990; however, share of exports to the USA increased by around 6 percentage points during the same period. Among all the economies under study, share of Indian exports to the S.E. Europe and CIS economies was substantially higher in 1990. However, the share which was around 16.8 per cent in 1990 decreased to around 1.7 per cent in 2003, indicating that India’s business with the economies in that region has drastically reduced in the last decade.
Distribution of Imports by Main Regions of Origin
Table 10 furnishes the distribution of imports by main regions of origin for the years 1990, 1995, 2000 and 2003. Due to unspecified origins, here also the total may not add to 100 per cent for some economies. It is observed that in case of all the Asian economies under study, shares of imports from developed economies reduced noticeably after 1990. As was observed in case of exports, share of imports too from ‘Other Asia’ by all the Asian economies under study except China increased substantially after 1990. A similar trend is observed for imports by the USA and Japan. However, in case of China, there has not been much change in the share after 1990, although the same remained higher than Taiwan (China), India, Korea and Thailand in the years under study. Share of Indian imports from the USA and Canada reduced substantially after 1990 and the share remained much lower in comparison to other Asian economies under reference. However, imports from developed Europe account for a significantly higher share in case of India (although the share declined after 1990) vis-à-vis the other Asian economies while opposite is the fact in respect of imports from ‘Other Asia’. These trends about India have to be read with the fact that for India, share of imports from origins unspecified was very high, around 23 and 21 per cent in 2000 and 2003, respectively.
Table 10: Import Structure by Main Regions of Origin*
| |
|
|
|
|
|
|
|
|
|
(Per cent) |
| |
|
Developed |
Economies |
|
SEA & |
|
Developing Economies |
| |
Year |
Total |
Europe |
USA & |
Japan |
Other |
CIS |
Total |
America |
Africa |
West |
Other |
| |
|
|
|
Canada |
|
|
|
|
|
|
Asia2 |
Asia1 |
|
China |
1990 |
51.3 |
19.3 |
15 |
14.2 |
2.8 |
4.8 |
43.1 |
2.8 |
0.7 |
1 |
38.5 |
| |
1995 |
55.7 |
17.2 |
14.2 |
21.9 |
2.3 |
3.9 |
38.7 |
2.2 |
1.1 |
1.6 |
33.7 |
| |
2000 |
46 |
14.3 |
11.2 |
17.8 |
2.6 |
3.1 |
47.9 |
2.1 |
2.1 |
3.9 |
39.6 |
| |
2003 |
43.5 |
14.1 |
9.3 |
18 |
2.2 |
3.3 |
47.1 |
3.6 |
2 |
3.5 |
38 |
|
Hong Kong |
|
|
|
|
|
|
|
|
|
|
|
|
|
SAR (China) |
1990 |
38.6 |
12.3 |
8.5 |
16.1 |
1.7 |
0.1 |
61.3 |
0.8 |
0.6 |
0.3 |
59.6 |
| |
1995 |
36.8 |
12 |
8.4 |
14.8 |
1.6 |
0.3 |
63 |
0.6 |
0.4 |
0.6 |
61.3 |
| |
2000 |
30.8 |
10 |
7.5 |
12 |
1.4 |
0.2 |
68.9 |
0.6 |
0.3 |
0.5 |
67.5 |
| |
2003 |
28.9 |
9.9 |
6 |
11.9 |
1.2 |
0.3 |
70.8 |
0.8 |
0.4 |
0.8 |
68.8 |
|
Taiwan (China) |
1990 |
76.1 |
17.7 |
25 |
30 |
3.6 |
0.2 |
23.5 |
2.4 |
0.5 |
6.1 |
14.5 |
| |
1995 |
70 |
16.2 |
21.6 |
29.2 |
3 |
1.9 |
28 |
2.3 |
1.8 |
3.7 |
20.2 |
| |
2000 |
61.7 |
12.3 |
18.9 |
27.5 |
3.1 |
1.3 |
36.9 |
1.5 |
2.3 |
4.5 |
28.5 |
| |
2003 |
52.6 |
10.8 |
14.5 |
24.8 |
2.5 |
1 |
46.1 |
1.3 |
1.9 |
6.3 |
36.6 |
|
India |
1990 |
58.6 |
35 |
12.3 |
7.5 |
3.8 |
6.3 |
34.6 |
2.2 |
3.1 |
18 |
11.2 |
| |
1995 |
49.6 |
29 |
10.6 |
6.5 |
3.5 |
3.5 |
41.1 |
1.5 |
5 |
20.5 |
14.1 |
| |
2000 |
41.6 |
27.3 |
7 |
4 |
3.2 |
1.6 |
33.4 |
1.5 |
6.4 |
8.3 |
17.2 |
| |
2003 |
37.3 |
22.6 |
7.4 |
3.2 |
4.1 |
3.7 |
38.2 |
2.9 |
5 |
8.1 |
22.2 |
|
Indonesia |
1990 |
66.2 |
22 |
13.3 |
24.8 |
6 |
0.4 |
33 |
2.3 |
0.7 |
5.1 |
24.8 |
| |
1995 |
63.4 |
21.6 |
13.7 |
22.7 |
5.5 |
1.3 |
35.1 |
2.6 |
1.5 |
4 |
26.8 |
| |
2000 |
47.1 |
13.2 |
12 |
16.1 |
5.7 |
0.7 |
51.3 |
1.8 |
2.5 |
8.5 |
38.4 |
| |
2003 |
39.8 |
11.9 |
9.3 |
13 |
5.5 |
1.1 |
58.2 |
1.7 |
4.9 |
8 |
43.1 |
|
Japan |
1990 |
50.8 |
18.3 |
26.1 |
0 |
6.4 |
1.5 |
47.7 |
4 |
1.6 |
13 |
28.8 |
| |
1995 |
47.5 |
16.3 |
25.8 |
0 |
5.5 |
1.5 |
50.9 |
3.4 |
1.4 |
9.1 |
36.6 |
| |
2000 |
39.9 |
13.8 |
21.4 |
0 |
4.7 |
1.3 |
58.8 |
2.8 |
1.3 |
12.8 |
41.7 |
| |
2003 |
36.7 |
14.4 |
17.6 |
0 |
4.6 |
1.3 |
62.1 |
2.5 |
1.7 |
13.2 |
44.5 |
|
Republic of Korea |
1990 |
66.9 |
13.1 |
24.7 |
25 |
4.1 |
.. |
20.7 |
2.3 |
0.8 |
7 |
10.3 |
| |
1995 |
67.9 |
14.9 |
24.4 |
24.1 |
4.4 |
1.8 |
29.6 |
2.9 |
1.7 |
8.4 |
16.4 |
| |
2000 |
54.8 |
10.9 |
19.6 |
19.8 |
4.4 |
1.6 |
43.6 |
2 |
2 |
15.6 |
23.9 |
| |
2003 |
51.2 |
12.1 |
15 |
20.5 |
3.6 |
1.2 |
47.6 |
2.4 |
1.4 |
13.7 |
30.1 |
|
Malaysia |
1990 |
63.8 |
17.5 |
17.9 |
24.2 |
4.1 |
0.4 |
35.7 |
1.8 |
0.5 |
1.2 |
32 |
| |
1995 |
64.5 |
17.3 |
16.8 |
27.3 |
3.1 |
0.4 |
34.4 |
1.2 |
0.5 |
0.8 |
31.8 |
| |
2000 |
52.7 |
12.3 |
17.1 |
21.1 |
2.3 |
0.3 |
45.1 |
0.8 |
0.5 |
2 |
41.8 |
| |
2003 |
38.5 |
11.6 |
12.5 |
12.5 |
1.8 |
0.6 |
59.6 |
0.9 |
0.4 |
1.8 |
56.4 |
|
Philippines |
1990 |
56.5 |
12.8 |
21 |
18.4 |
4.3 |
0.4 |
43.1 |
2.6 |
0.7 |
11.4 |
27.9 |
| |
1995 |
57.2 |
11.5 |
19.4 |
22.3 |
4 |
0.3 |
39.8 |
1.7 |
0.6 |
7.9 |
29.1 |
| |
2000 |
52.2 |
9.8 |
19.2 |
18.9 |
4.3 |
0.3 |
46.8 |
0.8 |
0.2 |
9.1 |
36.5 |
| |
2003 |
49.6 |
8.8 |
18.5 |
20 |
2.3 |
0.5 |
49.1 |
1.1 |
0.2 |
6.7 |
41 |
|
Singapore |
1990 |
54.6 |
15.5 |
16.7 |
20.1 |
2.3 |
0.3 |
45 |
1.2 |
0.8 |
10.8 |
32.3 |
| |
1995 |
53.6 |
15.2 |
15.5 |
21.1 |
1.8 |
0.4 |
46 |
0.9 |
0.6 |
6.4 |
38.1 |
| |
2000 |
48.5 |
13.8 |
15.4 |
17.2 |
2.1 |
0.3 |
50.7 |
0.7 |
0.5 |
7.9 |
41.6 |
| |
2003 |
43.6 |
15 |
14.5 |
12 |
2.1 |
0.6 |
55.7 |
0.9 |
0.6 |
8.4 |
45.7 |
|
Thailand |
1990 |
63.7 |
19 |
11.9 |
30.4 |
2.4 |
0.7 |
34.9 |
2 |
0.9 |
3.8 |
28.1 |
| |
1995 |
61 |
17.1 |
12.2 |
29.3 |
2.4 |
1.8 |
37.2 |
1.5 |
0.9 |
3.4 |
26.7 |
| |
2000 |
51.4 |
11.7 |
12.3 |
24.7 |
2.7 |
1 |
45.5 |
1.3 |
1.3 |
9.7 |
33.1 |
| |
2003 |
48.5 |
11.4 |
10 |
24.1 |
3 |
1.1 |
48.5 |
2 |
1.3 |
9.3 |
35.7 |
|
USA |
1990 |
59.7 |
21.7 |
18.1 |
18 |
1.9 |
0.4 |
39.8 |
13 |
3.3 |
3.4 |
20.1 |
| |
1995 |
56.7 |
19.6 |
19.2 |
16.5 |
1.4 |
0.7 |
42.5 |
14 |
2.1 |
1.8 |
24.6 |
| |
2000 |
52.3 |
19.9 |
18.5 |
12.1 |
1.8 |
0.9 |
46.9 |
17 |
2.3 |
2.4 |
25.1 |
| |
2003 |
49.7 |
21.2 |
17.4 |
9.3 |
1.7 |
0.9 |
49.4 |
17.1 |
2.6 |
2.7 |
27 |
| |
|
|
|
|
|
|
|
|
|
|
|
|
|
* Total may not lead to 100 per cent due to unspecified destinations. Source: UNCTAD Handbook (2004). |
Terms of Trade Indices
Table 11 furnishes the terms of trade indices for the economies under study. In the years under study, except 1980, terms of trade remained more favourable to Developed Economies vis-à-vis Developing Economies. Korea, Malaysia, Singapore and Thailand enjoyed very good terms of trade in the 1990s. However, the same deteriorated significantly in 2001 and 2002. Among the developing Asian economies under study, China exhibited stable terms of trade. Moreover, after 1995, China has been able to manage better terms of trade than the Developed Economies as a whole in almost all the years under study. India’s terms of trade fluctuated in the years under study. The deterioration in 2001 and 2002 may possibly be attributed to depressed prices for exports and high prices of oil [Economic Survey (2002-2003)].
Purchasing Power Indices of Exports
Table 12 furnishes the purchasing power indices of exports for the economies under study. It is observed that in all the years under
Table 11: Terms of Trade Indices
(Terms of trade indices3 2000 = 100)
| |
1980 |
1990 |
1994 |
1995 |
1996 |
1997 |
1998 |
1999 |
2001 |
2002 |
|
World |
105 |
102 |
104 |
104 |
104 |
103 |
104 |
103 |
100 |
101 |
| |
|
|
|
|
|
|
|
|
|
|
|
Developed Economies |
97 |
103 |
105 |
105 |
104 |
103 |
105 |
105 |
101 |
102 |
| |
|
|
|
|
|
|
|
|
|
|
|
Developing Economies |
117 |
100 |
102 |
102 |
102 |
103 |
100 |
99 |
99 |
100 |
| |
|
|
|
|
|
|
|
|
|
|
|
China |
117 |
102 |
102 |
102 |
107 |
110 |
110 |
104 |
103 |
102 |
| |
|
|
|
|
|
|
|
|
|
|
|
Hong Kong SAR (China) |
100 |
100 |
100 |
99 |
100 |
100 |
102 |
101 |
101 |
102 |
| |
|
|
|
|
|
|
|
|
|
|
|
Taiwan (China) |
- |
97 |
94 |
91 |
97 |
99 |
101 |
104 |
111 |
117 |
| |
|
|
|
|
|
|
|
|
|
|
|
India |
72 |
86 |
119 |
108 |
99 |
114 |
117 |
105 |
98 |
88 |
| |
|
|
|
|
|
|
|
|
|
|
|
Indonesia |
- |
95 |
85 |
90 |
98 |
99 |
82 |
66 |
94 |
100 |
| |
|
|
|
|
|
|
|
|
|
|
|
Republic of Korea |
114 |
134 |
137 |
139 |
125 |
122 |
117 |
114 |
95 |
95 |
| |
|
|
|
|
|
|
|
|
|
|
|
Malaysia |
71 |
103 |
110 |
109 |
112 |
112 |
107 |
104 |
98 |
98 |
| |
|
|
|
|
|
|
|
|
|
|
|
Philippines |
99 |
87 |
78 |
80 |
81 |
83 |
87 |
102 |
96 |
104 |
| |
|
|
|
|
|
|
|
|
|
|
|
Singapore |
127 |
116 |
106 |
104 |
105 |
105 |
105 |
103 |
96 |
94 |
| |
|
|
|
|
|
|
|
|
|
|
|
Thailand |
152 |
119 |
120 |
117 |
114 |
115 |
109 |
107 |
91 |
90 |
| |
|
|
|
|
|
|
|
|
|
|
|
‘-’: Not available. Source: UNCTAD Handbook (2004). |
Table 12: Purchasing Power Indices of Exports(Purchasing power indices3 of exports: 2000 = 100)
| |
|
|
|
|
|
|
|
|
|
|
| |
1980 |
1990 |
1994 |
1995 |
1996 |
1997 |
1998 |
1999 |
2001 |
2002 |
|
World |
33 |
50 |
64 |
70 |
74 |
81 |
85 |
90 |
100 |
105 |
|
Developed Economies |
35 |
55 |
68 |
73 |
77 |
84 |
89 |
93 |
101 |
104 |
|
Developing Economies |
23 |
39 |
59 |
66 |
71 |
79 |
78 |
85 |
97 |
106 |
|
China |
8 |
26 |
49 |
58 |
60 |
75 |
78 |
81 |
112 |
140 |
|
Hong Kong SAR (China) |
11 |
40 |
71 |
77 |
82 |
87 |
85 |
86 |
97 |
107 |
|
Taiwan (China) |
- |
63 |
79 |
85 |
87 |
92 |
82 |
91 |
88 |
97 |
|
India |
15 |
30 |
62 |
72 |
75 |
80 |
86 |
87 |
107 |
112 |
|
Indonesia |
- |
42 |
61 |
64 |
72 |
82 |
79 |
80 |
95 |
97 |
|
Republic of Korea |
9 |
32 |
51 |
62 |
67 |
75 |
88 |
96 |
96 |
108 |
|
Malaysia |
13 |
27 |
55 |
64 |
68 |
75 |
74 |
87 |
91 |
98 |
|
Philippines |
4 |
21 |
32 |
44 |
48 |
58 |
67 |
88 |
83 |
96 |
|
Singapore |
14 |
39 |
66 |
75 |
79 |
85 |
86 |
89 |
92 |
95 |
| |
|
|
|
|
|
|
|
|
|
|
|
Thailand |
15 |
41 |
74 |
82 |
73 |
78 |
81 |
89 |
87 |
98 |
| |
|
|
|
|
|
|
|
|
|
|
|
‘-’ : Not available. Source: UNCTAD Handbook (2004). |
study except for the year 2002, exports by Developed Economies yielded higher purchasing power than that of the Developing Economies. However, purchasing power of exports of Developing Economies improved substantially after 1990 possibly because of strong growth in exports in volume terms. In contrast to a fluctuated terms of trade indices, purchasing power of exports of India increased significantly after 1990 fuelled by strong export growth in volume terms. Furthermore, the country had higher purchasing power of exports in majority of the years than many of the economies under study.
Trade Intensity Index
As stated in Section I, the trade intensity index (TII) can be used to determine whether the value of trade between two countries is greater or smaller than would be expected on the basis of their importance in world trade.
Table 13 furnishes the TII (Tij) and Table 14 furnishes the modified TII (T ij) for the Asian economies under study for their
Table 13: Trade Intensity Indices – 1990 and 2003 Trading Partner
| |
Japan |
China |
Hong |
Taiwan |
India |
Indo- |
Republic |
Mala- |
Philip- |
Singa- |
Thail- |
| |
|
|
Kong |
(China) |
|
nesia |
of |
ysia |
pines |
pore |
and |
| |
|
|
SAR |
|
|
|
Korea |
|
|
|
|
|
Exporter |
|
|
|
Trade Intensity Indices – 1990 |
|
|
|
|
| |
|
|
|
|
|
|
|
|
|
|
|
|
Japan |
- |
1.47 |
1.89 |
3.67 |
0.88 |
3.35 |
3.48 |
2.56 |
2.23 |
2.27 |
3.57 |
| |
|
|
|
|
|
|
|
|
|
|
|
|
China |
2.39 |
- |
17.96 |
0.35 |
0.41 |
1.22 |
0.39 |
0.79 |
0.83 |
1.95 |
1.53 |
| |
|
|
|
|
|
|
|
|
|
|
|
|
Hong Kong |
|
|
|
|
|
|
|
|
|
|
|
|
SAR |
0.93 |
17.08 |
- |
2.88 |
0.55 |
1.75 |
1.33 |
0.94 |
2.69 |
1.94 |
1.47 |
| |
|
|
|
|
|
|
|
|
|
|
|
|
Taiwan |
|
|
|
|
|
|
|
|
|
|
|
|
(China) |
2.09 |
2.34 |
4.66 |
- |
0.94 |
3.86 |
1.25 |
3.26 |
3.21 |
2.37 |
2.92 |
| |
|
|
|
|
|
|
|
|
|
|
|
|
India |
1.52 |
0.07 |
1.27 |
0.46 |
- |
0.99 |
0.53 |
0.94 |
0.30 |
1.05 |
1.27 |
| |
|
|
|
|
|
|
|
|
|
|
|
|
Indonesia |
6.94 |
2.24 |
1.00 |
2.26 |
0.35 |
- |
3.04 |
1.31 |
1.60 |
4.51 |
0.82 |
| |
|
|
|
|
|
|
|
|
|
|
|
|
Republic of |
|
|
|
|
|
|
|
|
|
|
|
|
Korea |
3.17 |
.. |
2.42 |
1.31 |
0.99 |
3.16 |
- |
1.45 |
1.97 |
1.69 |
1.67 |
| |
|
|
|
|
|
|
|
|
|
|
|
|
Malaysia |
2.50 |
1.45 |
1.32 |
1.48 |
2.42 |
2.22 |
2.65 |
- |
3.43 |
13.98 |
3.94 |
| |
|
|
|
|
|
|
|
|
|
|
|
|
Philippines |
3.23 |
0.52 |
1.67 |
1.74 |
0.04 |
1.42 |
1.61 |
2.07 |
- |
1.78 |
2.14 |
| |
|
|
|
|
|
|
|
|
|
|
|
|
Singapore |
1.43 |
1.05 |
2.70 |
2.46 |
3.11 |
.. |
1.27 |
17.39 |
3.26 |
- |
7.43 |
| |
|
|
|
|
|
|
|
|
|
|
|
|
Thailand |
2.81 |
0.80 |
1.87 |
0.99 |
0.41 |
1.27 |
0.98 |
3.33 |
1.85 |
4.48 |
- |
| |
|
|
|
|
|
|
|
|
|
|
|
| |
|
|
|
Trade Intensity Indices – 2003 |
|
|
|
|
| |
|
|
|
|
|
|
|
|
|
|
|
|
Japan |
- |
2.41 |
2.06 |
4.09 |
0.62 |
2.94 |
3.34 |
2.08 |
3.23 |
1.95 |
3.72 |
| |
|
|
|
|
|
|
|
|
|
|
|
|
China |
2.94 |
- |
5.69 |
1.27 |
0.93 |
1.99 |
2.08 |
1.23 |
1.20 |
1.26 |
0.96 |
| |
|
|
|
|
|
|
|
|
|
|
|
|
Hong Kong |
|
|
|
|
|
|
|
|
|
|
|
|
SAR |
1.17 |
8.47 |
- |
1.50 |
1.04 |
0.87 |
0.93 |
0.78 |
1.69 |
1.28 |
1.13 |
| |
|
|
|
|
|
|
|
|
|
|
|
|
Taiwan |
|
|
|
|
|
|
|
|
|
|
|
|
(China) |
1.69 |
5.37 |
2.89 |
- |
0.57 |
0.93 |
1.46 |
1.98 |
1.73 |
2.20 |
1.94 |
| |
|
|
|
|
|
|
|
|
|
|
|
|
India |
0.71 |
1.27 |
1.56 |
0.58 |
- |
1.94 |
0.84 |
0.88 |
0.78 |
1.35 |
1.45 |
| |
|
|
|
|
|
|
|
|
|
|
|
|
Indonesia |
4.83 |
1.24 |
0.63 |
2.26 |
3.48 |
- |
3.22 |
3.40 |
2.63 |
5.51 |
2.51 |
| |
|
|
|
|
|
|
|
|
|
|
|
|
Republic of |
|
|
|
|
|
|
|
|
|
|
|
|
Korea |
1.94 |
3.62 |
2.49 |
2.26 |
1.81 |
3.40 |
- |
1.75 |
2.62 |
1.50 |
1.44 |
| |
|
|
|
|
|
|
|
|
|
|
|
|
Malaysia |
2.32 |
1.29 |
2.11 |
2.22 |
2.95 |
3.94 |
1.32 |
- |
2.33 |
9.79 |
4.83 |
| |
|
|
|
|
|
|
|
|
|
|
|
|
Philippines |
3.45 |
1.18 |
2.79 |
4.25 |
0.34 |
1.59 |
1.65 |
5.96 |
- |
4.17 |
3.75 |
| |
|
|
|
|
|
|
|
|
|
|
|
|
Singapore |
1.46 |
1.40 |
3.27 |
2.96 |
2.62 |
.. |
1.91 |
13.87 |
3.82 |
- |
4.70 |
| |
|
|
|
|
|
|
|
|
|
|
|
|
Thailand |
3.08 |
1.41 |
1.76 |
2.01 |
0.97 |
5.60 |
0.90 |
4.23 |
3.43 |
4.54 |
- |
|
‘..’ corresponding exports data not available.
Source :Author’s calculation based on DTS (1997 & 2004) data. |
bilateral trade flows in exports in 1990 and 2003 (the column in the extreme left lists the exporting economies while the following columns list their trading partners). Any of these two tables suffices for our analysis As stated earlier, Tij and T. ij remain almost same for countries with low share in world exports. The difference is significant for countries with a large share in world exports. The same can also be observed from the values shown in Tables 13 and 14.
Table 14: Modified Trade Intensity Indices – 1990 and 2003 Trading Partner
| |
Japan |
China |
Hong |
Taiwan |
India |
Indo- |
Republic |
Mala- |
Philip- |
Singa- |
Thail- |
| |
|
|
Kong |
(China) |
|
nesia |
of |
ysia |
pines |
pore |
and |
| |
|
|
SAR |
|
|
|
Korea |
|
|
|
|
|
Exporter |
|
|
Modified Trade Intensity Indices – 1990 |
|
|
|
|
| |
|
|
|
|
|
|
|
|
|
|
|
|
Japan |
- |
1.54 |
2.07 |
4.88 |
0.88 |
4.28 |
4.53 |
3.00 |
2.52 |
2.58 |
4.69 |
| |
|
|
|
|
|
|
|
|
|
|
|
|
China |
2.45 |
- |
26.45 |
0.34 |
0.40 |
1.22 |
0.39 |
0.78 |
0.83 |
1.99 |
1.54 |
| |
|
|
|
|
|
|
|
|
|
|
|
|
Hong Kong |
|
|
|
|
|
|
|
|
|
|
|
|
SAR |
0.93 |
28.46 |
- |
3.02 |
0.55 |
1.78 |
1.34 |
0.94 |
2.80 |
1.98 |
1.49 |
| |
|
|
|
|
|
|
|
|
|
|
|
|
Taiwan |
|
|
|
|
|
|
|
|
|
|
|
|
(China) |
2.13 |
2.40 |
5.03 |
- |
0.94 |
4.09 |
1.26 |
3.42 |
3.36 |
2.44 |
3.03 |
| |
|
|
|
|
|
|
|
|
|
|
|
|
India |
1.52 |
0.07 |
1.27 |
0.46 |
- |
0.99 |
0.53 |
0.94 |
0.30 |
1.05 |
1.27 |
| |
|
|
|
|
|
|
|
|
|
|
|
|
Indonesia |
7.27 |
2.26 |
1.00 |
2.28 |
0.35 |
- |
3.09 |
1.32 |
1.61 |
4.63 |
0.82 |
| |
|
|
|
|
|
|
|
|
|
|
|
|
Republic |
|
|
|
|
|
|
|
|
|
|
|
|
of Korea |
3.31 |
.. |
2.49 |
1.32 |
0.99 |
3.30 |
- |
1.47 |
2.01 |
1.71 |
1.70 |
| |
|
|
|
|
|
|
|
|
|
|
|
|
Malaysia |
2.53 |
1.46 |
1.32 |
1.49 |
2.45 |
2.24 |
2.68 |
- |
3.50 |
15.77 |
4.05 |
| |
|
|
|
|
|
|
|
|
|
|
|
|
Philippines |
3.25 |
0.52 |
1.68 |
1.74 |
0.04 |
1.42 |
1.61 |
2.07 |
- |
1.79 |
2.14 |
| |
|
|
|
|
|
|
|
|
|
|
|
|
Singapore |
1.44 |
1.05 |
2.78 |
2.52 |
3.22 |
.. |
1.28 |
23.47 |
3.38 |
- |
8.27 |
| |
|
|
|
|
|
|
|
|
|
|
|
|
Thailand |
2.84 |
0.80 |
1.88 |
0.99 |
0.40 |
1.28 |
0.98 |
3.38 |
1.86 |
4.59 |
- |
| |
|
|
|
|
|
|
|
|
|
|
|
| |
|
|
Modified Trade Intensity Indices – 2003 |
|
|
|
|
| |
|
|
|
|
|
|
|
|
|
|
|
|
Japan |
- |
2.66 |
2.22 |
5.16 |
0.60 |
3.39 |
3.96 |
2.25 |
3.81 |
2.08 |
4.56 |
| |
|
|
|
|
|
|
|
|
|
|
|
|
China |
3.34 |
- |
8.03 |
1.29 |
0.93 |
2.12 |
2.23 |
1.25 |
1.22 |
1.28 |
0.96 |
| |
|
|
|
|
|
|
|
|
|
|
|
|
Hong Kong |
|
|
|
|
|
|
|
|
|
|
|
|
SAR |
1.18 |
11.00 |
- |
1.52 |
1.04 |
0.86 |
0.93 |
0.77 |
1.73 |
1.29 |
1.14 |
| |
|
|
|
|
|
|
|
|
|
|
|
|
Taiwan |
|
|
|
|
|
|
|
|
|
|
|
|
(China) |
1.72 |
6.03 |
3.03 |
- |
0.56 |
0.93 |
1.48 |
2.03 |
1.77 |
2.27 |
1.99 |
| |
|
|
|
|
|
|
|
|
|
|
|
|
India |
0.70 |
1.27 |
1.57 |
0.58 |
- |
1.95 |
0.84 |
0.88 |
0.78 |
1.35 |
1.45 |
| |
|
|
|
|
|
|
|
|
|
|
|
|
Indonesia |
4.99 |
1.24 |
0.63 |
2.29 |
3.56 |
- |
3.28 |
3.47 |
2.67 |
5.72 |
2.54 |
| |
|
|
|
|
|
|
|
|
|
|
|
|
Republic of |
|
|
|
|
|
|
|
|
|
|
|
|
Korea |
1.99 |
3.89 |
2.59 |
2.34 |
1.85 |
3.63 |
- |
1.79 |
2.74 |
1.52 |
1.46 |
| |
|
|
|
|
|
|
|
|
|
|
|
|
Malaysia |
2.36 |
1.29 |
2.15 |
2.26 |
3.03 |
4.11 |
1.32 |
- |
2.37 |
11.19 |
5.11 |
| |
|
|
|
|
|
|
|
|
|
|
|
|
Philippines |
3.49 |
1.18 |
2.82 |
4.32 |
0.34 |
1.59 |
1.65 |
6.11 |
- |
4.24 |
3.80 |
| |
|
|
|
|
|
|
|
|
|
|
|
|
Singapore |
1.47 |
1.41 |
3.42 |
3.08 |
2.70 |
.. |
1.94 |
18.56 |
4.04 |
- |
5.06 |
| |
|
|
|
|
|
|
|
|
|
|
|
|
Thailand |
3.15 |
1.41 |
1.77 |
2.03 |
0.97 |
5.89 |
0.90 |
4.39 |
3.52 |
4.72 |
- |
|
‘..’ corresponding exports data not available.
Source : Author’s calculation based on DTS (1997 & 2004) data. |
The bilateral trade flows of India have significantly improved as indicated by the TII (Tij as well as T ij) after 1990, although at the same time they remained below expected levels with many of the economies under study. As indicated by the TII (Tij as well as T ij), in 2003, bilateral trade flows by India with Japan, Taiwan (China), Republic of Korea, Malaysia and Philippines were smaller than expected. Bilateral trade flows of India which were above expectation level in 1990 with Japan as indicated by the TII (Tij as well as T ij) degraded to below expectation level in 2003.
On the other hand, Republic of Korea, Malaysia, and Singapore had bilateral trade flows above expectation with all the economies under study in 2003, Japan and Philippines with all but India, China with all but India and Thailand, Taiwan (China) with all but India and Indonesia, Thailand with all but India and Korea, Hong Kong SAR with all but Indonesia, Korea and Malaysia, and Indonesia with all but Hong Kong SAR.
Section IV Conclusion
A strong external sector is found in most country experiences to be the companion of a growing economy. The most striking and well-known example is the South and East Asian economies’ experience. This paper makes a comparative study of India’s export performance vis-à-vis a few important economies in the region viz. China, Hong Kong SAR (China), Taiwan (China), Indonesia, Republic of Korea, Malaysia, Philippines, Singapore and Thailand. In terms of size of the country and economy although India is much larger than most of these economies, the country does not match well with these economies so far as performance in international trade in goods is concerned. Share of India in world trade in exports as well as in imports remains very low in comparison to many of its South and East Asian neighbours under reference.
However, India has enhanced its performance in annual average growth rate in exports as well as in imports after 1990. The growth was mostly above the world average during the period under study and was above that of many other important economies under study. Furthermore, although India’s terms of trade indices fluctuated in the years under study, purchasing power of exports (representing the income terms of trade) of the country increased significantly after 1990 due to strong export growth in volume terms. Also, the country managed higher purchasing power of exports in majority of the years than many of the economies under study.
The analysis has shown that India reduced its market concentration index on products exported in 2002 in comparison to the position in 1992. India, thus, managed a less concentrated (i.e. more diversified) trade structure on products exported than many of the economies under study except the USA, China, Hong Kong SAR (China) and Indonesia. However, in imports, the country had a more concentrated (i.e. less diversified) trade structure (in terms of products imported) than most of the economies under study. A more concentrated trade structure on commodities traded carries higher risk that may arise due to possible price fluctuations. Finally, it is found that international trade in goods by India with many of the economies under study is below expected level as indicated by the trade intensity indices. Developing economies in ‘Other Asia’ account for a very low share in India’s exports as well in imports vis-à-vis the other Asian economies under study. Possibly, the country can improve its performance in international trade in goods by concentrating on higher trade with its Asian neighbours, especially in the South and the East Asian region.
Notes:
1 Other Asia (26 countries): Afghanistan, Bangladesh, Bhutan, Brunei Darussalam, Cambodia, China, Hong Kong SAR(China), India, Indonesia, Korea (Democratic People’s Republic of), Korea (Republic of), Lao People’s Democratic Republic, Macao SAR (China), Malaysia, Maldives, Mongolia, Myanmar, Nepal, Pakistan, Philippines, Singapore, Sri Lanka, Taiwan (China), Thailand, Timor-Leste, Viet Nam; [UNCTAD Handbook (2004)].
2 West Asia (14 countries): Bahrain, Iran (Islamic Republic of), Iraq, Jordan, Kuwait, Lebanon, Palestinian territory, Oman, Qatar, Saudi Arabia, Syrian Arab Republic, Turkey, United Arab Emirates, Yemen; [UNCTAD Handbook (2004)].
3 Compiled after converting the current value of exports (f.o.b.) or of imports (c.i.f.) to dollars and expressed as a percentage of the average for the base period (2000); [UNCTAD Handbook (2004)].
References
International Monetary Fund (1997): Direction of Trade Statistics Year Book, 1997.
— (2004) : Direction of Trade Statistics Year Book, 2004.
Government of India (Ministry of Finance): Economic Survey, 2002-2003. Maizels, A. : New Evidence on the North-South Terms of Trade; http:// www.southcentre.org.
United Nations (2004): United Nations Conference on Trade and Development (UNCTAD) Handbook of Statistics.
|