| I. Macroeconomic Outlook Domestic economic activity remains resilient in a slowing global economy. Inflation has persisted at elevated levels across the world and in India. Monetary policy remains focussed on progressively aligning inflation with the target. Geopolitical hostilities, volatile global financial markets and climate shocks are the key risks to the growth and the inflation outlook. I.1 Key Developments since the September 2022 MPR Since the release of the September 2022 Monetary Policy Report (MPR), the persistence of inflation at elevated levels across economies, continuing geopolitical uncertainties, and tightening financial conditions are taking their toll on global economic activity. Most central banks remain in tightening mode. Financial markets have turned volatile and highly sensitive to incoming information. Sovereign bond yields softened during November-December on hopes of a monetary policy pivot towards smaller rate hikes but hardened during February on stronger than anticipated economic activity and unrelenting price pressures. US short-term bond yields reached their highest levels in a decade and a half in early March. Equity markets recovered some lost ground. Crude oil and natural gas prices eased to their pre-war levels, but metal prices remain firm. Globally, supply conditions have improved in recent months. The banking turmoil in the US and Europe and the accompanying financial stability concerns rattled global financial markets in March. Increased risk aversion triggered flight to safety and the expectations of an early reversal of the monetary tightening cycle led to a sharp decline in sovereign bond yields across maturities, correction in equity prices and jump in market volatility indicators. The US dollar has retreated unevenly from its September 2022 highs. Domestic economic activity exhibited resilience in H2:2022-23. The National Statistical Office’s (NSO's) second advance estimates placed real gross domestic product (GDP) growth at 7.0 per cent for 2022-23, driven by private consumption and investment. Real GDP growth in Q3 was 4.4 per cent (year-on-year, y-o-y), boosted by investment demand while private consumption slowed. On the supply side, activity was supported by agriculture and services sectors, while manufacturing was restrained under the pressure of high input costs. Consumer price index (CPI) inflation persisted at elevated levels during 2022-23, impacted by a series of adverse supply shocks and the continuing pass-through of high input costs. Briefly edging into the tolerance band during November-December with the stronger than usual seasonal correction in food prices, it surged again to 6.4 per cent (y-o-y) in February as food inflation rose. The Monetary Policy Committee (MPC) increased the policy repo rate by 250 basis points (bps) during May 2022-February 2023 and monetary policy remains focussed on progressively aligning inflation with the target, while supporting growth. Monetary Policy Committee: September 2022-March 2023 When the MPC met in September 2022, CPI headline inflation was at 7.0 per cent in August. Domestic economic activity was gaining traction ahead of the festival season with double digit GDP growth in Q1:2022-23. CPI headline inflation was projected to remain above the upper tolerance level of 6 per cent through the first three quarters of 2022-231. The MPC felt that further calibrated monetary policy action was necessary to keep inflation expectations anchored, restrain the broadening of price pressures and pre-empt second round effects. Accordingly, the MPC raised the policy repo rate by 50 bps to 5.9 per cent with a 5-1 vote. One member voted for a smaller increase of 35 bps. The MPC also decided by a majority of 5-1 to remain focused on withdrawal of accommodation to ensure that inflation remains within the target going forward, while supporting growth. At the time of its December 2022 meeting2, the MPC noted that the CPI inflation print in October was persisting above the tolerance band. Real GDP registered a growth of 6.3 per cent (y-o-y) in Q2:2022-23. The MPC observed that while headline inflation was likely to moderate in H1:2023-24, it would still be well above the target. Economic activity had held up well and was expected to remain resilient. The impact of monetary policy measures undertaken needed to be monitored carefully. Against this backdrop, the MPC increased the policy repo rate by 35 bps to 6.25 per cent with a 5-1 vote and continued with its stance of withdrawal of accommodation on a 4 to 2 majority vote. In the run up to the February 2023 meeting, CPI headline inflation had eased to 5.7 per cent in December 2022, driven by strong deflation in vegetable prices even as inflationary pressures became accentuated across other food items and in the core category. Domestic economic activity was expected to be sustained by the focus on capital and infrastructure spending in the Union Budget 2023-24. Looking beyond the transitory respite in inflation due to the fall in vegetable prices, the MPC regarded inflation as a major risk to the outlook and observed that further calibrated monetary policy action was warranted to keep inflation expectations anchored, break core inflation persistence and thereby strengthen medium-term growth prospects. Accordingly, the MPC increased the policy repo rate by 25 bps to 6.50 per cent and committed to continue withdrawal of accommodation with a 4-2 vote for both the rate action and the stance decision. | Table I.1: Monetary Policy Committee Meetings and Policy Rate Voting Patterns | | Country | Policy Meetings: October 2022 - March 2023 | | Total meetings | Meetings with full consensus | Meetings without full consensus | Change in policy rate
(basis points) | | Brazil | 4 | 4 | 0 | 0 | | Chile | 3 | 3 | 0 | 50 | | Colombia | 4 | 2 | 2 | 300 | | Czech Republic | 4 | 0 | 4 | 0 | | Hungary | 5 | 5 | 0 | 0 | | India* | 3 | 0 | 3 | 110 | | Japan | 4 | 4 | 0 | 0 | | South Africa | 3 | 0 | 3 | 150 | | Sweden | 2 | 2 | 0 | 125 | | Thailand | 3 | 3 | 0 | 75 | | UK | 4 | 0 | 4 | 200 | | US | 4 | 4 | 0 | 175 | *: Including the meeting held on September 30, 2022.
Sources: Central bank websites. | The MPC’s voting pattern reflects the diversity in individual members’ assessments, expectations and policy preferences, a characteristic also reflected in voting patterns of other central banks (Table I.1). Macroeconomic Outlook Chapters II and III analyse macroeconomic developments related to inflation and economic activity during H2:2022-23 (October 2022-March 2023). The evolution of key macroeconomic and financial variables over the past six months warrants revisions in the baseline assumptions (Table I.2). | Table I.2: Baseline Assumptions for Projections | | | MPR September 2022 | MPR April 2023 | Crude Oil
(Indian basket) | US$ 105 per barrel during H2:2022-23 | US$ 85 per barrel during 2023-24 | | Exchange rate | ₹80/US$ during H2:2022-23 | ₹82/US$ during 2023-24 | | Monsoon | 6 per cent above normal for 2022-23 | Normal for 2023-24 | | Global growth | 3.2 per cent in 2022
2.9 per cent in 2023 | 2.9 per cent in 2023
3.1 per cent in 2024 | Fiscal deficit
(per cent of GDP) | To remain within BE 2022-23
Centre: 6.4
Combined: 9.3 | To remain within BE 2023-24
Centre: 5.9
Combined: 8.5 | | Domestic macroeconomic/ structural policies during the forecast period | No major change | No major change | Notes: 1. The Indian basket of crude oil represents a derived numeraire comprising sour grade (Oman and Dubai average) and sweet grade (Brent) crude oil.
2. The exchange rate path assumed here is for the purpose of generating the baseline projections and does not indicate any ‘view’ on the level of the exchange rate. The Reserve Bank is guided by the objective of containing excess volatility in the foreign exchange market and not by any specific level of and/or band around the exchange rate.
3. BE: Budget estimates.
4. Combined fiscal deficit refers to those of the Centre and States taken together.
Sources: RBI estimates; Budget documents; and IMF. | First, international crude prices eased in H2 on slowing global growth and a milder than expected winter in Europe. Geopolitical tensions and output curtailment by the Organization of the Petroleum Exporting Countries plus (OPEC plus) impart significant uncertainty to the outlook (Chart I.1.a & Chart I.1.b). Global petrol and diesel prices, which are the key determinant of domestic product prices, are elevated in view of demand-supply refinery mismatches (Chart I.1.c). Taking into account these developments, crude prices (Indian basket) are assumed at US$ 85 per barrel in the baseline as compared with US$ 105 in the September MPR baseline. Second, the nominal exchange rate of the Indian rupee or INR moved in a range of INR 81-83 per US dollar (USD) in H2. The INR was supported by a correction in the US dollar while risk-off sentiments towards emerging market economies (EME) assets and a widening current account deficit exerted downward pressures on the currency. Taking these developments into consideration, the exchange rate is assumed at INR 82 per US dollar in the baseline as against INR 80 in the September 2022 MPR. 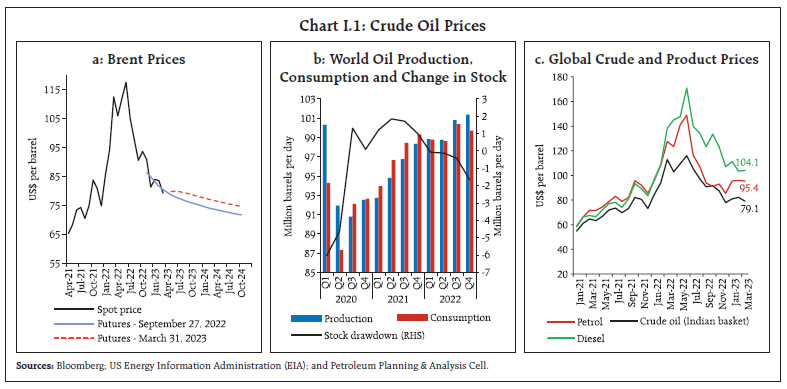
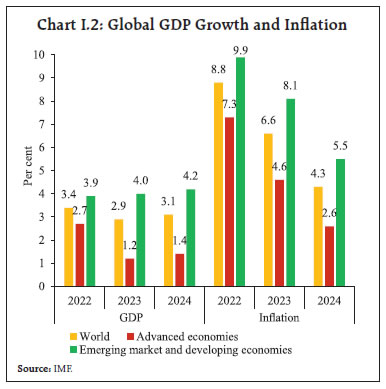 Third, while global economic prospects have improved modestly compared to a few months ago, the outlook is highly uncertain. The global composite purchasing managers index (PMI) moved into expansion mode in February after remaining in the contraction territory for six consecutive months during July 2022 - January 2023. According to the International Monetary Fund’s (IMF’s) January 2023 update of the World Economic Outlook (WEO), global growth is expected to moderate from 3.4 per cent in 2022 to 2.9 per cent in 2023, and 3.1 per cent in 2024, with a sharper deceleration projected for advanced economies (AEs) relative to emerging market and developing economies (EMDEs) (Chart I.2). Alongside, global trade is expected to decelerate in 2023. I.2 The Outlook for Inflation Adverse supply shocks and the pass-through of inputs costs to output prices imparted sustained upward pressures on CPI inflation in H2 (Chapter II). Looking ahead, the three months ahead and the one year ahead median inflation expectations of urban households fell by 30 bps each in the March 2023 round of the Reserve Bank’s survey3. The proportion of respondents expecting the general price level to increase by more than the current rate decreased for both the horizons vis-à-vis the previous round (Chart I.3). 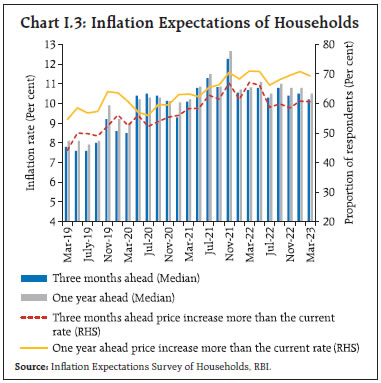 Manufacturing firms polled in the January-March 2023 round of the Reserve Bank’s industrial outlook survey expected the pace of increase in cost of raw materials to remain steady and in selling prices to moderate in Q1:2023-24 (Chart I.4a).4 Services sector and infrastructure firms expected modest softening in the growth of input cost and selling prices in Q1:2023-24 (Charts I.4b and I.4c).5 In the PMI surveys, manufacturing and services firms reported lower input cost inflation but higher output price inflation in March compared to February 2023. 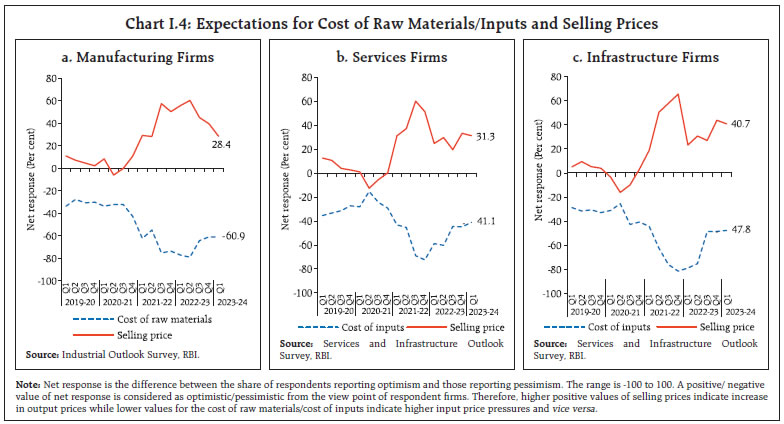 Professional forecasters surveyed by the Reserve Bank in March 2023 expected CPI inflation to moderate from 6.2 per cent in Q4:2022-23 to 5.0 per cent in Q1:2023-24, 5.3 per cent in Q2, 5.5 per cent in Q3 and 5.2 per cent in Q4 (Chart I.5a and Table I.3).6 The respondents expected CPI inflation excluding food and beverages, pan, tobacco and intoxicants, and fuel and light to move from 6.2 per cent in Q4:2022-23 to 5.4-5.6 per cent during 2023-24. Their 5- and 10-years ahead inflation expectations remained unchanged at 5.0 per cent and 4.5 per cent, respectively, in the March round (Chart I.5b). 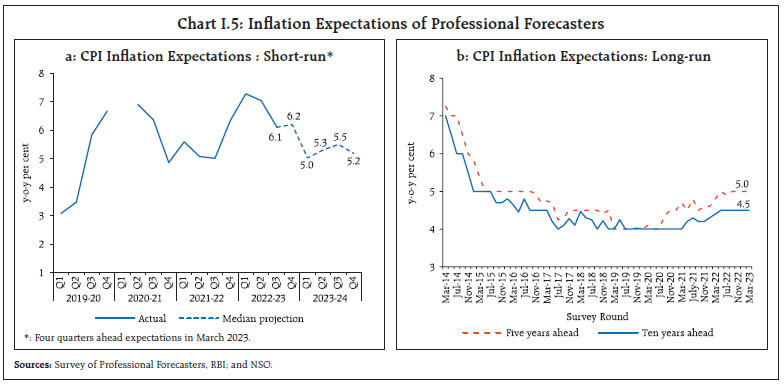
| Table I.3: Projections - Reserve Bank and Professional Forecasters | | (Per cent) | | | 2022-23 | 2023-24 | 2024-25 | | Reserve Bank’s Baseline Projections | | | | | Inflation, Q4 (y-o-y) | 6.2 | 5.2 | 4.4 | | Real GDP growth | 7.0@ | 6.5 | 6.5 | | Median Projections of Professional Forecasters | | | | | Inflation, Q4 (y-o-y) | 6.2 | 5.2 | | | Real GDP growth | 7.0 | 6.0 | | | Gross domestic saving (per cent of GNDI) | 29.2 | 29.7 | | | Gross capital formation (per cent of GDP) | 31.1 | 30.8 | | | Credit growth of scheduled commercial banks | 15.0 | 12.0 | | | Combined gross fiscal deficit (per cent of GDP) | 9.5 | 8.9 | | | Central government gross fiscal deficit (per cent of GDP) | 6.4 | 5.9 | | | Repo rate (end-period) | 6.50 | 6.75 | | | Yield on 91-days treasury bills (end-period) | 6.7 | 6.5 | | | Yield on 10-year central government securities (end-period) | 7.4 | 7.2 | | | Overall balance of payments (US$ billion) | -20.0 | 4.2 | | | Merchandise exports growth | 4.1 | -2.3 | | | Merchandise imports growth | 16.0 | -3.8 | | | Current account balance (per cent of GDP) | -2.6 | -2.0 | | Note: GNDI: Gross National Disposable Income.
@: NSO Advance estimates.
Sources: NSO; RBI staff estimates; and Survey of Professional Forecasters (March 2023). | Looking ahead, the inflation outlook will be conditioned by several factors, both global and domestic. While crude oil and commodity prices have corrected in recent months, their future trajectories remain uncertain, given the lingering geopolitical hostilities and likely demand rebound from countries reopening from pandemic-related lockdowns. Global financial markets are exhibiting volatility. Domestically, the expectations of a bumper rabi harvest augur well for the future trajectory of food inflation. On the other hand, adverse weather shocks are becoming more frequent and there is heightened uncertainty about the south-west monsoon rains. Taking into account the initial conditions, signals from forward-looking surveys and estimates from structural and other time-series models7, CPI inflation is projected to average 5.2 per cent in 2023-24 – 5.1 per cent in Q1:2023-24, 5.4 per cent in Q2 and Q3, and 5.2 per cent in Q4, with risks evenly balanced (Chart I.6). The 50 per cent and the 70 per cent confidence intervals for headline inflation in Q4:2023-24 are 3.8-6.6 per cent and 3.1-7.3 per cent, respectively. For 2024-25, assuming a normal monsoon, a progressive normalisation of supply chains, and no further exogenous or policy shocks, structural model estimates indicate that inflation will average 4.5 per cent. In Q4:2024-25, CPI inflation is projected at 4.4 per cent, with the 50 per cent and the 70 per cent confidence intervals at 3.0-5.8 per cent and 2.2-6.5 per cent, respectively. 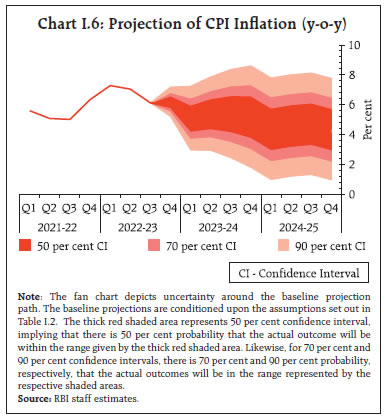 The baseline forecasts are subject to several upside and downside risks, given the volatile global environment and the cross-country experience with large deviations of inflation from forecasts (Box I.1). Upside risks emanate from possible escalation of geopolitical conflicts, higher global crude and commodity prices, accentuation of global financial market volatility amidst high inflation and financial stability concerns, renewed supply chain disruptions, extreme weather conditions and deficient monsoon, and a larger pass-through of input cost pressures to output prices as demand strengthens. Downside risks could stem from an early resolution of geopolitical tensions, correction in global crude and commodity prices due to slowing global demand, and further improvement in supply conditions. Box I.1: Inflation Forecast Accuracy Under High Volatility: Cross-Country Evidence Since the pandemic, overlapping supply and demand shocks have led to inflation surging to its highest levels since the 1970s and 1980s, with increased volatility (Chart I.1.1). This has led to large inflation forecast errors by both central banks and market forecasters (Chahad et al, 2022; Reserve Bank of Australia, 2022). The Phillips curve framework – the workhorse model for inflation forecasting – appears to have broken down in the face of large shocks and non-linearities. An analysis of inflation forecasts among a sample of eight central banks8 shows a deterioration in forecasting performance during the pandemic period. The forecast errors were higher for longer horizons and for the advanced economies. Forecast errors in India were the lowest in this cross-country comparison (Chart I.1.2). Prior to the pandemic, forecast errors were statistically not different from zero (as suggested by the statistically insignificant constant term) and hence they can be regarded as unbiased. More recent forecasts have been biased, with actual outcomes systematically overshooting forecasts significantly and more so as the horizon increases9 (Table I.1.1).
| Table I.1.1: Unbiasedness of Forecast Errors | | | 1 Quarter Ahead | 2 Quarters Ahead | 3 Quarters Ahead | 4 Quarters Ahead | Pandemic Dummy
(Q1:2021-Q4:2022) | 0.602*** | 1.850*** | 3.280*** | 4.117*** | | (0.001) | (0.000) | (0.000) | (0.000) | | Constant | -0.044 | -0.115 | -0.226 | -0.265 | | (0.667) | (0.435) | (0.197) | (0.214) | | Observations | 165 | 162 | 161 | 153 | | Country fixed effects | Yes | Yes | Yes | Yes | Note: ***, **, * denote the level of significance at 1%, 5% and 10%, respectively. p-values are in parentheses. The sample period is Q1:2017-Q4:2022.
Source: RBI staff estimates. | A dynamic panel data model estimated for a sample of seven countries covering the period Q1:2017-Q4:2022 by the Generalized Method of Moments (GMM) (Arellano and Bond, 1991) shows high persistence in forecast errors (Table I.1.2). The substantial increases in international energy and food prices, combined with currency depreciations, seem to be the key drivers of the forecast errors. Overall, the global experience suggests that forecast errors can turn sizeable in the face of large supply shocks and complicate the conduct of forward-looking monetary policy. In such a dynamic and uncertain environment, there is a need to supplement baseline forecasts with alternate scenarios and modelling approaches for more precision. | Table I.1.2: Drivers of Forecast Errors - GMM Estimates | | | 1 Quarter Ahead | 1 Quarter Ahead | 4 Quarters Ahead | 4 Quarters Ahead | | Dependent variable, lag | 0.789** | 0.748** | 1.080*** | 0.935*** | | (0.040) | (0.048) | (0.000) | (0.000) | | Energy price inflation | | 0.009 | | 0.007* | | | (0.253) | | (0.051) | | Food price inflation | | 0.061* | | 0.037** | | | (0.053) | | (0.011) | | Currency Appreciation (+)/ Depreciation (-) | | -0.041** | | -0.038** | | | (0.037) | | (0.013) | | Constant | 0.005 | -0.142 | 0.191** | -0.219 | | (0.945) | (0.247) | (0.040) | (0.118) | | Observations | 156 | 156 | 140 | 140 | | No of countries | 7 | 7 | 7 | 7 | | AR1 (p-value) | 0.0418 | 0.0481 | 0.301 | 0.151 | | AR2 (p-value) | 0.273 | 0.238 | 0.0892 | 0.117 | | Hansen-J (p-value) | 0.398 | 0.989 | 0.338 | 0.643 | Note: ***, **, * denote the level of significance at 1%, 5% and 10%, respectively. p-values are in parentheses. For n-quarter ahead forecast error, growth in exogenous regressors viz., energy prices, food prices and currency for current quarter t is calculated as {(Qt-Qt-n)/ Qt-n} *100. The sample period is Q1:2017-Q4:2022.
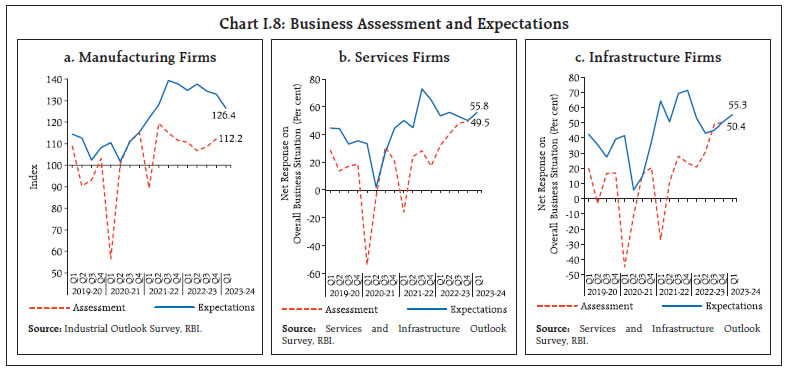
Source: RBI staff estimates. | References: Arellano, M., and S. Bond (1991), “Some Tests of Specification for Panel Data: Monte Carlo Evidence and an Application to Employment Equations”, The Review of Economic Studies, Vol. 58, No.2, April. Chahad M., A. Hofmann-Drahonsky, B. Meunier, A. Page and M.Tirpák (2022), “What Explains Recent Errors in the Inflation Projections of Eurosystem and ECB staff?”, ECB Economic Bulletin, Issue 3/2022. Reserve Bank of Australia (2022), “What Explains Recent Inflation Forecast Errors?”, Statement on Monetary Policy – November 2022. | I.3 The Outlook for Growth Domestic economic activity remains resilient, on the back of consecutive years of strong agricultural production, a post-pandemic rebound in contact-intensive services, buoyant growth in bank credit, a healthy banking and financial system10 and the government’s capex push. Slowing global growth, geopolitical tensions, upsurge in financial market volatility and tightening global financial conditions, however, weigh heavily on the outlook. Turning to the key messages from forward-looking surveys, consumer confidence (the current situation index) improved in the March 2023 survey round vis-à-vis the previous round on account of improved perceptions on general economic situation, employment and household income, though it remains in the pessimistic zone. Consumers’ expectations for the year ahead continued in the optimistic territory, albeit with some moderation (Chart I.7).11 The optimism of firms in the manufacturing sector ebbed for the quarter ahead relative to the previous round in the Reserve Bank’s industrial outlook survey (Chart I.8a). The expectations of services and infrastructure sector companies, on the other hand, improved in terms of the overall business situation (Charts I.8b and I.8c). 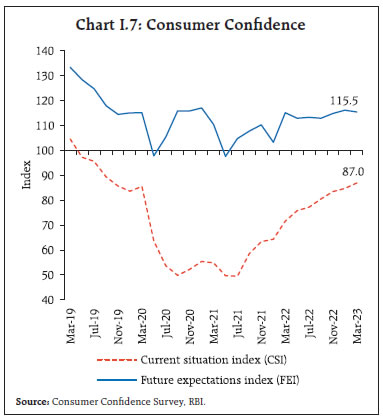
| Table I.4: Business Expectations Surveys | | Item | NCAER Business Confidence Index
(January 2023) | FICCI Overall Business Confidence Index
(January 2023) | Dun & Bradstreet Composite Business Optimism Index
(January 2023) | CII Business Confidence Index
(December 2022) | | Current level of the index | 126.6 | 61.0 | 77.3 | 67.6 | | Index as per previous survey | 132.5 | 59.9 | 83.1 | 62.2 | | % change (q-o-q) sequential | -4.5 | 1.8 | -7.0 | 8.7 | | % change (y-o-y) | 1.8 | -4.5 | -14.0 | 1.2 | Notes: 1. NCAER: National Council of Applied Economic Research.
2. FICCI: Federation of Indian Chambers of Commerce & Industry.
3. CII: Confederation of Indian Industry.
4. Dun & Bradstreet Composite Business Optimism Index is for Q4:2022-23 and data for the rest pertain to Q3:2022-23.
Sources: NCAER; FICCI; CII; and Dun & Bradstreet Information Services India Pvt. Ltd. | Recent surveys by other agencies indicate a mixed picture on business expectations relative to the previous round (Table I.4). Manufacturing and services firms in the PMI surveys for March 2023 exhibited optimism for the year ahead. Professional forecasters polled in the March 2023 round of the Reserve Bank’s survey expected real GDP growth at 4.6 per cent in Q4:2022-23, 6.7-6.0 per cent in H1:2023-24, and 5.8-5.5 per cent in H2 (Chart I.9 and Table I.3). Taking into account the baseline assumptions, survey indicators and model forecasts, real GDP growth is expected at 6.5 per cent in 2023-24 – 7.8 per cent in Q1; 6.2 per cent in Q2; 6.1 per cent in Q3; and 5.9 per cent in Q4 – with risks evenly balanced around this baseline path (Chart I.10 and Table I.3). For 2024-25, assuming a normal monsoon and no major exogenous or policy shocks, the structural model estimates indicate real GDP growth at 6.5 per cent, with quarterly growth rates in the range of 5.5-7.0 per cent. 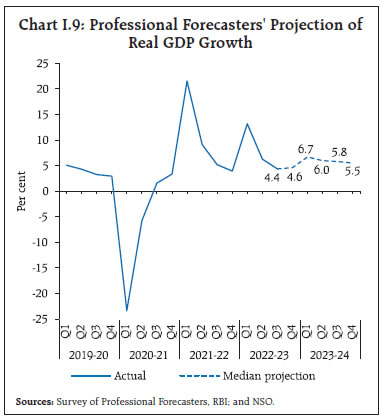 There are upside and downside risks to this baseline growth path. The upside risks emanate from a stronger-than-expected rebound in the contact-intensive services as they emerge more fully from the pandemic; a restart of private investment activity boosted by the government’s capex push, given healthier corporate balance sheets; a favourable terms of trade shock in the case of a sharper-than-anticipated correction in crude and commodity prices; a better-than-expected global growth prospects; and an early resolution of geopolitical conflicts. On the contrary, an escalation in geopolitical tensions, a further hardening of international crude oil and other commodity prices, sustained disruptions to supply chains, persistence of global financial market volatility, a sharper loss of momentum in global trade and demand and weather-related disruptions pose downside risks to the baseline growth path. I.4 Balance of Risks The baseline projections of growth and inflation in this chapter are inter alia conditional on assumptions of the future trajectory of key domestic and international macroeconomic variables set out in Table I.2. The uncertainties surrounding these assumptions have increased significantly due to protracted geopolitical tensions, upside inflation surprises globally, international financial market volatility and recurrent adverse weather events. Against this backdrop, this section explores plausible alternative scenarios to assess the balance of risks around the baseline projections. (i) Global Growth Uncertainties Global growth is slowing with significant downside risks to the baseline outlook. Globally, inflation remains the key concern and more monetary tightening may be warranted to quell it. This could, however, push global interest rates higher for longer than currently anticipated. Debt servicing costs could escalate and add to financial stability risks. Moreover, geopolitical tensions could ratchet up further. In such a scenario, if global growth is 100 bps lower than the baseline, domestic growth and inflation could be around 30 bps and 15 bps, respectively, below the baseline trajectories. Conversely, if inflation in major economies retreats quickly and global financial conditions ease, geopolitical tensions ebb and global growth surprises on the upside by turning out to be higher by 50 bps, domestic growth and inflation could edge higher by around 15 bps and 7 bps, respectively (Charts I.11a and I.12a). (ii) International Crude Oil Prices International crude oil prices have eased since the last MPR but remain volatile. A stronger rebound in global demand, production cuts by OPEC plus countries and the escalation of geopolitical hostilities could push crude oil prices higher. Crack spreads could widen further, given global demand-supply mismatches. Assuming international crude oil prices to be 10 per cent above the baseline, domestic inflation and growth could be higher by 30 bps and weaker by around 15 bps, respectively. Conversely, an early de-escalation of geopolitical tensions and subdued global demand owing to aggressive monetary policy action may lead to a moderation in global crude oil prices below the baseline. If, as a result, the Indian basket of crude prices falls by 10 per cent and assuming full pass-through to domestic product prices, inflation could ease by around 30 bps with a boost of 15 bps to growth (Charts I.11a and I.12a). (iii) Exchange Rate The INR depreciated relative to the US$ in H2:2022-23 amidst tightening global financial conditions, an uncertain global environment and portfolio outflows. The ‘higher for longer’ interest rate scenario and slowing global growth could keep risk aversion elevated and impinge upon capital flows to EMEs. Should the INR depreciate by 5 per cent below the baseline in such a scenario, inflation could edge up by around 35 bps while GDP growth could be higher by around 25 bps through the stimulus to exports. On the other hand, as India’s growth performance and outlook is relatively better than peers, it could become attractive for foreign investors. Furthermore, with the current account deficit narrowing, the INR could appreciate relative to the baseline. With five per cent appreciation, inflation and GDP growth could moderate by around 35 bps and 25 bps, respectively (Charts I.11b and I.12b). (iv) Food Inflation Heat waves, large unseasonal rains, and deviations of the monsoon from its normal pattern are occurring with greater frequency and intensity. Such adverse weather events could lead to upward pressures on food prices which could raise headline inflation by around 50 bps (Charts I.11b and I.12b). On the other hand, the prospects of a bumper rabi harvest, adequate buffer stocks, effective supply management measures by the government, and an improving global food situation could exert downward pressures on food inflation and push headline inflation 50 bps below the baseline. The baseline headline inflation path and the balance of risk are strongly conditional on the evolving weather situation and the temporal and spatial spread of the south-west monsoon rainfall. I.5 Conclusion The Indian economy is expected to be amongst the fastest growing major economies in 2023-24, backed by strong domestic drivers and strengthening macroeconomic fundamentals. The Indian financial sector remains stable. Headline inflation is expected to moderate from its prevailing elevated levels and move below the upper tolerance band during 2023-24. Monetary policy remains focused on progressively aligning inflation with the target. Geopolitical hostilities, stubborn global inflation, volatile global financial markets and climate shocks are the key risks to the growth and the inflation outlook. __________________________________________________________________________________
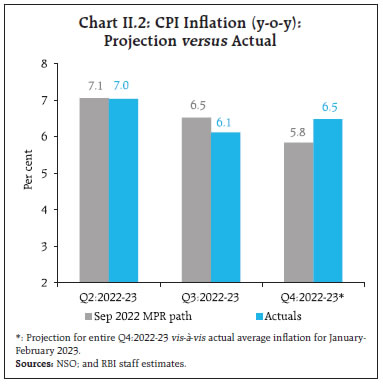
II. Prices and Costs The path of inflation in H2:2022-23 was buffeted by overlapping domestic food supply shocks which kept inflation above the upper tolerance band barring a transient softening in November-December 2022. Core inflation persisted at elevated levels in spite of input costs moderating with the softening in international commodity prices. Since the September 2022 MPR, the headline CPI inflation1 path has been impacted by domestic food supply shocks amidst weather vagaries and the pass-through of pent-up input costs. A transitory but more than anticipated seasonal correction in vegetable prices during November-December 2022 brought some relief but this reversed in January-February 2023 due to sustained price pressures from cereals and spices and a pick-up in protein-based food inflation. With improving domestic demand conditions, input costs were steadily passed on to retail prices of goods and services, imparting considerable stickiness to the already elevated core (CPI excluding food and fuel) inflation2. Reflecting these multiple shocks, headline inflation averaged 7.1 per cent (year-on-year, y-o-y) during September-October before a short-lived dip to 5.7 per cent by December. A resurgence of food price pressures pushed headline inflation to 6.5 per cent during January-February 2023. Core inflation hovered at or above 6 per cent throughout H2 (Chart II.1). The Reserve Bank of India (RBI) Act enjoins the RBI to set out deviations of actual inflation outcomes from projections, if any, and to explain the underlying reasons thereof. The September 2022 MPR had projected inflation at 6.5 per cent for Q3:2022-23 and 5.8 per cent for Q4. Actual inflation trailed the projection by 40 bps in Q3 mainly due to the sharper than expected seasonal correction in vegetables prices that also commenced earlier than usual - the month-on-month (m-o-m) decline in prices of CPI vegetables at (-) 8.3 per cent in November 2022 was the highest in the current CPI (2012=100) series for the month of November (Chart II.2). This was followed by an even larger decline in vegetable prices in December. In fact, the cumulative price decline of around 20 per cent in November-December turned out to be the highest in the current CPI series. In Q4 (January-February 2023), the situation reversed, with higher than anticipated cereal price inflation catapulting inflation by around 70 bps above projections. Forecast errors in Q4 were also attributable to the CPI aggregation methodology due to the redistribution of weights away from the freely distributed rice and wheat under the public distribution system (PDS) towards high market price cereal items3, and to the depreciation of the rupee vis-à-vis the US$ relative to the September 2022 MPR baseline assumption. 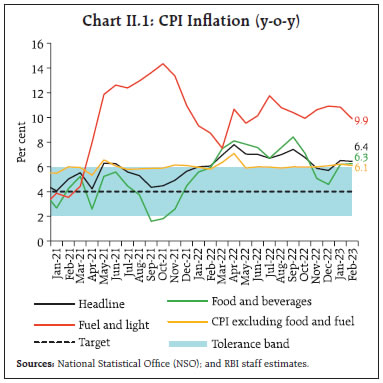
 II.1 Consumer Prices Headline inflation dynamics in H2 reflected the interplay of volatile food price momentum and base effects4. The acceleration in headline inflation to 7.4 per cent in September 2022, an increase of around 40 bps from August, came from a broad-based positive price momentum. In October, the headline inflation softened by around 60 bps to 6.8 per cent on account of strong favourable base effects across food, fuel and core categories, despite a further pick-up in the price momentum. Thereafter, headline CPI momentum registered a decline driven by lower food prices. This, along with favourable base effects, moderated headline inflation by close to 90 bps in November. A further sharp correction in headline momentum in December, despite an unfavourable base, led to a second consecutive month of softening in headline inflation. In January 2023, the positive price momentum in food and core categories and an adverse base effect pulled headline inflation up by 80 bps to 6.5 per cent. In February, the decline in food prices along with a favourable base effect led to a marginal softening in headline inflation to 6.4 per cent (Chart II.3). The distribution of CPI during 2022-23 revealed a pattern distinct from the previous year. The mean of the distribution rose to 6.8 per cent in 2022-23 (April-February) from 5.5 per cent during 2021-22 while lower standard deviation and a lower positive skew pointed towards the generalisation of inflation pressures in the CPI basket (Chart II.4 and II.5). The broad-basing of price pressures was also visible in CPI diffusion indices (DIs)5, which increased during September 2022 to January 2023, driven by CPI goods, with some moderation in February (Chart II.6a). The threshold DI6 for price increases remained in excess of 6 per cent on a seasonally adjusted annualised rate (saar) basis on an average during the last six months (Chart II.6b).
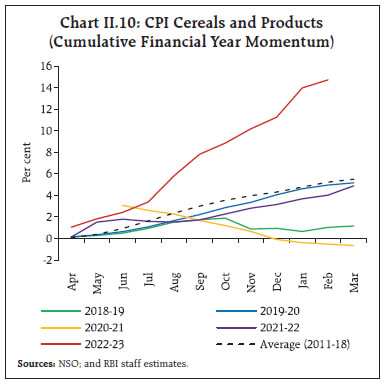
II.2 Drivers of Inflation A historical decomposition of inflation using a vector autoregression (VAR)7 model indicates that supply shocks drove the inflation trajectory in H2, while monetary actions and aggregate demand conditions exerted downward pressure (Chart II.7a). An analysis of supply-side cost-push shocks suggests that while direct effects dominate in terms of their impact on headline CPI, indirect effects can also be significant (Box II.1). Box II.1: Domestic Cost-push Price Shocks and CPI Inflation: An Assessment using Input-Output Tables Elevated inflation and its persistence reflect a series of multiple supply side shocks. It has been observed that as the direct impact of the shocks wane, second-round effects can take hold, causing generalisation of price pressures. Moreover, some sectors are systemically more important than others in this propagation mechanism (Weber et al., 2022). Direct and indirect effect of domestic cost-push shocks to various sectors of the economy can be analysed by using input-output tables (IOTs)8. The IOTs are mapped to CPI items/sub-groups to understand the total impact in the CPI basket from a shock to each of the sectors. The impact of the sectoral shocks on headline inflation is estimated by using the Leontief Inverse Matrix (RBI, 2022), i.e., where L is the Leontief inverse, I is an identity matrix of dimension (J*K x J*K), A is the technical coefficient matrix derived from the IOTs and J and K are the total number of economies and industries. 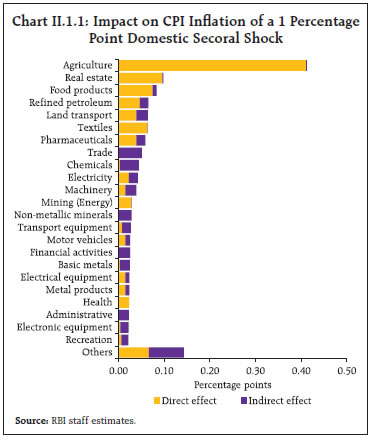 The empirical analysis shows that a 1 percentage point shock to each of the sectors can raise CPI inflation by 1.46 percentage points, with an indirect impact of 46 basis points. Sector-wise, shocks to agriculture have the maximum impact (41 bps) on headline inflation, followed by real estate (10 bps), food products (8 bps) and refined petroleum (7 bps) (Chart II.1.1). Direct effects, which depend on the size of the shock and weights of CPI items, dominate. The indirect effects on CPI inflation are relatively sizeable in the case of shocks to sectors like trade, chemicals, non-metallic minerals and financial activities, although these sectors have no direct impact as they are not part of the CPI basket. Sectors like refined petroleum, land transport, pharmaceuticals and electricity have both direct and indirect effects on CPI inflation. These findings can inform supply responses to recent inflation pressures. References: OECD (2021), Inter-Country Input-Output Tables. RBI (2022), “Global Cost-Push Spillovers on Inflation: Insights from World Input-Output Tables”, Box I.2, Monetary Policy Report, September. Weber, I. M., Jauregui, J. L., Teixeira, L., & Nassif Pires, L. (2022), “Inflation in Times of Overlapping Emergencies: Systemically Significant Prices from an Input-output Perspective”, University of Massachusetts, Economic Department Working Paper Series 340. | The contribution of goods (with a weight of 76.6 per cent in overall CPI) to headline inflation averaged 81 per cent during September 2022-February 2023 while that of services (weight of 23.4 per cent) averaged 19 per cent. (Chart II.7b). Within goods, semi-perishable goods (non-durable goods with a 30-day recall9), particularly petroleum products (like kerosene, LPG and firewood and chips) and cereals, personal care items and medicines as well as durables (goods with a 365-day recall) like clothing and footwear items, motor cycle/scooter and gold were the main drivers. The contribution of perishable goods to overall inflation halved to 19 per cent in February 2023 from 38 per cent in September 2022. The increase in global commodity prices following the Ukraine conflict contributed to a surge in the contribution of imported components10 during March-June 2022. Subsequently, with the decline in international commodity prices, the contribution of imported inflation moderated – it turned negative during November 2022-February 2023, driven down by the y-o-y fall in in prices of edible oils, LPG, electronic goods parts, polymer, petrol and diesel (Chart II.7c). CPI Food Group Inflation in food and beverages (weight of 45.9 per cent in the CPI basket) moderated from 8.4 per cent in September 2022 to 4.6 per cent in December, on the back of sharp correction in vegetable prices alluded to earlier. It, however, rose again to 6.3 per cent by February 2023, as increases in prices of cereals and products, milk and spices outweighed the seasonal easing in vegetables prices. Lower rabi production of wheat and spices, lower kharif production of rice, higher fodder and feed costs, and a decline in wheat buffer stocks led to the hardening of prices of cereals, milk and spices (Chart II.8). Excluding vegetables, CPI food inflation rose from 7.0 per cent during September-October 2022 to 9.0 per cent in February. While the overall food price build-up in 2022-23 was lower than the historical experience, the build-ups in respect of five of the twelve sub-groups – cereals; eggs; spices; milk; and prepared meals – were higher than their long-term averages (Chart II.9). Inflation in cereals (weight of 9.7 per cent in the CPI and 21.1 per cent in the food and beverages group) increased from less than 10 per cent in August 2022 to 16.7 per cent in February 2023, the highest in the current CPI series (Chart II.10). Wheat and rice were the primary drivers, recording double digit inflation since June and October 2022, respectively. Wheat prices hardened on the back of lower domestic production [(-) 1.7 per cent in 2021-22] due to the heat wave in major wheat producing states, the dip in stocks and elevated global prices due to the conflict in Ukraine. The release of a cumulative 3.4 million tonnes of wheat in the open market by the Government, at a lower reserve price, along with the higher estimated rabi production in 2022-23 (an increase of 4.1 per cent), has led to a gradual ebbing of price pressures. The Government continued with restrictions on wheat exports since May 2022 and banning of exports of wheat flour from August 25, 2022 to improve domestic supplies and ease price pressures. Inflation in rice remained elevated due to decline in kharif production ((-) 2.6 per cent) in 2022-23. Further, exports also registered higher volumes (6.5 per cent y-o-y during April 2022-January 2023). 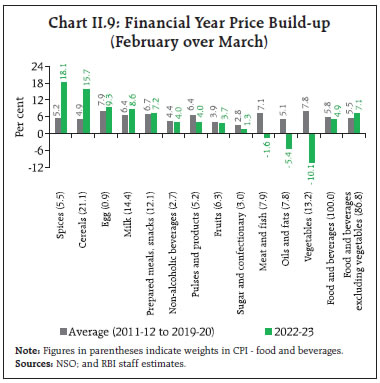
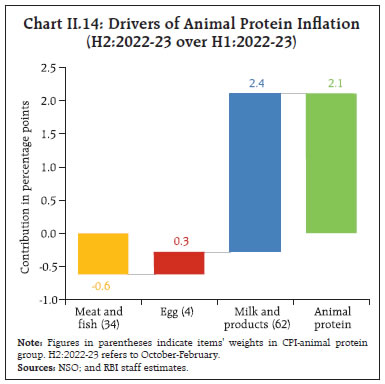
 Inflation in vegetables prices (weight of 6.0 per cent in the CPI and 13.2 per cent in the food and beverages group) remained volatile during 2022-23. It moderated from a high of 18.2 per cent in September 2022 and entered into deflation in November on the back of an early onset of seasonal easing of price pressures, reaching (-)11.6 per cent in February 2023. Onion prices remained in deflation throughout 2022-23 on account of higher production in 2021-22 (an increase of 17.4 per cent), record procurement (buffer stock of 2.5 lakh metric tonnes in 2022-23) and better rabi crop prospects. Potato price inflation, however, generally remained high during the year on lower production in 2021-22 ((-) 5.0 per cent). With stock releases from cold storages and arrivals of the kharif crop, prices declined from November 2022 as per the seasonal pattern, leading inflation to turn negative in February 2023. Imports of potatoes from Bhutan till June 2023, without the need for any import license, also reined in price pressures. Tomato prices exhibited high volatility due to a setback to production from heat wave in major producing states, cyclone Asani in Andhra Pradesh and excess/unseasonal rains. Prices fell from November as per the seasonal pattern and on expectations of good production owing to increased sown area (Chart II.11). 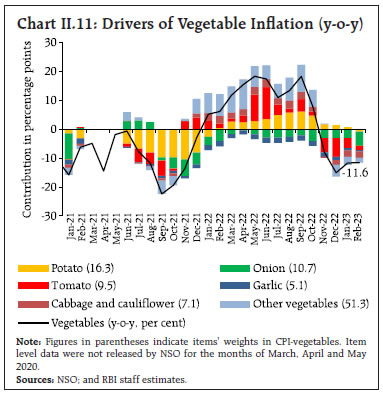 Inflation in prices of fruits (weight of 2.9 per cent in the CPI and 6.3 per cent within the food and beverages group) was relatively subdued, averaging 4.5 per cent in 2022-23 (April-February). While prices of apples and coconuts (barring February) recorded deflation throughout, inflation in banana, oranges, papaya and other fresh fruits remained elevated. Inflation in prices of pulses (weight of 2.4 per cent in the CPI and 5.2 per cent in the food and beverages group), the primary source of plant-based protein, rose from 2.6 per cent in August 2022 to 4.1 per cent in February, driven by tur and urad on a decline in kharif production in 2022-23 (by 13.1 per cent and 1.0 per cent, respectively) (Chart II.12). To augment supplies and contain price pressures, the Government extended the period for free import of tur and urad to March 2024, increased the procurement ceiling under the Price Support Scheme (PSS) from 25 per cent to 40 per cent for tur, urad and masoor and allowed disposal of chana to states at a discounted price under the PSS. Government has stepped up monitoring of stock disclosures and futures trading in chana has been banned. On the whole, record pulses production during 2022-23 at 278 lakh tonnes and a higher stock-to-use (STU) ratio augur well for domestic availability and effective price management (Chart II.13). Inflation in animal-based protein items increased sharply in H2:2022-23 (October-February), driven mainly by milk and products (weight of 6.6 per cent in the CPI and 14.4 per cent within the food and beverages group) (Chart II.14). Major milk co-operatives like Amul and Mother Dairy raised retail prices by ₹2-3 per litre in two and three spells since September 2022, respectively, followed by other state cooperatives, attributed to increase in feedstock costs. Inflation in prices of eggs increased during November 2022-January 2023 due to high feed cost and a spurt in exports to Malaysia before easing to 4.3 per cent in February 2023. After remaining muted during July-November 2022, inflation in meat and fish (weight of 3.6 per cent in CPI and 7.9 per cent within the food and beverages group) increased to 6.0 per cent in January 2023 before moderating sharply in February 2023 due to a correction in prices as well as a favourable base effect. 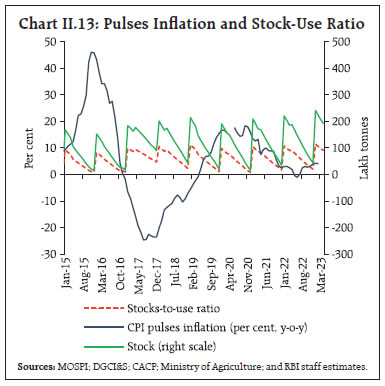
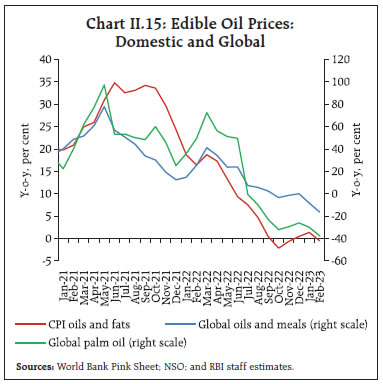 Inflation in prices of oils and fats (weight of 3.6 per cent in the CPI and 7.8 per cent within the food and beverages group), which was elevated in the initial months of 2022-23 due to increase in global prices in the aftermath of the conflict in Ukraine and an export ban on palm oil by Indonesia, eased considerably to (-)0.5 per cent in February 2023 (Chart II.15). This moderation was supported by easing global prices, supply-side measures by the Government (extension of reduction in basic customs duty on crude and refined oils and imposition of stock limits on edible oil and oil seeds) and higher estimated domestic production of oilseeds in 2022-23 (5.4 per cent). Inflation in prices of sugar and confectionery (weight of 1.4 per cent in the CPI and 3.0 per cent in the food and beverages group) moderated sharply in September 2022 and remained muted in the subsequent months on the back of higher domestic production and export restrictions on sugar, effective from June 1, 2022 which was extended till October 2023 to ensure ample domestic supplies. Among other food items, inflation in prices of spices averaged 16.0 per cent during April 2022-February 2023, reflecting production shortfalls in key spices, especially dry chillies, cumin and coriander in 2021-22. Prepared meals prices rose due to the gradual pass-through of past increases in input costs from edible oils, LPG and transport costs. Retail Margins Retail price margins – the difference of retail and wholesale prices11 – for cereals and pulses remained elevated during 2022-23. Retail margins rose for edible oils as decline in retail prices (groundnut, soyabean, sunflower and mustard oil) was less than that in wholesale prices. Margins picked up in September-November 2022 in the case of vegetables, driven by all the three constituents, i.e., potatoes, tomatoes and onions. Subsequently, there was a sharp seasonal correction in prices and margins (Chart II.16). CPI Fuel Group CPI fuel inflation during September 2022 to February 2023 was high and sticky in a range of 9.9 per cent to 10.9 per cent. While domestic LPG prices remained unchanged till February 2023, kerosene (PDS) prices fell after July 2022 in line with international prices. Kerosene prices inflation moderated from around 60 per cent in September 2022 to 30 per cent by February 2023. Electricity prices, on the other hand, moved out of deflation in November 2022 and have remained largely steady since then. Firewood and chips inflation pressures rose during Q3 before moderating in February (Chart II.17). Core CPI (CPI excluding Food and Fuel) Core inflation (CPI inflation excluding food and fuel) exhibited stickiness at or above 6 per cent in H2. Elevated inflation pressures were visible across all exclusion-based measures of core inflation (Table II.1). In 2020-21, high core inflation was due to price pressures in select categories like transport and communication, and personal care and effects. Since 2021-22, however, it has become increasingly generalised and persistent (Chart II.18). During 2022-23 (April-February), core inflation averaged 6.1 per cent vis-à-vis 6.0 per cent in 2021-22. Between 2021-22 and 2022-23, the contribution of transport and communication, and health to overall core inflation saw a decline, but that of clothing and footwear edged up sharply along with an uptick in the contributions of household goods and services, personal care and effects, and education. The contribution of core services increased during 2022-23 while that of core goods fell (Chart II.19). | Table II.1: Exclusion-based Measures of CPI Inflation (y-o-y) | | Month | CPI excluding food and fuel (47.3) | CPI excluding food, fuel, petrol and diesel (45.0) | CPI excluding food, fuel, petrol, diesel, gold and silver (43.8) | | Mar-22 | 6.4 | 6.2 | 6.1 | | Apr-22 | 7.1 | 6.5 | 6.4 | | May-22 | 5.9 | 5.5 | 5.5 | | Jun-22 | 6.0 | 6.1 | 6.1 | | Jul-22 | 6.0 | 6.3 | 6.4 | | Aug-22 | 5.9 | 6.2 | 6.2 | | Sep-22 | 6.0 | 6.3 | 6.4 | | Oct-22 | 6.0 | 6.5 | 6.5 | | Nov-22 | 6.0 | 6.3 | 6.4 | | Dec-22 | 6.1 | 6.3 | 6.3 | | Jan-23 | 6.2 | 6.5 | 6.3 | | Feb-23 | 6.1 | 6.4 | 6.2 | Note: (1) Figures in parentheses indicate weights in CPI.
(2) Derived as residual from headline CPI.
Sources: NSO; and RBI staff estimates. |
Retail selling prices of petrol and diesel remained unchanged during September 2022 to February 2023 (Chart II.20). Petrol and diesel prices moved into deflation on a y-o-y basis during August-November 2022 and stood at 0.9 per cent in February, resulting in a significant drop in transport and communication inflation and its contribution to CPI core inflation (Chart II.21). On the other hand, gold prices firmed up y-o-y, resulting in an increase in personal care and effects inflation and its contribution to core inflation.
Threshold diffusion indices for CPI excluding food, fuel, petrol, diesel, gold and silver indicate a high number of items registering price increases in excess of 4 per cent during September-October 2022. Since November 2022, the diffusion index for items registering price increases in excess of 6 per cent (saar) has moved lower, suggesting easing in the intensity of price increases (Chart II.22). A decomposition of CPI excluding food, fuel, petrol, diesel, gold and silver inflation into its goods (with a weight of 20.7 per cent in the headline CPI) and services (weight of 23.0 per cent) components shows that goods inflation averaged 7.4 per cent during September 2022 to February 2023, higher than services inflation of around 5.4 per cent. The key drivers of goods inflation were clothing and footwear, household goods and services, and health (Chart II.23a). In services inflation, housing (primarily house rental charges) was the largest contributor, followed by transport services (bus/tram/taxi fares; air fare), and education (tuition and other fees) (Chart II.23b).
Trimmed mean measures12 also indicated elevated underlying inflation pressures, with the weighted median inflation rate at 6.8 per cent during December 2022-February 2023 (Table II.2). Other Measures of Inflation CPI inflation for agricultural labourers (CPI-AL) and rural labourers (CPI-RL) exceeded CPI headline inflation during September 2022 - February 2023, primarily on account of food inflation being higher in CPI-AL and CPI-RL. Inflation in terms of CPI for industrial workers (CPI-IW), on the other hand, was below the headline CPI during the same period due to lower inflation in food, clothing and footwear, housing as well as the miscellaneous categories in CPI-IW vis-à-vis headline CPI. After ruling in double digits between April 2021 and September 2022, wholesale price index (WPI) inflation moderated to 3.9 per cent in February 2023 on the back of a fall in international commodity prices and favourable base effects. The sharp moderation in WPI inflation pulled down inflation measured by the deflators for gross value added (GVA) and gross domestic product (GDP) in Q3:2022-23 (Chart II.24a). | Table II.2: Trimmed Mean Measures of CPI Inflation (y-o-y) | | Month | 5% trimmed | 10% trimmed | 25% trimmed | Weighted Median | | Mar-22 | 6.6 | 6.3 | 6.1 | 6.1 | | Apr-22 | 7.3 | 7.0 | 6.6 | 6.5 | | May-22 | 6.4 | 6.1 | 5.5 | 5.7 | | Jun-22 | 6.2 | 6.0 | 5.7 | 5.7 | | Jul-22 | 6.1 | 6.0 | 5.7 | 5.7 | | Aug-22 | 6.6 | 6.4 | 6.1 | 6.5 | | Sep-22 | 6.9 | 6.6 | 6.5 | 6.7 | | Oct-22 | 6.8 | 6.6 | 6.6 | 6.6 | | Nov-22 | 6.5 | 6.5 | 6.5 | 6.6 | | Dec-22 | 6.5 | 6.5 | 6.5 | 6.9 | | Jan-23 | 6.6 | 6.6 | 6.6 | 6.8 | | Feb-23 | 6.6 | 6.5 | 6.5 | 6.6 | | Sources: NSO; and RBI staff estimates. |
While WPI inflation outpaced CPI inflation in the aftermath of COVID-19 pandemic and the conflict in Ukraine, it moved below CPI inflation since December 2022. During September 2022-February 2023, CPI inflation ruled above the corresponding WPI groups/sub-groups in respect of spices, fruits, protein-based goods (pulses, egg and milk), and clothing and footwear. Deflation in edible oil and vegetable prices was higher in the WPI than in the CPI. On the other hand, inflation in fuel, petrol and diesel was higher in the former vis-à-vis the latter (Chart II.24b)13. II.3 Costs Costs, as measured by WPI inflation relating to industrial raw materials and farm inputs prices, moderated gradually during H2:2022-23 (Chart II.25). Inflation in the prices of industrial inputs – such as high-speed diesel (HSD); naphtha; aviation turbine fuel (ATF); bitumen; and furnace oil – eased, mirroring the correction in international crude oil prices. The prices of non-food primary articles, particularly raw cotton and oilseeds softened in tandem with international prices and expectations of higher domestic production. Minerals price inflation moderated and turned to deflation from November 2022, driven by deflation in iron ore prices, and in copper concentrate prices from January 2023. Notwithstanding the easing in HSD prices, farm input price inflation remained elevated on account of high fodder price inflation. Inflation in price of WPI electricity – a key input in both industrial and farm inputs – persisted at elevated levels, reflecting higher input costs on the back of firmer international coal prices and increased domestic demand. 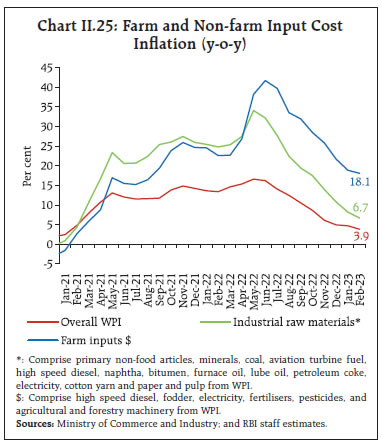 Nominal rural wage growth for both agricultural and non-agricultural labourers increased during October 2022-January 2023. While agricultural wage growth was broad-based across all occupations, the growth in non-agricultural wages was mainly driven by categories like beedi makers, blacksmiths, masons, electricians, and light motor vehicle (LMV)/tractor drivers (Chart II.26). In the organised sector, growth in overall staff cost (y-o-y basis) accelerated in Q3:2022-23 for both manufacturing and services sectors. The share of staff cost in the value of production for both manufacturing and services was broadly unchanged in Q3:2022-23 from its level in Q2:2022-23 (Chart II.27). As per the firms polled in the Reserve Bank’s enterprise surveys14, the pace of salary outgoes for the manufacturing, infrastructure and services sectors is expected to remain broadly stable in Q1:2023-24. Input cost pressures are likely to ease in Q1:2023-24 and the pace of increase in selling prices is also expected to edge down for all the three sectors in Q1:2023-24 (Chart II.28). One year ahead business inflation expectations15 that had risen in January 2023, edged down during February 2023 reflecting moderation in cost pressures.
As per manufacturing firms polled for the purchasing managers’ index (PMI), input prices picked up during December-February and output prices in general moderated with the input-output price gap returning to positive territory by February. The month of March saw a reversal in this trend with the gap again turning negative as input prices fell (Chart II.29a). In PMI services, input as well as output prices momentum softened during December-February and the input-output price gap has been largely range-bound since August 2022. There was an uptick in prices charged in the month of March with softening in input prices, leading to narrowing of input output price gap (Chart II.29b). II.4 Conclusion A combination of adverse supply-side shocks and the pass-through of pending input costs to output prices exerted sustained pressures on headline inflation during 2022-23. The outlook for 2023-24 is subject to uncertainties surrounding climate-related disturbances such as heat wave and unseasonal rains. Moreover, a resurgence in geopolitical tensions could lead to supply chain dislocations and commodity price pressures; per contra, an earlier resolution of geopolitical hostilities can soften price pressures. Global demand conditions are turning more uncertain amidst rising financial market turbulence and financial stability concerns, which could weigh in on commodity prices. Amidst these elevated uncertainties, monetary policy remains focussed on progressively aligning inflation with the target. Pro-active supply measures by the Government remain vital to address bottlenecks and shortages in critical areas to mitigate volatility in inflation and enable a sustained disinflation. __________________________________________________________________________________
III. Demand and Output Domestic demand remained resilient in H2:2022-23, with investment activity gaining ground but private consumption exhibiting sluggishness. On the supply side, a rebound in contact-intensive services compensated for manufacturing sector which was pulled down by elevated input cost pressures. Protracted geopolitical tensions, tighter global financial conditions, global financial market volatility and slowing external demand pose risks to the outlook. Domestic demand remained resilient in H2:2022-23, with investment activity gaining ground on the back of the government’s continued thrust on capex. Private consumption exhibited sluggishness with normalisation of the pandemic induced pent-up demand and the dampening effect of inflationary pressures. Slowing global demand weighed on merchandise exports; however, with imports declining, the drag from net exports moderated. Overall, real gross domestic product (GDP) rose by 4.8 per cent in H2:2022-23, up by 12.3 per cent over its pre-pandemic level. On the supply side, the rebound in contact-intensive services was sustained. The manufacturing sector was pulled down by elevated input cost pressures. Spillovers from protracted geopolitical tensions, tighter global financial conditions, global financial market volatility and slowing external demand pose risks to the outlook. III.1 Aggregate Demand Aggregate demand, measured by real GDP, expanded by 4.4 per cent (year-on-year, y-o-y) in Q3:2022-23 and by an estimated 5.1 per cent in Q4 (Chart III.1 and Table III.1). The momentum – the quarter-on-quarter (q-o-q) seasonally adjusted annualised growth rate (saar) – remained strong in Q3 and Q4. For the financial year 2022-23 as a whole, real GDP rose by 7.0 per cent on top of 9.1 per cent in the preceding year. India remained the fastest growing major economy in 2022-23 reflecting dominant role of domestic drivers in the growth process (Box III.1). 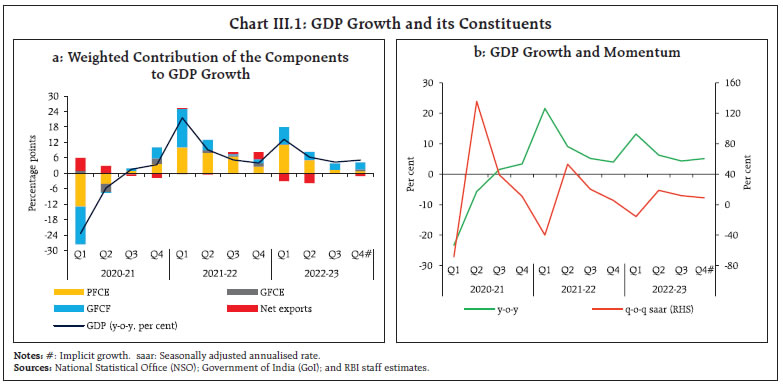
| Table III.1: Real GDP Growth | | (y-o-y, per cent) | | Item | 2021-22 | 2022-23 | Weighted Contribution* | 2021-22 | 2022-23 | | (FRE) | (SAE) | 2021-22 | 2022-23 | Q1 | Q2 | Q3 | Q4 | Q1 | Q2 | Q3 | Q4# | | Private final consumption expenditure | 11.2 | 7.3 | 6.4 | 4.3 | 17.6 | 14.2 | 10.8 | 4.7 | 20.0 | 8.8 | 2.1 | 1.5 | | | (5.4) | (13.2) | | | (-9.3) | (5.9) | (12.6) | (11.8) | (8.9) | (15.2) | (14.9) | (13.4) | | Government final consumption expenditure | 6.6 | 1.2 | 0.7 | 0.1 | -2.1 | 11.7 | 5.8 | 11.8 | 1.8 | -4.1 | -0.8 | 6.1 | | | (5.6) | (6.9) | | | (6.3) | (-17.6) | (0.9) | (38.0) | (8.3) | (-20.9) | (0.0) | (46.4) | | Gross fixed capital formation | 14.6 | 11.2 | 4.6 | 3.7 | 61.0 | 12.4 | 1.2 | 4.9 | 20.6 | 9.7 | 8.3 | 7.8 | | | (6.2) | (18.1) | | | (-9.6) | (11.1) | (4.3) | (19.6) | (9.0) | (21.9) | (12.9) | (29.0) | | Exports | 29.3 | 11.5 | 5.5 | 2.5 | 46.1 | 25.1 | 27.8 | 22.4 | 19.7 | 12.3 | 11.3 | 3.9 | | | (17.5) | (31.0) | | | (8.8) | (17.2) | (16.8) | (27.1) | (30.2) | (31.7) | (30.1) | (32.0) | | Imports | 21.8 | 18.8 | 4.6 | 4.4 | 44.8 | 26.6 | 19.7 | 6.7 | 33.7 | 25.9 | 10.9 | 8.4 | | | (5.2) | (25.0) | | | (-14.6) | (4.2) | (13.6) | (19.5) | (14.1) | (31.2) | (25.9) | (29.5) | | GDP at market prices | 9.1 | 7.0 | 9.1 | 7.0 | 21.6 | 9.1 | 5.2 | 4.0 | 13.2 | 6.3 | 4.4 | 5.1 | | | (2.7) | (9.9) | | | (-6.9) | (2.9) | (6.9) | (7.5) | (5.4) | (9.3) | (11.5) | (13.0) | Notes: *: Component-wise contributions do not add up to GDP growth because change in stocks, valuables and discrepancies are not included.
Figures in parentheses are growth rates over 2019-20. FRE: First revised estimates; SAE: Second advance estimates. #: Implicit.
Source: NSO. |
Box III.1: External Shocks and India’s GDP Growth To explore the dynamics of global spillovers on domestic economic activity, a structural vector auto regression (SVAR) is estimated with external and domestic variables in the following order – global variables (GDP growth, CPI inflation and financial conditions); domestic GDP growth; domestic inflation (GDP deflator); and the short-term interest rate (weighted average call money rate (WACMR)) adjusted for inflation1. Quarterly data from Q1:1997-98 to Q3:2022-23 have been used in the estimation. The SVAR contains two lags based on the Schwarz information criterion (SIC).
The impulse responses indicate that a one standard deviation negative shock to global GDP growth (around 3.5 percentage points) reduces domestic growth by over 2 percentage points with a lag of a quarter (Chart III.1.1). The variance decomposition suggests that global factors explain only 17-18 per cent of the variability in India’s GDP growth, reflecting dominance of domestic growth drivers (Chart III.1.2). References: International Monetary Fund, (2014), “On the Receiving End? External Conditions and Emerging Market Growth Before, During, And After the Global Financial Crisis”, World Economic Outlook, April. World Bank Group, (2015), “Slowdown in Emerging Markets: Rough Patch or Prolonged Weakness?”, Policy Research Note, December. | GDP Projections versus Actual Outcomes The September 2022 Monetary Policy Report (MPR) projected real GDP growth at 6.3 per cent for Q2:2022-23, and 4.6 per cent each for Q3 and Q4. The actual growth rate at 6.3 per cent in Q2 turned out to be in line with the projection (Chart III.2). In Q3, the outturn undershot the projection by 20 basis points (bps) due to lower than expected growth in private consumption and government expenditure. Data for Q4:2022-23 are scheduled to be released by the NSO on May 31, 2023. III.1.1 Private Final Consumption Expenditure Growth in private final consumption expenditure (PFCE) – the mainstay of aggregate demand – decelerated from an above trend pace of 20.0 per cent in Q1:2022-23 to 8.8 per cent in Q2 and 2.1 per cent in Q3 due to the ebbing pandemic-related pent-up demand and high inflation. Amongst the high frequency indicators (HFIs) of urban demand, domestic air passenger traffic witnessed a sustained pick up from August 2022 and surpassed its pre-pandemic level in December 2022-February 2023 (Chart III.3). Passenger vehicle sales and household credit posted robust growth in H2. Consumer durables, on the other hand, contracted in Q3 and January 2023, partly reflecting a shift in households spending from goods to services with the receding pandemic. Rural demand showed some signs of recovery in H2, albeit it is lagging urban demand. Amongst the HFIs, tractor sales grew robustly in H2 while motorcycle sales growth returned to positive territory in January-February 2023 after a marginal contraction in December 2022. Consumer non-durables output expanded for the third consecutive month in January 2023, following a decline during July-October (Chart III.4). The demand for work under the Mahatma Gandhi National Rural Employment Guarantee Act (MGNREGA) moderated in Q3 and Q4 in tandem with the improving rural job market on the back of higher rabi sowing and recovery in informal sector employment. The labour force participation rate, as per the Centre for Monitoring Indian Economy’s (CMIE) Consumer Pyramid data, remained unchanged in Q4 and the unemployment rate moved lower across both urban and rural segments (Chart III.5a). Organised sector employment, as reflected in the Employees’ Provident Fund Organisation (EPFO) payrolls data, strengthened considerably in Q3 and in January 2023 as compared with the same period last year (Chart III.5b). According to Naukri Jobspeak data, increased hiring was witnessed in insurance, hospitality, banking, financial services and real estate sectors.
III.1.2 Gross Fixed Capital Formation Gross fixed capital formation (GFCF) posted a growth of 8.3 per cent in Q3:2022-23 on top of 14.8 per cent growth in H1. Its share in GDP rose to 31.8 per cent in Q3 from 30.6 per cent a year ago. Construction activity gathered steam post-monsoon on the back of housing demand and the government’s thrust on infrastructure spending. Cement production and steel consumption – indicators of fixed investment – grew strongly in Q3 and Q4. In the case of investment in machinery and equipment, production of capital goods stayed resilient in Q3 and January 2023; imports of capital goods were buoyant in Q3 and the pace of expansion decelerated during January-February 2023 (Chart III.6). According to the RBI’s survey2, capacity utilisation (CU) in the manufacturing sector improved marginally to 74.3 per cent in Q3:2022-23 from 74.0 per cent in the previous quarter. The seasonally adjusted CU, however, dropped to 74.1 per cent from 74.5 per cent over the period, although it remained above its long-period average (Chart III.7). The Union Budget 2023-24 has projected a growth of 37.4 per cent in capital expenditure over its revised estimates for 2022-23 and this is expected to crowd in private investment (Box III.2). The interest coverage ratio (ICR)3 of listed private companies in the manufacturing and information technology (IT) sectors remained comfortable in Q3:2022-23, indicating adequate debt servicing capacity (Chart III.8). The ICR of services sector (non-IT) improved in Q3 and crossed the threshold level of unity for the first time since Q1:2019-20. Box III.2: Does Public Investment Crowd in Private Investment? In recent years, the government expanded capital expenditure to improve infrastructure, create additional capacity, enhance productivity and crowd in private investment. Public investment multipliers are higher in emerging market economies (EMEs) with a lower initial stock of public capital (Izquierdo, A. et al., 2019; Serven, 1999; Bahal et al., 2015; RBI, 2019). Against this backdrop, the effect of public investment on private investment is investigated in a SVAR framework for 1980-2019 period. Public investment, private investment, and GDP in real per capita are included in the model (all variables in growth rates), with global GDP growth as a control variable to account for external demand shocks. The impulse responses indicate that a 1 percentage point increase in public investment increases private investment by 0.6 percentage point in the first year and the cumulative impact over a 3-year period is over 1.0 percentage point (Chart III.2.1). The multiplier for public investment on private investment is 1.2 and on overall GDP is 1.7 over a three-year period, well over unity. Thus, the empirical analysis indicates that the government’s focus on capital expenditure in the recent budgets, including the Union Budget 2023-24, could be effective in stimulating private investment and domestic demand with beneficial effects accruing over time. 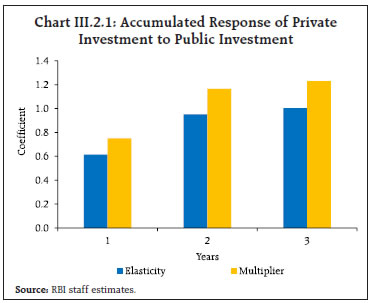 References: Bahal, G., Raissi, M., & Tulin, V. (2018), “Crowding-out or Crowding-in? Public and Private Investment in India”. World Development, 109, 323-333. Izquierdo, M. A., Lama, M. R., Medina, J. P., Puig, J., Riera-Crichton, D., Vegh, C., & Vuletin, G. J. (2019), “Is the Public Investment Multiplier Higher in Developing Countries? An Empirical Exploration”. IMF Working Paper 289. Serven, L. (1996), “Does Public Capital Crowd Out Private Capital? Evidence from India”. World Bank Policy Research Working Paper 1613. Reserve Bank of India (2019), “Monetary Policy Report”, April. | The investment rate – the ratio of gross capital formation (GCF) to GDP at current prices – rose to 31.4 per cent in 2021-22 from 27.9 per cent in the preceding year. Over the same period, the gross domestic saving rate improved to 30.2 per cent of GDP from 28.8 per cent a year ago (Chart III.9), with lower dissaving of the public sector offsetting the drop in household saving. The net household financial saving – the source of funding for deficit sectors – moderated to 7.6 per cent of GDP in 2021-22 from 11.5 per cent in 2020-21, reflecting a surge in consumption and associated drawdown in precautionary saving. The net household financial saving is estimated to moderate further to 6.3-6.5 per cent of GDP during 2022-23, according to provisional estimates, reflecting an increase in households’ credit demand.
III.1.3 Government Consumption The government final consumption expenditure (GFCE) supported aggregate demand in H2:2022-23 after a contraction in H1 (Chart III.10). Despite a steep increase in subsidies outgo in 2022-23 (RE), the Central Government’s total expenditure was contained at 15.4 per cent of GDP, lower than that in 2021-22 (Table III.2). For 2023-24, the central government has budgeted gross fiscal deficit (GFD) at 5.9 per cent of GDP, down from 6.45 per cent in 2022-23 (RE). Fiscal consolidation will be pursued through containing revenue expenditure (especially subsidies) while boosting capital expenditure to 3.3 per cent of GDP in 2023-24 from 2.7 per cent in the previous year. Revenue expenditure excluding interest payments and major subsidies is budgeted to decline to 6.8 per cent of GDP in 2023-24 (BE) from 7.3 per cent in 2022-23 (RE). 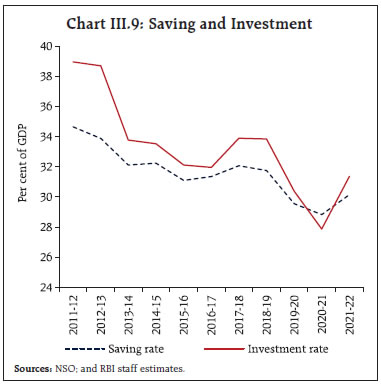 During 2022-23 (up to February 2023), the central government’s gross tax revenues exhibited buoyancy and increased by 12.0 per cent y-o-y, with a robust expansion in collections under all major taxes except excise duties. Direct and indirect taxes registered y-o-y growth of 15.9 per cent and 8.1 per cent, respectively. Within indirect taxes, Union excise duties contracted by 18.6 per cent mainly due to a reduction in excise duties on fuel in May 2022, while GST collections (centre plus states) rose by 21.9 per cent benefitting from resilient economic activity and improved tax compliance4 (Chart III.11). The central government's revenue expenditure excluding interest payments and subsidies and capital expenditure increased by 2.5 per cent and 21.7 per cent, respectively, during this period. 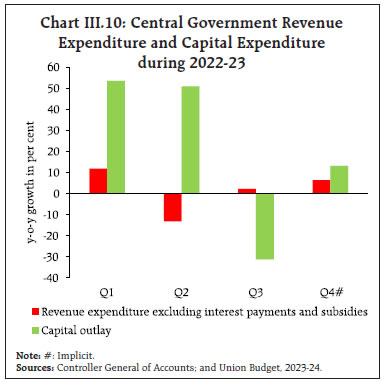
| Table III.2: Central Government Finances | | Indicator | Per cent to GDP | | 2020-21 | 2021-22 | 2022-23 (RE) | 2023-24 (BE) | | 1. Revenue receipts | 8.2 | 9.2 | 8.6 | 8.7 | | a. Tax revenue (Net) | 7.2 | 7.7 | 7.7 | 7.7 | | b. Non-tax revenue | 1.0 | 1.6 | 1.0 | 1.0 | | 2. Non-debt capital receipts | 0.3 | 0.2 | 0.3 | 0.3 | | 3. Revenue expenditure | 15.5 | 13.6 | 12.7 | 11.6 | | a. Interest payments | 3.4 | 3.4 | 3.5 | 3.6 | | b. Major subsidies | 3.6 | 1.9 | 1.9 | 1.2 | | 4. Revenue expenditure excluding interest payments and subsidies | 8.6 | 8.3 | 7.3 | 6.8 | | 5. Capital expenditure | 2.1 | 2.5 | 2.7 | 3.3 | | 6. Capital outlay | 1.6 | 2.3 | 2.3 | 2.8 | | 7. Total expenditure | 17.7 | 16.2 | 15.4 | 14.9 | | 8. Gross fiscal deficit | 9.2 | 6.8 | 6.5 | 5.9 | | 9. Revenue deficit | 7.3 | 4.4 | 4.1 | 2.9 | | 10. Primary deficit | 5.7 | 3.3 | 3.0 | 2.3 | Notes: RE: Revised Estimates; BE: Budget Estimates.
Figures may vary from those published in the Union Budget due to revision in GDP.
Sources: Union Budget documents and RBI staff estimates. | In 2022-23, state governments’ consolidated GFD was budgeted at 3.4 per cent of GDP, with a thrust on capital spending (Table III.3). Available data for 2022-23 (April-January)5 indicate that states’ fiscal deficits declined in absolute terms as well as a proportion to budget estimates (BE) (Chart III.12).
| Table III.3: State Government Finances – Key Fiscal Indicators | | Item | (Per cent of GDP) | | 2020-21 (A) | 2021-22 (BE) | 2021-22 (PA) | 2022-23 (BE) | | Revenue deficit | 1.9 | 0.5 | 0.4 | 0.3 | | Gross fiscal deficit | 4.1 | 3.5 | 2.8 | 3.4 | | Primary deficit | 2.1 | 1.6 | 1.1 | 1.6 | Note: Data pertain to 31 states/UTs.
A: Accounts; BE: Budget Estimates; PA: Provisional Accounts.
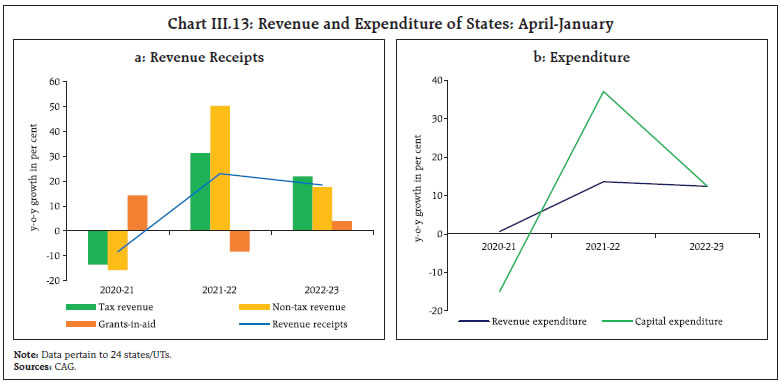
Sources: Budget Documents of State Governments; and Comptroller and Auditor General (CAG) of India. | States’ revenue receipts remained buoyant across all sub-components (Chart III.13a). Capital expenditure grew by 12.5 per cent during April-January 2022-23 despite contracting in Q1 (Chart III.13b). The states have spent around 53 per cent of their budgeted capital expenditure during this period, in line with past trends. The Central Government released the fourteenth instalment of tax devolution amounting to ₹1.4 lakh crore in March 2023 as against the usual monthly devolution of ₹0.7 lakh crore. The Central Government has also decided to continue with the Scheme for Special Assistance to States for Capital Expenditure with an enhanced allocation of ₹1.3 lakh crore in 2023-24 to incentivize higher capital expenditure by states. Considering the revenue and expenditure trends, states’ GFD-GDP ratio in 2022-23 may remain lower than the BE. In 2022-23, the centre’s gross market borrowing stood at ₹14.21 lakh crore as against ₹14.37 lakh crore planned in the indicative calendars for H1 and H2. The Reserve Bank also conducted eleven switch auctions on behalf of the central government amounting to ₹1.05 lakh crore for debt consolidation. The weighted average cost of issuances during 2022-23 inched up to 7.3 per cent from 6.3 per cent during the previous year, with the weighted average maturity declining to 16.05 years from 17.0 years. States raised gross market borrowings of ₹7.58 lakh crore in 2022-23 as against the total sanctioned amount of ₹8.81 lakh crore. 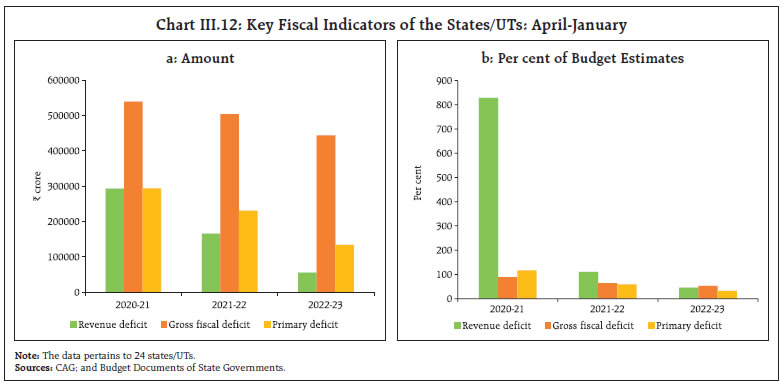
 In the Union Budget 2023-24, gross and net market borrowings were placed at ₹15.43 lakh crore and ₹11.81 lakh crore, respectively, an increase of about 8.6 per cent and 6.6 per cent, respectively, over the previous year (Table III.4). In H1:2023-24, gross market borrowings of the central government through dated securities have been planned for about ₹8.9 lakh crore, constituting 57.6 per cent of total amount budgeted for the year. The Ways and Means Advances (WMA) limit for the central government for H1:2023-24 will be at ₹1,5 lakh crore for meeting temporary mismatches between receipts and payments. For states/union territories, the WMA limits have been fixed at ₹47,010 crore with effect from April 1, 2022, as recommended by the Advisory Committee on Ways and Means Advances to State Governments (Chairman: Shri Sudhir Shrivastava). | Table III.4: Centre’s Borrowings | | (₹ lakh crore) | | Item | 2020-21 | 2021-22 | 2022-23 (RE) | 2023-24 (BE) | | I Net borrowings (G-Sec) | 10.4 | 7.4 | 7.8 | 11.8 | | Repayments | 2.3 | 2.6 | 3.1 | 3.6 | | Gross borrowings (G-Sec) | 12.6 | 10.0 | 10.9 | 15.4 | | II T-Bills/Cash management bills (Net) | 2.0 | 0.8 | 1.0 | 0.5 | | III Net market borrowings (I+II) | 12.4 | 8.1 | 8.8 | 12.3 | | IV Securities against small savings | 4.8 | 5.5 | 4.4 | 4.7 | | V State provident fund | 0.2 | 0.1 | 0.2 | 0.2 | | VI Other receipts | 0.1 | 1.7 | 0.8 | 0.5 | | VII External debt | 0.7 | 0.4 | 0.2 | 0.2 | | VIII Total debt (III to VII) | 18.3 | 15.8 | 14.4 | 18.0 | | IX Drawdown on cash balances | -0.1 | 0.0 | 0.0 | -0.1 | | X Total funding (VIII+IX) | 18.2 | 15.8 | 17.6 | 17.9 | | Sources: GoI; and RBI staff estimates. |
III.1.4 External Demand Amidst protracted geopolitical frictions and slowing global demand, merchandise exports contracted during H2:2022-23. Merchandise imports registered a deceleration in growth during Q3 and contracted in Q4 (upto February) owing to a slowdown in export-related demand as well as a reduction in commodity prices (Chart III.14). The drag from net exports, however, declined in Q3 from the previous quarter, reflecting continued strength in services exports. During H2:2022-23 (October-February), exports of engineering goods, cotton yarn, gems and jewellery, plastic and linoleum, and chemicals declined, while petroleum products, electronics, rice, oil meals and iron ore contributed positively to overall merchandise exports growth (Chart III.15). The share of petroleum products in total merchandise exports rose to 20.3 per cent during H2:2022-23 (October-February) from 16.2 per cent in the corresponding period of the previous year. Merchandise import growth moderated to 1.9 per cent in H2:2022-23 (October-February) to reach US$ 280.7 billion. Oil imports rose while gold imports declined as retail demand remained sluggish amidst higher prices. The deceleration in non-oil non-gold imports was driven by electronics goods, pearls and precious stones, chemicals and silver (Chart III.16). The merchandise trade deficit in H2 (October-February) widened to US$ 106.6 billion from US$ 96.3 billion during the corresponding period of the previous year. Services sector trade sustained its post-pandemic buoyancy reflecting strong global demand for Indian services (Chart III.17). Services exports grew by 24.5 per cent in Q3 and 29.2 per cent in Q4 (up to February) on top of 30.2 per cent growth in Q2, propelled by software, business, financial and travel services.
Inward remittances exhibited resilience with a y-o-y growth of 31.7 per cent to reach US$ 30.8 billion in Q3. The current account deficit narrowed to 2.2 per cent of GDP in Q3 from 3.7 per cent in Q2, mirroring the trend in merchandise trade deficit. Turning to the financial account, capital flows ebbed in H2:2022-23. Net FDI dropped to US$ 2.1 billion in Q3 from US$ 4.6 billion a year ago, owing to lower inflows and higher outward FDI (Chart III.18). During April-January 2022-23, manufacturing, financial services and computer services together accounted for more than half of total FDI inflows. The top sources for FDI inflows were Singapore, Mauritius, USA and UAE. Foreign portfolio investors (FPIs) turned optimistic in Q3, with net purchases of US$ 4.5 billion. They were net sellers during Q4 with net outflows of US$ 2.2 billion, mainly on account of equity segment following heightened uncertainty over monetary policy spillovers and geopolitical concerns. External commercial borrowings (ECBs) recorded net outflows of US$ 6.4 billion during 2022-23 (up to February 2023) due to lower inflows and higher principal repayments. ECBs amounting to US$ 22.8 billion were approved during 2022-23 (April-February) for inter alia on-lending/sub-lending, new projects, refinancing of earlier ECBs, sourcing of capital goods (local and imports) and working capital. Net inflows under non-resident deposit accounts rose to US$ 6.0 billion during April-January 2022-23 from US$ 2.7 billion during the same period last year, aided by the RBI’s July 2022 measures to attract such flows. As on March 31, 2023, India’s foreign exchange reserves stood at USD 578.4 billion, equivalent to 9.8 months of projected merchandise imports in 2022-23 or 94.4 per cent of outstanding external debt at end-December 2022. III.2 Aggregate Supply Aggregate supply – measured by real gross value added (GVA) at basic prices – expanded by 4.6 per cent (y-o-y) in Q3:2022-23 (4.7 per cent a year ago), surpassing its pre-pandemic level of Q3:2019-20 by 12.6 per cent (Table III.5). While agriculture and services sectors remained resilient, the manufacturing sector contracted amidst sustained input cost pressures. The momentum of overall GVA, measured by q-o-q saar, recorded double digit growth in Q3 (Chart III.19). | Table III.5: Real GVA Growth | | (y-o-y, per cent) | | Sector | 2021-22 (FRE) | 2022-23 (SAE) | Weighted Contribution | 2021-22 | 2022-23 | | 2021-22 | 2022-23 | Q1 | Q2 | Q3 | Q4 | Q1 | Q2 | Q3 | Q4# | | Agriculture, forestry and fishing | 3.5 | 3.3 | 0.6 | 0.5 | 3.4 | 4.8 | 2.3 | 4.1 | 2.5 | 2.4 | 3.7 | 4.3 | | | (7.8) | (11.4) | | | (7.4) | (9.4) | (7.2) | (7.6) | (10.1) | (12.0) | (11.1) | (12.3) | | Industry | 10.5 | 1.7 | 2.4 | 0.4 | 42.1 | 7.3 | 2.2 | 1.3 | 7.6 | -2.3 | 0.3 | 1.5 | | | (11.5) | (13.4) | | | (3.9) | (13.8) | (11.9) | (16.4) | (11.7) | (11.1) | (12.2) | (18.2) | | Mining and quarrying | 7.1 | 3.4 | 0.2 | 0.1 | 12.2 | 10.6 | 5.4 | 2.3 | 9.3 | -0.4 | 3.7 | 0.9 | | | (-2.1) | (1.2) | | | (-7.5) | (1.7) | (-0.3) | (-1.5) | (1.1) | (1.3) | (3.4) | (-0.6) | | Manufacturing | 11.1 | 0.6 | 2.0 | 0.1 | 51.5 | 6.6 | 1.3 | 0.6 | 6.4 | -3.6 | -1.1 | 0.9 | | | (14.3) | (14.9) | | | (6.3) | (16.2) | (14.3) | (20.2) | (13.1) | (12.0) | (13.0) | (21.3) | | Electricity, gas, water supply and other utilities | 9.9 | 9.2 | 0.2 | 0.2 | 16.3 | 10.8 | 6.0 | 6.7 | 14.9 | 6.0 | 8.2 | 7.6 | | | (5.1) | (14.7) | | | (-1.6) | (6.4) | (6.7) | (9.4) | (13.1) | (12.8) | (15.5) | (17.8) | | Services | 9.6 | 9.3 | 5.8 | 5.7 | 17.9 | 11.0 | 6.5 | 4.9 | 16.3 | 9.0 | 6.5 | 6.6 | | | (0.9) | (10.3) | | | (-10.8) | (-0.5) | (6.3) | (9.1) | (3.8) | (8.4) | (13.2) | (16.3) | | Construction | 14.8 | 9.1 | 1.1 | 0.7 | 77.0 | 10.8 | 0.2 | 4.9 | 16.2 | 5.8 | 8.4 | 7.3 | | | (8.2) | (18.1) | | | (-8.7) | (5.3) | (8.6) | (26.0) | (6.2) | (11.5) | (17.7) | (35.2) | | Trade, hotels, transport, communication | 13.8 | 14.2 | 2.3 | 2.5 | 41.4 | 13.1 | 9.2 | 5.0 | 25.7 | 15.6 | 9.7 | 9.7 | | | (-8.7) | (4.3) | | | (-28.6) | (-7.7) | (-1.2) | (1.8) | (-10.2) | (6.7) | (8.3) | (11.6) | | Financial, real estate and professional services | 4.7 | 6.9 | 1.1 | 1.5 | 2.8 | 7.0 | 4.3 | 4.6 | 8.6 | 7.1 | 5.8 | 5.6 | | | (6.9) | (14.2) | | | (1.9) | (1.6) | (14.4) | (13.2) | (10.7) | (8.9) | (21.0) | (19.5) | | Public administration, defence and other services | 9.7 | 7.1 | 1.2 | 0.9 | 6.5 | 16.8 | 10.6 | 5.2 | 21.3 | 5.6 | 2.0 | 2.9 | | | (1.3) | (8.5) | | | (-7.9) | (2.5) | (5.1) | (4.5) | (11.6) | (8.2) | (7.2) | (7.5) | | GVA at basic prices | 8.8 | 6.6 | 8.8 | 6.6 | 20.2 | 9.3 | 4.7 | 3.9 | 12.1 | 5.5 | 4.6 | 5.1 | | | (4.2) | (11.2) | | | (-5.1) | (3.7) | (7.7) | (10.5) | (6.4) | (9.4) | (12.6) | (16.1) | Notes: FRE: First revised estimates; SAE: Second advance estimates; #: Implicit.
Figures in parentheses are growth rates over 2019-20.
Source: NSO. |
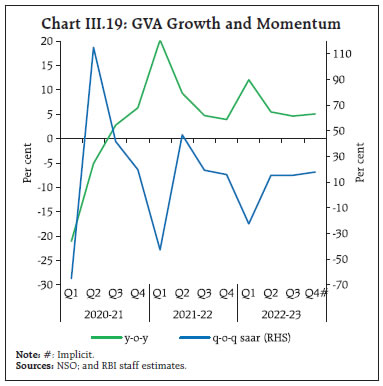 III.2.1 Agriculture GVA in agriculture, forestry and fishing posted a growth of 4.0 per cent in H2:2022-23 (3.1 per cent a year ago), even as kharif production was dented by below normal rainfall in key rice producing states and excess rains during the harvesting stage. Replenished reservoir levels and improved soil moisture helped rabi acreage to increase by 3.3 per cent in 2022-23 over the previous year. Foodgrains production touched a new record in 2022-23. The production of pulses rose by 1.9 per cent in 2022-23, primarily on account of gram, moong and other rabi pulses. Among commercial crops, oilseeds and sugarcane achieved record production levels in 2022-23 (Table III.6). Allied activities – livestock, forestry and fishing – with a share of about 45 per cent of the agricultural GVA – contributed almost three-fourth of agricultural GVA growth in 2021-22 (Chart III.20). | Table III.6: Agricultural Production in 2022-23 | | (Lakh tonnes) | | Crop | 2021-22 | 2022-23 | Variation in 2022-23 (Per cent) | | SAE | Final | Target | SAE | Over SAE 2021-22 | Over Final 2021-22 | Over Target | | Foodgrains | 3,160.6 | 3,156.2 | 3,280.0 | 3,235.5 | 2.4 | 2.5 | -1.4 | | Kharif | 1,535.4 | 1,553.6 | 1,631.5 | 1,534.3 | -0.1 | -1.2 | -6.0 | | Rabi | 1,625.3 | 1,602.5 | 1,648.5 | 1,701.2 | 4.7 | 6.2 | 3.2 | | Rice | 1,279.3 | 1,294.7 | 1,305.0 | 1,308.4 | 2.3 | 1.1 | 0.3 | | Wheat | 1,113.2 | 1,077.4 | 1,120.0 | 1,121.8 | 0.8 | 4.1 | 0.2 | | Pulses | 269.6 | 273.0 | 295.5 | 278.1 | 3.2 | 1.9 | -5.9 | | Oilseeds | 371.5 | 379.6 | 413.5 | 400.0 | 7.7 | 5.4 | -3.3 | | Sugarcane | 4,140.4 | 4,394.3 | 4,150.0 | 4,687.9 | 13.2 | 6.7 | 13.0 | | Cotton # | 340.6 | 311.2 | 370.0 | 337.2 | -1.0 | 8.4 | -8.9 | | Jute & Mesta ## | 95.7 | 101.5 | 105.0 | 100.5 | 5.0 | -1.0 | -4.3 | Notes: #: Lakh bales of 170 kgs each; ##: Lakh bales of 180 kgs each.
SAE: Second Advance Estimates.
Source: Ministry of Agriculture and Farmers’ Welfare, GoI. | The overall procurement of rice at 492.2 lakh tonnes during kharif marketing season 2022-23 was 2.2 per cent lower than that in the previous year. Foodgrains buffer stocks were 443.2 lakh tonnes for rice (5.8 times the norm) and 100.6 lakh tonnes for wheat (0.7 times the norm) as on March 16, 2023. A total offtake of 82.6 lakh tonnes of cereals (October-December 2022) was done under the extended Pradhan Mantri Garib Kalyan Anna Yojana (PMGKAY) (Chart III.21).
The high frequency indicators such as tractor sales, two-wheeler sales, fertiliser sales, agricultural credit growth and MGNREGA jobs demand suggest a recovery in rural activity during H2 (Table III.7). | Table III.7: Rural Economy - High Frequency Indicators | | Item | Unit | H1 (Apr-Sep) | H2 (Oct-Feb) | | 2019-20 | 2020-21 | 2021-22 | 2022-23 | 2019-20 | 2020-21 | 2021-22 | 2022-23 | | Tractor sales | Number (in lakh) | 3.6 | 4.0 | 4.4 | 4.9 | 3.2 | 4.1 | 3.3 | 3.8 | | Two-wheeler sales | Number (in lakh) | 97.0 | 59.9 | 65.5 | 83.8 | 68.5 | 76.4 | 58.2 | 61.7 | | Fertiliser sales | Lakh tonnes | 272.6 | 312.4 | 269.1 | 307.2 | 254.6 | 268.9 | 232.0 | 275.2 | | Demand for employment (MGNREGA) | Crore households | 11.8 | 17.6 | 16.7 | 16.7 | 8.6 | 12.9 | 11.2 | 9.7 | | Agriculture and allied sector exports* | USD billion | 17.1 | 17.9 | 22.7 | 26.4 | 11.9 | 18.5 | 17.7 | 16.4 | | Agriculture credit growth | y-o-y | 6.5 | 10.9 | 10.6 | 13.4 | 9.8 | 8.8 | 10.3 | 14.9 | | Rice stock to buffer norm# | Ratio | 2.9 | 2.4 | 3.4 | 2.8 | 6.6 | 6.7 | 7.5 | 5.8 | | Wheat stock to buffer norm# | Ratio | 2.0 | 2.1 | 2.3 | 1.1 | 1.9 | 2.1 | 1.5 | 0.7 | Notes: *upto January; #as on March 16 during H2.
Sources: Tractor Manufactures Association; SIAM; Ministry of Chemicals and Fertilisers; Ministry of Rural Development; CMIE; RBI; and Food Corporation of India. | III.2.2 Industry Industrial activity remained sluggish in Q3, driven by the contraction in manufacturing sector GVA for the second consecutive quarter albeit at a decelerated pace (Chart III.22). Mining activity got a boost from coal production, which outweighed the decline in crude oil and natural gas production. Industrial activity improved in Q4. Electricity, gas, water supply and other utility services recorded a growth of 7.9 per cent y-o-y in H2. The index of industrial production (IIP) grew by 2.6 per cent in Q3:2022-23 and 5.2 per cent in January as compared with 1.6 per cent in Q2, supported by electricity and mining. It was weighed down by manufacturing sector activity, which expanded by 1.1 per cent in Q3 and 3.7 per cent in January. The labour-intensive sectors such as textiles, wearing apparel, leather and related products, and electrical equipment contracted in Q3, while basic metals, motor vehicles, trailers and semi-trailers, machinery and equipment, and other non-metallic mineral products recorded expansion. In terms of the use-based classification, capital goods and infrastructure/construction goods expanded at a healthy pace during Q3 and January, while consumer durables output contracted (Chart III.23). Growth in core infrastructure output accelerated from 4.5 per cent in Q3 to 7.5 per cent in Q4 (upto February). Electricity generation rose by 7.9 per cent (y-o-y) in Q3:2022-23 (18.2 per cent above the pre-pandemic level). Thermal power generation increased by 7.3 per cent in Q3 and contributed 75.8 per cent of total generation. Renewable energy sources (share of 11.5 per cent in total generation) expanded by 22.9 per cent. In Q4 (up to February), electricity generation growth accelerated to 10.1 per cent (Chart III.24a). Region-wise, the northern and western regions were the drivers of electricity demand (Chart III.24b).
The manufacturing purchasing managers’ index (PMI) remained in expansion mode in H2, although it moderated from 56.3 in Q3 to 55.7 in Q4, dragged down by new work and export orders (Chart III.25a).
The output of manufacturing, primary goods, infrastructure and construction, capital goods and consumer non-durables sectors has surpassed their pre-pandemic levels, while that of consumer durable goods is still trailing. Amongst the major sub-sectors, steel production, cement production, electricity generation, and production of passenger vehicles and tractors are ruling above their 2019-20 levels, while two-wheelers and three-wheelers production is lagging (Table III.8). III.2.3 Services The services sector held up well in H2:2022-23, supported by an impetus from contact-intensive services and construction activity (Chart III.26a). Services sector GVA rose by 6.5 per cent in Q3 and was the main driver of aggregate GVA (with about 84 per cent contribution to aggregate GVA growth). The contact-intensive services, viz., trade, hotels, transport, and communication grew by 9.7 per cent in H2 (20.1 per cent in H1). Construction activity remained robust in H2 as indicated by trends in finished steel consumption and cement production (Chart III.26b). Robust GST collections in Q4 point towards an ongoing revival of domestic trading activity (Table III.9). Domestic air passenger traffic rebounded in Q3:2022-23 and remained strong in Q4, buoyed by leisure and business travel and related activities. Amongst indicators of transportation services, commercial vehicles surged at double digit pace in Q3 and toll collections remained strong in Q3 and Q4. Port cargo expanded at a robust pace during December-February after a muted growth during October-November. Railway freight traffic, on the other hand, grew modestly in Q3 and Q4. The services PMI strengthened from 56.6 in Q3 to 58.1 in Q4. PMI services at 59.4 in February indicated the strongest expansion in 12 years due to new business orders (Chart III.25b). The PMI composite output index improved from 57.2 in Q3 to 58.3 in Q4. The IT sector performed well in Q3:2022-23 as exhibited by strong growth in sales, supported by sustained domestic and international demand. With the pick-up in contact-intensive services, non-IT services also witnessed strong performance in sales, despite some moderation in growth (Chart III.27).
Real estate activity in Q3:2022-23 was marked by higher new launches and an increased unsold inventory (Chart III.28a). The growth in all-India housing prices decelerated in Q3; city-wise, the pace accelerated in Bengaluru and Chennai while it eased in Delhi and Mumbai (Chart III.28b). The growth in public administration, defence and other services (PADO) moderated in H2. The Centre’s revenue expenditure excluding interest payments and subsidies rose by 2.2 per cent (y-o-y) during Q3 and 11.4 per cent in January-February 2023. Private services slowed down in Q3 partly due to unfavourable base. III.3 Conclusion Domestic economic activity exhibited resilience in H2:2022-23, amidst accentuating global headwinds. Investment activity was robust while private consumption growth moderated. On the supply side, services sector was the main driver, with elevated input cost pressures dragging down the manufacturing sector. Going ahead, the economic activity would be supported by improving rural demand, the Government’s thrust on infrastructure spending, revival in corporate investment, healthy bank credit, and moderating commodity prices. Headwinds from prolonged geopolitical tensions, tighter global financial conditions, global financial market volatility and slowing external demand are the key risks to the outlook. __________________________________________________________________________________
IV. Financial Markets and Liquidity Conditions Domestic financial markets evolved in an orderly manner during H2:2022-23 amidst policy repo rate hikes, moderating liquidity and recurrent bouts of global volatility impacting, in particular, equity and forex segments. Bank deposit and lending rates moved higher. Going forward, the RBI will need to remain vigilant in mitigating the impact of global spillovers on domestic financial markets. Introduction Since the September 2022 MPR, global financial markets have remained volatile amidst protracted geopolitical tensions, inflation remaining well above target across economies and aggressive monetary tightening. Sovereign bond yields fluctuated widely in line with incoming data and high intensity banking turmoil events in March. Equity markets in advanced economies (AEs) rallied on expectations of monetary policy pivots towards less restrictive stances, with EME stocks mirroring global sentiments, until the collapse of a few banks in the US triggered a flight to safety. In the currency markets, the US dollar eased from a two-decade peak and weakened against most currencies during October 2022-January 2023 but gained in February on strong US data. Volatility impacted EME currencies in an environment of risk aversion, safe haven demand, and correction in global equity markets. IV.1 Domestic Financial Markets In contrast, domestic financial markets evolved in an orderly manner. Money market interest rates hardened during H2:2022-23, while bond yields were largely range-bound. Equity markets exhibited two-way movements in H2. The Indian rupee (INR) depreciated vis-a-vis the US dollar. Bank deposit and lending rates moved higher in response to monetary policy actions. Bank credit growth remained in double digits throughout 2022-23 although it showed signs of slowdown from December 2022. IV.1.1 Money Market Money market rates firmed up across maturities during H2:2022-23, mirroring the increases in the policy repo rate and the ebbing of surplus liquidity. Reflecting these developments, the weighted average call money rate (WACR), on an average, was broadly aligned with the repo rate – 3 basis points (bps) above the repo rate in H2 as compared with 27 bps below in H1 (Chart IV.1). In the overnight call money segment, the weighted average rate (WAR) on traded deals (on an average) was 5 bps above the policy repo rate while it was 15 bps below on reported deals1 during H2 (Chart IV.2a). The average monthly volume of traded deals during H2 at ₹2.32 lakh crore was notably higher than ₹0.24 lakh crore in the reported segment (Chart IV.2b). The share of reported deals in the total call money market volume declined to 5 per cent in March 2023 from 33 per cent in September 2022 due inter alia to the Reserve Bank’s directive to all eligible call money participants (including cooperative banks) to obtain NDS-CALL membership, the restoration of regular market hours and tightening liquidity conditions. 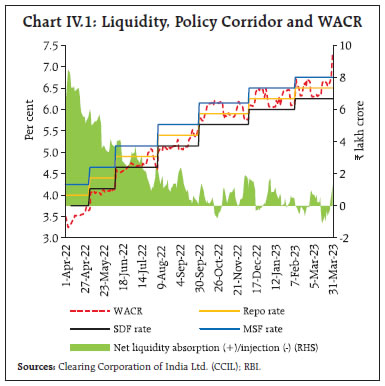
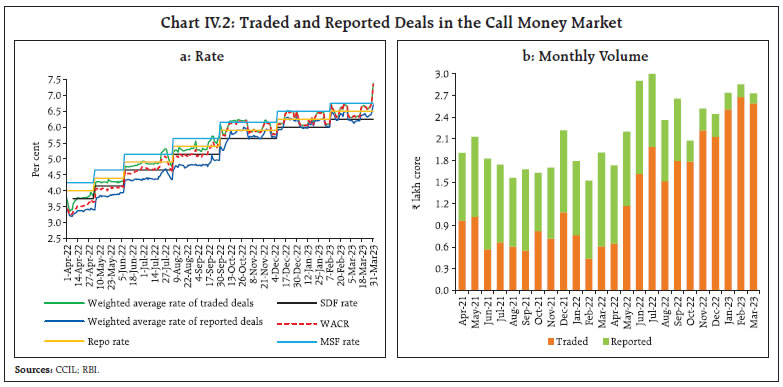 Within the money market, the collateralised segments remained dominant. The share of the uncollateralised call money market in total money market volume was 2 per cent in H2. Amongst the collateralised segments, the share of triparty repo (TREPS) moderated to 71 per cent in H2 from 76 per cent a year ago, while that of market repo increased to 27 per cent from 22 per cent (Chart IV.3). Among investors, the share of mutual funds (MFs) – the major lenders in the collateralised segment – declined to 67 per cent in H2 from 71 per cent in H1 in the TREPS segment and to 40 per cent from 45 per cent in the market repo segment, mainly because of reduced inflows under debt funds. On the borrowing side, the share of public sector banks (PSBs) in TREPS and market repo declined to 61 per cent and 15 per cent, respectively, in H2 from 65 per cent and 19 per cent, in H1. The interest rates on longer-term money market instruments – 3-month T-bills (TBs); certificates of deposit (CDs); and commercial paper (CPs) – rose in sync with the policy rate. The spread of TBs over the policy repo rate at 30 bps in H2 was marginally higher than 25 bps in H1, while the spreads of CDs and CPs widened to 85 bps and 99 bps, respectively, from 46 bps and 63 bps, amidst receding surplus liquidity and rise in risk premia2 during H2 (Chart IV.4). 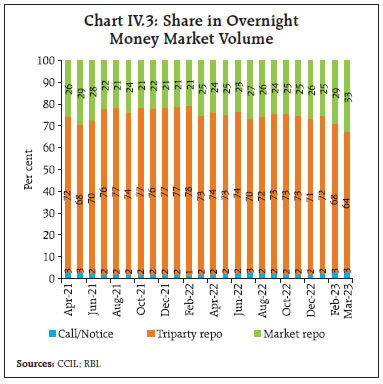
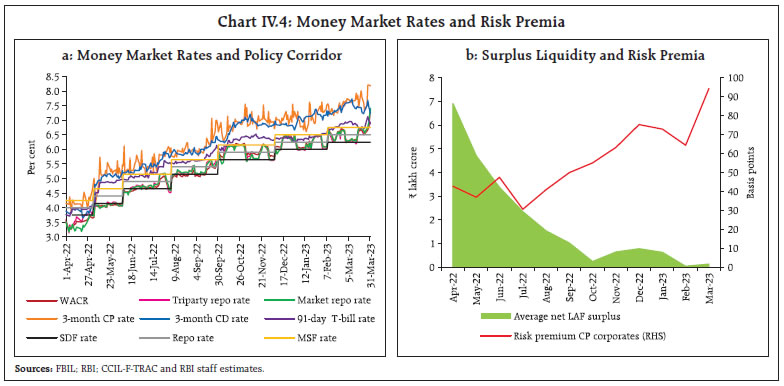 Banks continued to rely on CDs for funding, with issuances of ₹3.8 lakh crore in H2 (up to March 24, 2023) on top of ₹3.0 lakh crore in H1. Resource mobilisation through CPs tapered from ₹7.3 lakh crore in H1 to ₹6.4 lakh crore in H2, revealing a preference for bank credit. The weighted average discount rate (WADR) on CP issuances firmed up to 7.21 per cent in H2 from 5.53 per cent in H1 (Chart IV.5a). Corporates remained the major issuers of CPs, although their share declined to 42 per cent in H2 from 52 per cent in H1 (Chart IV.5b).
| Table IV.1: Maturity Profile of CP Issuances | | (₹ lakh crore) | | Tenor | H2: 2021-22 | H1: 2022-23 | H2: 2022-23 | | 7- 30 days | 4.14 | 0.69 | 0.38 | | 31-90 days | 3.30 | 4.00 | 3.13 | | 91-180 days | 1.82 | 1.87 | 1.94 | | 181-365 days | 0.83 | 0.75 | 0.97 | | Total | 10.09 | 7.32 | 6.42 | | Outstanding (as at end-period) | 3.52 | 4.01 | 3.54 | | Sources: CCIL-F-TRAC and RBI staff estimates. | The CP issuances were dominated by 31-90 days maturity segment with a share of about 49 per cent in H2 as against 33 per cent a year ago (Table IV.1). IV.1.2 Government Securities (G-sec) Market During H2, G-sec yields were largely range-bound (Chart IV.6). Yields hardened in October 2022, tracking higher than expected domestic CPI inflation for September. They moderated in November, taking cues from softening US yields with a lower-than-expected US CPI print and declining crude prices. Overall, the 10-year benchmark yield softened by 7 bps in Q3 to close at 7.33 per cent. In Q4, yields softened in early February on a lower than anticipated market borrowing programme of the central government for 2023-24. They hardened subsequently on higher domestic and US inflation prints and stronger US economic data. In March, the yields softened, taking cues from US yields following bank collapses which drove investors to safe assets. Overall, the 10-year benchmark yield fell by 3 bps to 7.31 per cent at end-March 2023. The yields on T-bills firmed up across tenors in sync with the policy repo rate increases and moderation in surplus liquidity (Chart IV.7). The trading volume in G-secs increased in H2 compared to the corresponding period of 2021-22 while it declined for T-bills over the same period (Chart IV.8). The weighted average yield on traded maturities for G-sec and T-bills increased by 107 bps and 293 bps, respectively, in H2 from their corresponding levels in H2 of the previous year.
The overall dynamics of the yield curve are captured by its level, slope, and curvature3. During H2, the average level of yields softened by 11 bps while the slope flattened by 70 bps due to relatively higher increase in short-term rates consequent upon policy tightening, mirroring global movements. The curvature declined by 66 bps in response to yields hardening less in the mid-segment of the curve than in the short and long segments (Chart IV.9). In the Indian context, the level and curvature of the yield curve have more information content on future macroeconomic outcomes than the slope, unlike in AEs.4 In line with the announcement in the Union Budget for 2022-23, the Reserve Bank issued Sovereign Green Bonds (SGrBs) amounting to ₹16,000 crore in two tranches of ₹8,000 crore each on January 25 and February 9, 2023. The proceeds are to be used exclusively for financing or re-financing new and/or existing projects compatible with the environment and/or climate. To facilitate debt consolidation, the Reserve Bank conducted five switch auctions on behalf of the Central Government amounting to ₹49,387 crore during H2. The weighted average maturity (WAM) of the outstanding stock of G-secs at 11.94 years during H2 was similar to 11.96 years at end-September 2022. The weighted average coupon (WAC) at 7.26 per cent at end-March 2023 was higher than 7.15 per cent at end-September 2022. The weighted average spread of cut-off yields on state government securities (SGS) over G-sec yields of comparable maturities was 30 bps in H2 (Chart IV.10). The average inter-state spread on securities of 10-year tenor (fresh issuances) was 4 bps in H2. IV.1.3 Corporate Bond Market Corporate bond yields and spreads moved higher during H2, in sync with G-sec yields. The average yield on AAA-rated 3-year bonds issued by non-banking financial companies (NBFCs) and corporates increased by 57 bps (to 8.12 per cent) and by 49 bps (to 8.07 per cent), respectively, in March 2023 over September 2022. The average yield on issuances by public sector undertakings (PSUs), financial institutions (FIs) and banks rose by 46 bps to 7.75 per cent (Chart IV.11a). The risk premium (measured by the spread over 3-year G-sec yields) increased from 42 bps to 73 bps for NBFCs, from 45 bps to 68 bps for corporates and from 15 bps to 36 bps for PSUs, FIs and banks in H2 (Chart IV.11b). The increase in risk premia was seen across tenors (albeit more at shorter segments) and rating spectrum (Table IV.2). The average 3-year credit default swap (CDS) spreads for State Bank of India’s paper trading overseas reduced by three bps while that of ICICI Bank moderated by four bps in H2 over H1. The primary market issuances of corporate bonds increased to ₹3.9 lakh crore during H2 (up to February 2023) from ₹2.5 lakh crore during the corresponding period of 2021-22, offsetting the moderation in overseas issuances from ₹0.5 lakh crore in H2:2021-22 to ₹0.1 lakh crore in H2:2022-23 (Chart IV.12a). Banks tapped the bond market to raise capital for their rapidly expanding balance sheets, driven by the surge in credit demand (Chart IV.12b). Nearly the entire resource mobilisation in the corporate bond market (98.7 per cent) was through the private placement route. The outstanding investments by foreign portfolio investors (FPIs) in corporate bonds declined marginally from ₹1.14 lakh crore at end-September 2022 to ₹1.04 lakh crore at end-March 2023, pulling down the utilisation of the approved limits from 17.9 per cent to 15.5 per cent (Chart IV.12c). The daily average secondary market trading volume during H2 (up to February 2023) at ₹5,332 crore was 7.7 per cent higher than in the corresponding period of the previous year (Chart IV.12d). 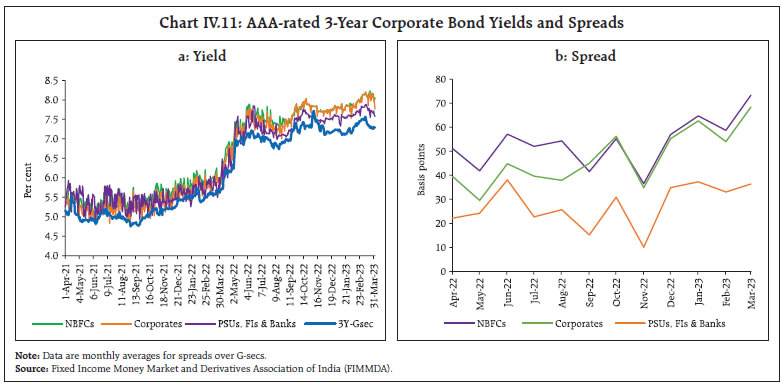
| Table IV.2: Financial Markets - Rates and Spread | | Instrument | Interest Rates (per cent) | Spread (bps) (over corresponding risk-free rate) | | March 2022 | Sep 2022 | March 2023 | March 2022 | Sep 2022 | March 2023 | | 1 | 2 | 3 | 4 | 5 | 6 | 7 | | Corporate Bonds | | | | | | | | (i) AAA (1-yr) | 5.03 | 6.87 | 8.08 | 28 | 12 | 66 | | (ii) AAA (3-yr) | 5.86 | 7.58 | 8.07 | 25 | 45 | 68 | | (iii) AAA (5-yr) | 6.43 | 7.54 | 8.00 | -1 | 23 | 57 | | (iv) AA (3-yr) | 6.57 | 8.33 | 8.77 | 96 | 120 | 139 | | (v) BBB-minus (3-yr) | 10.24 | 11.99 | 12.42 | 463 | 486 | 504 | Note: Yields and spreads are monthly averages.
Source: FIMMDA. | IV.1.4 Equity Market In H2, domestic equity markets began on a positive note, amidst strong buying by FPIs and robust corporate earnings. The benchmark BSE Sensex touched an all-time high of 63,284 on December 1, 2022. In early Q4, rising US Fed terminal rate projections amidst tight labour market conditions dampened market sentiments. Domestic equities remained under pressure in March 2023 amidst spillovers triggered by the banking turmoil in the US and Europe. The BSE banking index (the Bankex), however, gained by 0.9 per cent in March 2023 in contrast to declines of 25.2 per cent and 13.8 per cent in the US and European banking benchmarks, respectively5. Overall, the BSE Sensex gained 2.7 per cent in H2 to close at 58,992 on March 31, 2023. Barring brief phases of turbulence, equity market volatility trended downwards with the India VIX – which captures the short-term expected volatility of Nifty 50 – declining from 20 at end-September 2022 to 12.9 at end-March 2023 (Chart IV.13a). The Indian equity markets have remained resilient as compared to most EMEs in 2022-23 (Chart IV.13b). 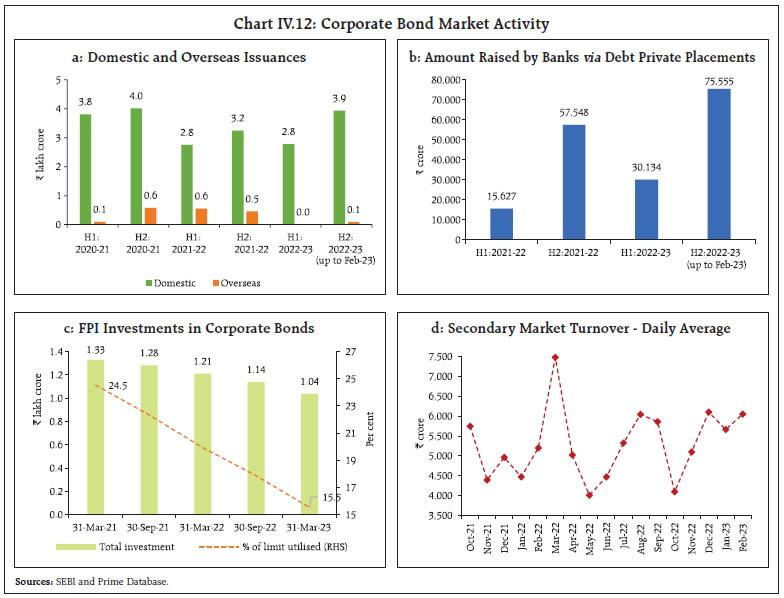 FPI flows to EMEs rebounded during H2 (Chart IV.14a). In India, foreign investors were net buyers in the domestic equity market in October-November 2022, attracted by robust earnings. They, however, turned net sellers in December-February on expectations of further monetary tightening by the US Fed and a sell-off in shares of a large Indian business conglomerate. Foreign investors turned net buyers in March. Domestic institutional investors (DIIs), on the other hand, were net buyers amidst steady retail participation through the Systematic Investment Plan (SIP) route, enabling the market to remain resilient. FPIs and DIIs were net buyers to the tune of ₹25,027 crore and ₹1.10 lakh crore, respectively, in H2 (Chart IV.14b). Activity in the domestic primary market remained subdued in H2, with issuers reconsidering IPOs amidst volatile market conditions (Chart IV.14c).
IV.1.5 Foreign Exchange Market The appreciation of the US dollar, triggered by aggressive rate hikes and the hawkish stance of the US Fed, exerted depreciation pressure on EME currencies in H2 (Chart IV.15a). Buffeted by these global spillovers, the INR touched an all-time low of 83.2 per US$ on October 20, 2022. It recovered in November 2022, riding on a depreciating US dollar and net inflows through foreign portfolio investments. Since then, it has remained largely range-bound. The INR volatility – measured by the 1-month at the money (ATM) option implied volatility – increased marginally from 5.29 per cent during H1 to 5.33 per cent during H2 (Chart IV.15b). On a financial year basis, the INR outperformed major EME currencies, including the Argentine Peso, the South African Rand, and the Turkish Lira during 2022-23 (Chart IV.16). In terms of the 40-currency nominal and real effective exchange rate, the INR depreciated by 4.2 per cent and 5.0 per cent, respectively, between September 2022 (average) and end-March 2023 (Table IV.3).
| Table IV.3: Nominal and Real Effective Exchange Rate Indices (Trade-weighted) | | (Base: 2015-16 = 100) | | Item | Index: March 31, 2023 (P) | Appreciation (+) / Depreciation (-) (Per cent) | | March 31, 2023 over September 2022 (average) | | 40-currency REER | 99.7 | -5.0 | | 40-currency NEER | 89.0 | -4.2 | | 6-currency REER | 98.3 | -6.4 | | 6-currency NEER | 82.8 | -6.2 | | ₹/US$ | 82.2 | -2.4 | P: Provisional.
Sources: RBI; and FBIL. | Forward premiums fell during H2 – the 1-month forward premia declined to an average of 2.39 per cent during H2 from 3.38 per cent during H1 (Chart IV.17). IV.1.6 Credit Market Bank credit growth remained robust in H2:2022-23 in tandem with economic activity. Growth in non-food bank credit accelerated to 15.4 per cent (y-o-y) as at end-March 2023 from 9.7 per cent a year ago (Chart IV.18). With credit growth outpacing growth in aggregate deposits, the incremental credit deposit ratio was above 100 per cent, raising questions about the long-term sustainability of high credit growth (Box IV.1). While credit growth picked up across the board, it remained higher for private sector banks (PVBs) (18.4 per cent) vis-à-vis the PSBs (13.7 per cent) (Chart IV.19a). PSBs were, however, the major driver of the incremental credit extended by all scheduled commercial banks (SCBs) in 2022-23 (Chart IV.19b). Credit offtake was led by personal loans and services6. While the share of personal loans in incremental credit offtake declined vis-à-vis the previous year, the share of the services sector nearly doubled in February 2023 (Chart IV.20). 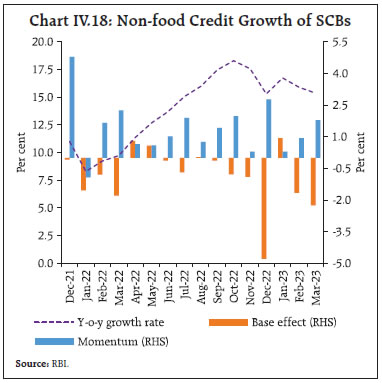
Box IV.1: Is Current Credit Growth High? Bank credit growth reflects factors such as swings in economic activity, the availability and cost of non-bank funding, the relative cost of bank funding, the banking sector’s health and risk appetite. Bank credit growth during 2022-23 was in large part a cyclical rebound from the subdued profile during the pre-pandemic year (2019-20) and the pandemic phase (2020-21 and 2021-22). While deposit growth trailed credit growth in 2022-23, the position was the reverse in the previous two years, reflecting higher savings due to reduced spending on contact-intensive services. More recently, deposit growth has accelerated, partly boosted by higher deposit rates. An econometric analysis of monthly non-food credit and deposit data of all scheduled commercial banks (SCBs) for the period April 2007-December 2022 shows that bank deposits and credit are cointegrated, i.e., they co-move over time7. The long-run elasticity of credit with respect to deposits is 0.94, attesting to this high degree of co-movement. The error correction coefficient is (-)0.08 (and highly statistically significant with z-statistic of -3.94), which indicates that around 8 per cent of any divergence between credit and deposit growth is eliminated every month. Despite the buoyancy in bank credit in 2022-23, the credit-to-GDP gap remains negative (Chart IV.1.1). Overall, the credit growth is driven by a rebound in economic activity and is supported by an improvement in deposit growth. Note: Figures in parentheses are z-statistics. | Sector-wise, growth in agriculture credit accelerated to 14.9 per cent (y-o-y) in February 2023 from 10.3 per cent a year ago. Bank credit to industry rose by 7.0 per cent in February 2023 as compared with 6.7 per cent a year ago, driven by large industries, especially metals, petroleum, and chemical industries. Credit growth to the infrastructure sector decelerated on the back of decline in credit to the telecom sector. The MSMEs’ credit growth remained buoyant, shored up by the Emergency Line Guarantee Scheme (ECLGS) that was extended till March 2023 (Chart IV.21). Services sector credit gained further traction in H2, propelled by flows to NBFCs, both housing finance companies and others NBFCs. With wholesale and retail trade included under the MSME category and easier access to loans under the Credit Guarantee Fund Trust for Micro and Small Enterprises (CGTMSE), credit to the trade sector registered accelerated growth in H2 (Chart IV.22). Retail loans remained the prime contributor to overall credit increase (y-o-y) in 2022-23. While credit to the housing sector recorded consistent expansion, vehicle loan growth strengthened further. Credit card loan growth was in high double digits throughout 2022-23 reflecting pent-up consumption demand (Chart IV.23).
The asset quality of SCBs improved during 2022-23, with the overall non-performing assets (NPA) ratio declining to 4.5 per cent in December 2022 from 6.5 per cent a year ago (Chart IV.24a). Asset quality improved across all the major sectors over the same period (Chart IV.24b). Banks’ non-SLR investments – i.e., investments in CPs, bonds, debentures and shares of public and private corporates – were lower during H2 than a year ago, as banks preferred to support the commercial sector through loans and advances (Chart IV.25a). The growth in adjusted non-food credit (i.e., non-food bank credit and non-SLR investments taken together) accelerated to 13.9 per cent (y-o-y) in March 2023 from 9.1 per cent a year ago, driven by non-food credit (Chart IV.25b). Excess holdings of statutory liquidity ratio (SLR) securities by banks moderated to 8.5 per cent of their net demand and time liabilities (NDTL) as on February 24, 2023 from 10.4 per cent at end-March 2022 as banks funded credit demand by shedding excess investments (Chart IV.26). Excess SLR holdings provide collateral buffers to banks for availing funds under the LAF and are also a component of the liquidity coverage ratio (LCR). IV.2 Monetary Policy Transmission The pace of transmission of policy repo rate increases to deposit and lending rates of banks strengthened in H2:2022-23, reflecting the combined impact of the external benchmark regime for loans, the moderation in surplus liquidity in the banking system and credit growth persisting above deposit growth. Banks revised upwards their external benchmark-based lending rates (EBLRs) by 250 bps during May 2022- March 2023 in tandem with the increase in the policy repo rate. The marginal cost of funds-based lending rate (MCLR) – the internal benchmark for loan pricing – rose by 140 bps over the same period. The weighted average lending rate (WALR) on sanctioned fresh rupee loans increased by 173 bps and that on outstanding rupee loans by 95 bps during May 2022 to February 2023 (Table IV.4). 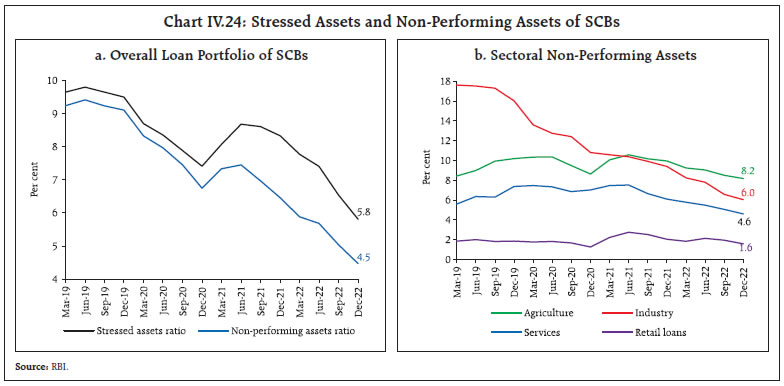
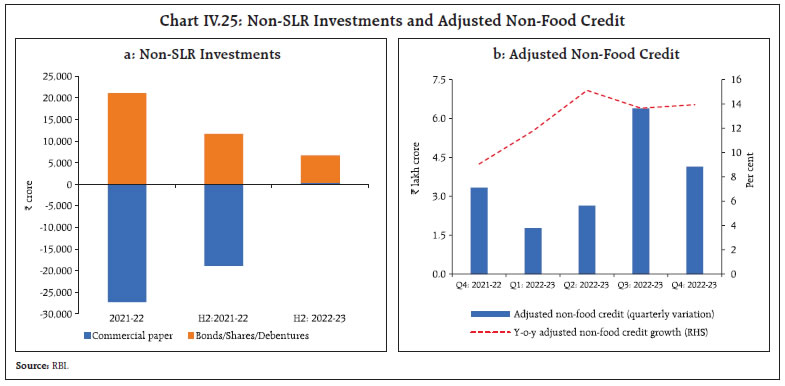
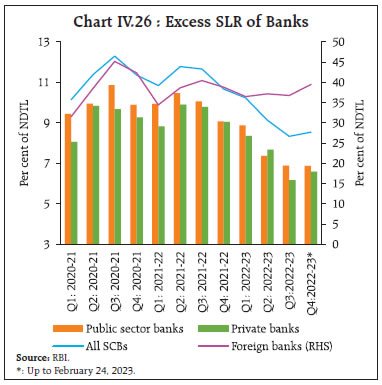 The external benchmark linked loans now dominate outstanding floating rate loans, with their share in total increasing from 44.0 per cent in March 2022 to 48.3 per cent in December 2022. Correspondingly, the share of MCLR-linked loans declined from 48.6 per cent to 46.1 per cent over the same period (Table IV.5). Within EBLR loans, the RBI’s repo rate is the preferred benchmark, with a share of 81 per cent of all EBLR linked loans at end-December 2022. The significant increase in the share of repo linked loans with shorter reset periods aided the pace of transmission to WALR on outstanding loans. Across domestic banks, the increase in the WALRs on fresh rupee loans was higher in the case of PSBs than PVBs during May 2022 to February 2023 (Chart IV.27a). The lending rates of PVBs remained higher than those of PSBs (Chart IV.27b). The transmission to lending and deposit rates was the maximum in the case of foreign banks, reflecting a higher share of low cost and lower duration wholesale deposits in their total liabilities, which facilitates faster adjustment in interest rates. | Table IV.4: Transmission from the Repo Rate to Banks’ Deposit and Lending Rates | | (Variation in basis points) | | Period | Repo Rate | Term Deposit Rates | Lending Rates | | WADTDR (Fresh Deposits) | WADTDR (Fresh Deposits) | WADTDR (Outstanding Deposits) | EBLR | 1 - Year MCLR (Median) | WALR (Fresh Rupee Loans) | WALR (Outstanding Rupee Loans) | | Retail Deposits | Retail and Bulk Deposits | | February 2019 to March 2022 | -250 | -209 | -259 | -188 | -250 | -155 | -232 | -150 | | May 2022 to February/March 2023* | 250 | 170 | 222 | 99 | 250 | 140 | 173 | 95 | | Memo: | | | | | | | | | | April 2022 | 0 | 0 | -9 | 0 | 0 | 0 | -12 | -2 | | May-June 2022 | 90 | 10 | 58 | 10 | 90 | 25 | 40 | 20 | | July-September 2022 | 100 | 38 | 70 | 26 | 50 | 36 | 68 | 30 | | October-December 2022 | 35 | 105 | 85 | 39 | 85 | 45 | 29 | 30 | | January-March 2023* | 25 | 17 | 9 | 24 | 25 | 35 | 36 | 15 | Notes: 1. WALR: Weighted average lending rate; WADTDR: Weighted average domestic term deposit rate; EBLR: External benchmark-based lending rate; MCLR: Marginal cost of funds-based lending rate.
2. Data on EBLR pertain to 31 domestic banks.
* : Latest data on WALRs and WADTDRs pertain to February 2023.
Source: RBI. |
| Table IV.5: Outstanding Floating Rate Rupee Loans of SCBs across Interest Rate Benchmarks | | (Per cent to total) | | | March 2020 | March 2021 | March 2022 | December 2022 | | Base rate regime | 10.3 | 6.4 | 4.9 | 3.4 | | MCLR regime | 78.3 | 62.3 | 48.6 | 46.1 | | External benchmark regime | 9.1 | 29.5 | 44.0 | 48.3 | | Others | 2.3 | 1.8 | 2.5 | 2.2 | Note: Data pertain to 74 scheduled commercial banks.
Source: RBI. |
The WALRs increased across all the sectors during May 2022-February 2023 (Chart IV.28). The spreads charged by domestic banks over the policy repo rate (in the case of floating rate fresh rupee loans where the repo rate is the external benchmark) moderated for personal and MSME loans during H2:2022-23 (Table IV.6). | Table IV.6: Loans linked to External Benchmark – Spread of WALR (Fresh Loans) over the Repo Rate | | (Per cent) | | Sectors | September 2022 | February 2023 | | Public sector banks | Private banks | Domestic banks | Public sector banks | Private banks | Domestic banks | | MSME loans | 4.13 | 3.55 | 3.81 | 3.75 | 3.08 | 3.27 | | Personal loans | | | | | | | | Housing | 2.79 | 2.49 | 2.63 | 2.59 | 2.20 | 2.34 | | Vehicle | 3.09 | 3.48 | 3.13 | 2.69 | 1.36 | 2.06 | | Education | 4.33 | 4.88 | 4.50 | 4.12 | 4.87 | 4.37 | | Other personal loans | 4.03 | 6.38 | 4.21 | 3.43 | 3.35 | 3.42 | | Source: RBI. | The transmission to retail deposit rates gathered pace in H2 after remaining subdued in H1 as banks intensified their efforts to garner retail deposits to fund robust credit growth (Chart IV.29a). The weighted average domestic term deposit rate (WADTDR) on fresh deposits (including retail and bulk) increased by 222 bps during May 2022 to February 2023. During H1, banks had focussed on mobilising bulk deposits. This was reversed in H2 with the increase in fresh retail deposit rates (122 bps) outpacing that in fresh bulk deposit rates (77 bps) (Chart IV.29b). The transmission to WADTDR on outstanding deposits is picking up, albeit gradually, reflecting the longer maturity profile of term deposits contracted at fixed rates. The increase in term deposit rates in the current tightening cycle has exceeded that in lending rates (Chart IV.30a). Savings deposit rates of banks – which are a third of total deposits – have, however, remained almost unchanged in the current tightening period (Chart IV.30b)8. This has moderated the increase in banks’ overall cost of funds and helped in improving their net interest margins (Chart IV.30c). 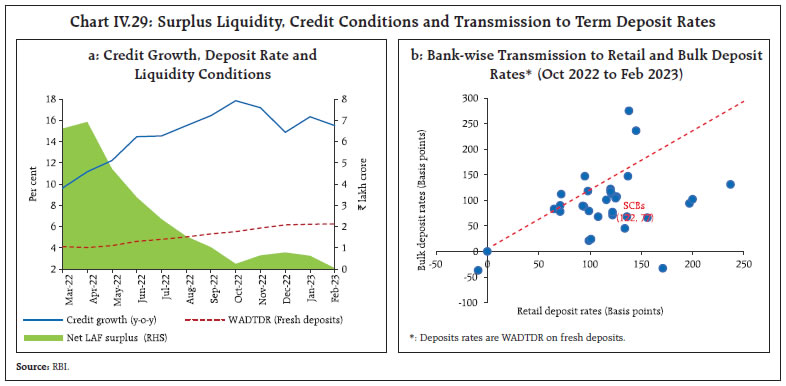
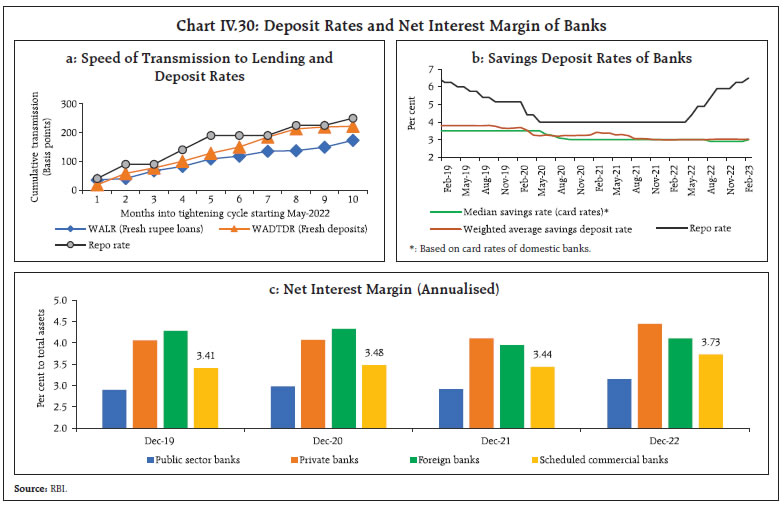
| Table IV.7: Interest Rates on Small Savings Instruments – Q1:2023-24 | | Small Savings Scheme | Maturity (years) | Spread (Percentage point) $ | Average G-sec Yield (%) of Corresponding Maturity (Dec 2022 - Feb 2023) | Formula based Rate of Interest (%) (applicable for Q1:2023-24) | Government Announced Rate of Interest (%) in Q1:2023-24 | Difference (basis points) | | (1) | (2) | (3) | (4) | (5) = (3) + (4) | (6) | (7) = (6) - (5) | | Savings deposit | - | - | - | - | 4.00 | - | | Public provident fund | 15 | 0.25 | 7.51 | 7.76 | 7.10 | -66 | | Term deposits | | | | | | | | 1 Year | 1 | 0 | 6.80 | 6.80 | 6.80 | 0 | | 2 Year | 2 | 0 | 6.91 | 6.91 | 6.90 | -1 | | 3 Year | 3 | 0 | 7.02 | 7.02 | 7.00 | -2 | | 5 Year | 5 | 0.25 | 7.25 | 7.50 | 7.50 | 0 | | Recurring deposit account | 5 | 0 | 7.02 | 7.02 | 6.20 | -82 | | Monthly income scheme | 5 | 0.25 | 7.21 | 7.46 | 7.40 | -6 | | Kisan Vikas Patra | 115 Months# | 0 | 7.51 | 7.51 | 7.50 | -1 | | NSC VIII issue | 5 | 0.25 | 7.45 | 7.70 | 7.70 | 0 | | Senior Citizens saving scheme | 5 | 1.00 | 7.25 | 8.25 | 8.20 | -5 | | Sukanya Samriddhi account scheme | 21 | 0.75 | 7.51 | 8.26 | 8.00 | -26 | $: Spreads for fixing small saving rates as per Government of India Press Release of February 2016.
#: Current maturity is 115 months.
Note: Compounding frequency varies across instruments.
Sources: Government of India; FBIL; and RBI staff estimates. | Interest rates on small savings instruments (SSIs) – administered by the government and linked to secondary market yields on G-secs of comparable maturities – were revised upwards by 10-30 bps for Q3:2022-23, 20-110 bps for Q4:2022-23 and 10-70 bps for Q1:2023-24 after being left unchanged for nine consecutive quarters, i.e., from Q2:2020-21 to Q2:2022-23. With these adjustments, rates on most of the SSIs are closely aligned with the formula-based rates (Table IV.7). Banks’ term deposit rates are now competitively priced vis-a-vis post office term deposit rates (Chart IV.31). IV.3 Liquidity Conditions and the Operating Procedure The RBI Act, 1934 requires the Reserve Bank to place the operating procedure relating to the implementation of monetary policy and changes thereto from time to time, if any, in the public domain. In consonance with the monetary policy stance of withdrawal of accommodation, surplus liquidity moderated further in H2:2022-23. On September 30, 2022, the Reserve Bank announced the merger of the 28-day VRRR with the fortnightly 14-day main auction. Amidst waning surplus liquidity, the Reserve Bank conducted two variable rate repo (VRR) main operation auctions in February-March and one fine-tuning VRR in March 2023. The Reserve Bank remained committed to meeting the productive requirements of the economy, with flexibility on conducting operations on either side of the LAF, depending on evolving liquidity conditions. The standing deposit facility (SDF), which has been operational over the past year as the floor of the LAF corridor, allowed the RBI to seamlessly absorb the surplus liquidity without being constrained by the availability of collateral. 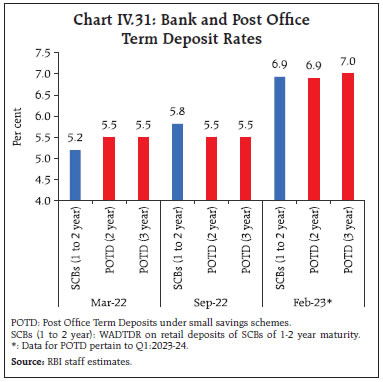
| Table IV.8: Liquidity – Key Drivers and Management | | (₹ crore) | | Drivers | 2021-22 | 2022-23* | | H1 | H2 | H1 | H2* | | Drivers | | (i) CiC [withdrawal (-) /return (+)] | -71,344 | -2,08,609 | -24,604 | -2,22,099 | | (ii) Net forex purchases (+)/ Sales (-) | 3,04,980 | -1,70,351 | -2,73,554 | 49,278# | | (iii) GoI cash balances [build-up (-) / drawdown (+)] | -1,75,933 | 3,73,153 | -1,99,861 | 30,048# | | (iv) Excess reserves [build-up (-) / drawdown (+)] | 1,11,969 | -1,55,698 | 95,719 | 38,005# | | Management | | (i) Net OMO purchases (+)/ Sales (-) | 2,36,926 | -22,950 | -21,080 | -10,280 | | (ii) Required reserves [including both change in NDTL and CRR] | -99,242 | -28,913 | -1,17,000 | -39,082 | | Memo Item | | (i) Average daily absorption during the period | 7,02,231 | 8,13,922 | 4,22,682 | 1,47,886 | CiC: Currency in Circulation. GoI: Government of India
Note: (+) / (-) sign suggests accretion/depletion in banking system liquidity.
*: Data for H2 are up to March 24, 2023. #: Data are up to January 2023.
Source: RBI. | Drivers and Management of Liquidity Currency in circulation (CiC) was the key driver of liquidity drainage during H2. CiC expanded by ₹2.2 lakh crore during H2 (up to March 24, 2023), driven by festival season demand (Table IV.8). This was partly offset by the net forex purchases (₹0.5 lakh crore) and the pick up in government spending (₹0.3 lakh crore). Banks drew down their excess CRR holdings (₹0.4 lakh crore) which also augmented liquidity. In terms of the management of liquidity, OMO sales and the increase in cash reserve balances (due to higher reserve base) sucked out liquidity from the system during H2:2022-23. Net average daily absorptions under the LAF moderated to ₹0.4 lakh crore during H2 from ₹3.3 lakh crore during H1 (Chart IV.32a). The net LAF slipped occasionally into deficit mode in H2, triggered by frictional pressures from festival-related currency demand, month-end GST outflows and quarterly advance tax payments. In this regard, net LAF injections increased to ₹1.05 lakh crore on March 17, 2023 – the highest since April 24, 2019 (₹1.42 lakh crore). Amidst waninig liquidity surplus, the amounts absorbed under the variable reverse repo rate (VRRR) auctions fell in H2; the average offer-cover ratio of the auctions was 0.26 was in H2 as compared with 0.40 in H1. Moreover, banks also took greater recourse to the marginal standing facility (MSF), with daily average borrowings of ₹8,438 crore during H2 as compared with ₹3,448 crore during H1 (Chart IV.32b). During 2022-23, MSF borrowings touched a high of ₹65,646 crore on October 24, 2022. The increased access to the MSF window, even as large surplus funds were placed under the SDF, reflected skewed liquidity distribution within the banking system. To meet liquidity requirements, the RBI conducted 14-day VRR auctions on February 10 and March 10, 2023 and a fine-tuning 5-day VRR auction on March 24. An amount of ₹5,000 crore was also made available to standalone primary dealers (SPDs) under the standing liquidity facility (SLF) on March 31, 2023 at the prevailing repo rate, with funds availed under this facility repayable on or before April 5, 2023. 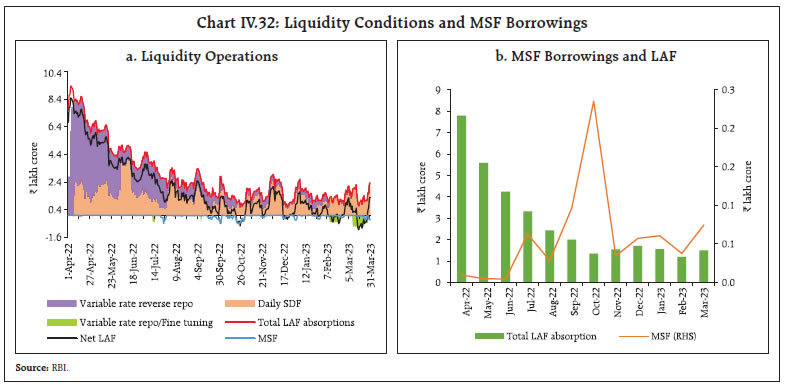 With the periodic policy rate hikes accompanied by the progressive normalisation of surplus liquidity, the WACR was closely aligned with the repo rate in H2 in contrast to H1 when surplus liquidity conditions had kept the WACR below the repo rate (Chart IV.33). Reserve money (RM) expanded by 10.0 per cent (y-o-y) as on March 24, 2023 as compared with 13.0 per cent at end-March 2022 (7.6 per cent adjusted for the first-round impact of the change in the CRR as against 10.3 per cent at end-March 2022). Money supply (M3) increased by 9.0 per cent (y-o-y) as on March 24, 2023 as compared with 8.8 per cent at end-March 2022 (Table IV.9).
| Table IV.9: Banking and Monetary Aggregates | | (Y-o-y growth, per cent) | | Indicator | March 2021 | March 2022 | March 2023 | | Reserve money | 18.8 | 13.0 | 10.0 | | (Adjusted for CRR changes) | (15.1) | (10.3) | (7.6) | | Broad money (M3) | 12.2 | 8.8 | 9.0 | | Currency with the public | 17.1 | 10.3 | 7.9 | | Aggregate deposits | 11.4 | 8.9 | 9.6 | | Demand deposits | 15.1 | 11.4 | 5.2 | | Time deposits | 10.9 | 8.6 | 10.2 | | Bank credit | 5.6 | 9.6 | 15.0 | Note: Data on deposit and credit growth pertain to scheduled commercial banks (SCBs).
Source: RBI. | Other Policy Measures With a view to enabling banks to better manage their investment portfolios, the dispensation of the enhanced held to maturity (HTM) limit of 23 per cent was extended by one year from March 31, 2023 to March 31, 2024. Banks were also allowed to include securities acquired between September 1, 2020 and March 31, 2024 in the enhanced HTM limit. The HTM limits would be restored from 23 per cent to 19.5 per cent in a phased manner from June 2024. As part of the calibrated move towards normal liquidity operations, market hours were restored from 9.00 am to 5.00 pm for call/notice/term money, commercial paper, certificates of deposit, repo in corporate bond segments of the money market and rupee interest rate derivatives in December 2022, and for the government securities market in February 2023. IV.4 Conclusion Domestic financial market conditions adjusted in H2:2022-23 to monetary tightening and ebbing liquidity while exhibiting resilience to global policy spillovers. Market rates firmed up at varying degrees across segments, instruments, and maturity spectrum. Bank credit offtake remained buoyant on resilient economic activity. Bank lending and deposit rates rose in tandem with monetary policy actions. The INR depreciated reflecting the strengthening US dollar and portfolio outflows. Going forward, the RBI will remain vigilant, agile, and nimble in its liquidity management operations to meet the productive requirements of the economy while mitigating the impact of global spillovers on domestic financial markets. __________________________________________________________________________________
V. External Environment The global economy is slowing under the impact of tighter financial conditions, high inflation, and the lingering conflict in Ukraine. Global financial markets have exhibited heightened volatility in response to the evolving inflation and financial stability developments, in particular, recent banking sector stress. Food and energy insecurity, financial stability concerns and risks of debt distress pose downside risks to the outlook for emerging market and developing economies. The global economy is slowing under the impact of tighter financial conditions, high inflation, and the lingering conflict in Ukraine. Consumer price inflation is ruling well above targets and is exhibiting persistence. In March, global financial markets were rattled by the failures/bailouts in the banking space which triggered extreme risk aversion, meltdowns, and flight to safety. Sovereign bond yields exhibited sizeable movements over the past six months – easing during November-January on expectations of less aggressive monetary tightening over softer inflation prints; hardening in February 2023 on stickier inflation and strong labour market conditions; and crashes across maturities in March on banking and financial stability concerns. Short-term yields recorded the sharpest single-day decline in decades in March. The US dollar weakened until January 2023, but it appreciated in February 2023. Global equity markets remained cautious with an upward bias up to February, with sharp corrections in mid-March. Looking ahead, food and energy insecurity, financial stability concerns and risks of debt distress pose downside risks to the outlook for emerging market and developing economies. V.1 Global Economic Conditions In H2:2022, global growth was stronger than anticipated, reflecting pent-up demand, accumulated household savings, labour market gains, easing supply bottlenecks and sharp corrections in energy prices. High frequency indicators for Q1:2023 point to an easing of the downturn in manufacturing and an uptick in service sector activity. The International Monetary Fund (IMF) in its World Economic Outlook (WEO) update of January 2023 revised up global growth projections for 2022 and 2023 by 20 basis points (bps) each to 3.4 per cent and 2.9 per cent, respectively1. Emerging out of two quarters of sequential contraction, the US economy grew by 3.2 per cent (quarter-on-quarter, seasonally adjusted annualised rates (q-o-q, saar)) in Q3:2022 and 2.6 per cent in Q4 (Table V.1). The improvement was driven by private inventory investment, consumer spending, non-residential fixed investment, government spending and exports. The labour market recorded strong gains, with the unemployment rate at a multi-decade low. Nominal wage growth was robust, albeit with some slowing down more recently. The US composite S&P Global Purchasing Managers’ Index (PMI2) at 50.1 in February 2023 signalled an end of a seven-month sequence of contraction. After growing by 1.5 per cent (q-o-q, saar) in Q3, real GDP in the Euro area stagnated in Q4 due to a decline in private consumption and investment, reeling under high inflation, tightening financial conditions and geopolitical tensions. The Eurozone composite PMI rose for the third consecutive month to 53.7 in March from the near two-year low in October 2022 driven by services sector. The unemployment rate fell to 6.6 per cent in February 2023 from 6.7 per cent in December 2022. | Table V.1: Real GDP Growth | | (Per cent) | | Country | Q1-2022 | Q2-2022 | Q3-2022 | Q4-2022 | 2021 | 2022 (E) | 2023 (P) | 2024 (P) | | Quarter-on-quarter, seasonally adjusted annualised rate (q-o-q, saar) | | Canada | 2.4 | 3.6 | 2.3 | 0.0 | | | | | | Euro area | 2.5 | 3.6 | 1.5 | -0.1 | | | | | | Japan | -1.8 | 4.7 | -1.1 | 0.1 | | | | | | South Korea | 2.6 | 3.0 | 1.3 | -1.6 | | | | | | UK | 2.0 | 0.2 | -0.4 | 0.5 | | | | | | US | -1.6 | -0.6 | 3.2 | 2.6 | | | | | | Year-on-year | | Advanced Economies | | Canada | 3.1 | 4.7 | 3.8 | 2.1 | 5.0 | 3.4 | 1.5 | 1.5 | | Euro area | 5.5 | 4.4 | 2.4 | 1.8 | 5.3 | 3.5 | 0.7 | 1.6 | | Japan | 0.5 | 1.7 | 1.5 | 0.4 | 2.1 | 1.0 | 1.8 | 0.9 | | South Korea | 3.0 | 2.9 | 3.1 | 1.3 | 4.1 | 2.6 | 1.7 | 2.6 | | UK | 10.6 | 3.8 | 2.0 | 0.6 | 7.6 | 4.1 | -0.6 | 0.9 | | US | 3.7 | 1.8 | 1.9 | 0.9 | 5.9 | 2.1 | 1.4 | 1.0 | | Emerging Market Economies | | Brazil | 2.4 | 3.7 | 3.6 | 1.9 | 5.0 | 2.9 | 1.2 | 1.5 | | China | 4.8 | 0.4 | 3.9 | 2.9 | 8.1 | 3.0 | 5.2 | 4.5 | | India | 4.0 | 13.2 | 6.3 | 4.4 | 9.1 | 7.0 | 6.1 | 6.8 | | Indonesia | 5.0 | 5.5 | 5.7 | 5.0 | 3.7 | 5.3 | 4.8 | 5.1 | | Philippines | 8.2 | 7.5 | 7.6 | 7.2 | 5.7 | 7.6 | 5.0 | 6.0 | | Russia | 3.5 | -4.1 | -3.7 | – | 5.6 | -2.1 | 0.3 | 2.1 | | South Africa | 2.8 | 0.3 | 4.2 | 0.9 | 4.9 | 2.0 | 1.2 | 1.3 | | Thailand | 2.2 | 2.5 | 4.6 | 1.4 | 1.5 | 2.6 | 3.7 | 3.6 | | Memo: | | World | 2021 | 2022 (E) | 2023 (P) | 2024 (P) | | Year-on-year | | World output | 6.2 | 3.4 | 2.9 | 3.1 | | World trade volume | 10.4 | 5.4 | 2.4 | 3.4 | E: Estimate P: Projection.
Note: India's data correspond to fiscal year (April-March); E.g., 2022 pertains to April 2022-March 2023.
Sources: Official statistical agencies, Bloomberg; and IMF WEO Update, January 2023. | In the UK, GDP contracted by 0.4 per cent in Q3:2022 (q-o-q, saar) and rose by 0.5 per cent in Q4. The fall in real household incomes due to elevated energy and goods prices weighed on consumer spending. The labour market remains tight with strong wage growth and a low unemployment rate. The UK composite PMI at 52.2 in March remained in expansion territory for the second consecutive month reflecting higher levels of business activity in both the manufacturing and the service sector. Japan’s GDP contracted by 1.1 per cent (q-o-q, saar) in Q3:2022, and the economy averted a recession with a meagre growth of 0.1 per cent in Q4 as a weak yen and higher import costs hurt consumption and businesses. The composite PMI (au Jibun Bank) rose from 48.9 in November, the lowest reading in H2:2022, to 52.9 in March registering the sharpest uptick since June 2022 driven by services activity, even as manufacturing sector remained subdued. Amongst EMEs, China's GDP growth rebounded to 3.9 per cent (year-on-year, y-o-y) in Q3:2022 from 0.4 per cent in Q2, supported by policy interventions and an easing of COVID-19 lockdowns (Table V.1). Growth decelerated to 2.9 per cent (y-o-y) in Q4 due to re-emergence of COVID-19 infections and lockdowns, dragging down the annual growth for 2022 to 3.0 per cent – below the target of 5.5 per cent (Table V.2). The composite PMI (Caixin) rose to 54.2 in February, supported by both manufacturing and services activity. In March, however, manufacturing PMI slowed to the neutral level of 50 signalling stable business conditions at the end of Q1:2023. The real GDP growth target for 2023 has been fixed at around 5 per cent, the lowest in more than three decades. Amongst other major EMEs, Brazil’s GDP growth decelerated from 3.7 per cent (y-o-y) in Q2:2022 to 3.6 per cent in Q3 and further to 1.9 per cent in Q4. Agriculture recorded contraction (y-o-y) in Q4. The labour market, which surprised positively throughout 2022, is easing, with a drop in net admissions to the payrolls. The composite PMI fell to 49.7 in February 2023 from 51.9 in September 2022, with both service and manufacturing activity turning down. The South African economy grew by 1.8 per cent (q-o-q, saar) in Q3:2022 and contracted by 1.3 per cent in Q4. In y-o-y terms, the economy grew by 4.2 per cent in Q3 and by 0.9 per cent in Q4. In Q1:2023, the composite PMI at 50.5 in February indicated a return to an expansion in output, after falling to a 13-month low of 48.7 in January. The Russian economy contracted by 3.7 per cent (y-o-y) in Q3:2022. The labour market remains tight with unemployment close to its all-time low. | Table V.2: Select Macroeconomic Indicators for BRICS | | Real GDP growth rate (y-o-y, per cent) | Country | 2021 | 2022(E) | 2023(P) | General Govt. gross debt (per cent of GDP) | Country | 2021 | 2022 (E) | 2023(P) | | Brazil | 5.0 | 2.9 | 1.2 | Brazil# | 93.0 | 88.2 | 88.9 | | Russia | 5.6 | -2.1 | 0.3 | Russia | 17.0 | 16.2 | 16.9 | | India | 9.1 | 7.0 | 6.1 | India | 84.2 | 83.4 | 83.8 | | China | 8.1 | 3.0 | 5.2 | China | 71.5 | 76.9 | 84.1 | | South Africa | 4.9 | 2.0 | 1.2 | South Africa | 69.0 | 68.0 | 70.7 | | CPI inflation rate (y-o-y, per cent) | Country | 2021 | 2022 | 2023(P) | Current account balance (per cent of GDP) | Country | 2021 | 2022(E) | 2023(P) | | Brazil | 8.3 | 9.3 | 4.7 | Brazil | -1.7 | -1.5 | -1.6 | | Russia | 6.7 | 13.8 | 5.0 | Russia | 6.9 | 12.2 | 11.1 | | India | 5.5 | 6.8 | 5.1 | India | -1.2 | -3.5 | -2.9 | | China | 0.9 | 2.0 | 2.2 | China | 1.8 | 1.8 | 1.5 | | South Africa | 4.6 | 6.9 | 5.1 | South Africa | 3.7 | 1.2 | -1.0 | | General Govt. net lending/borrowing (per cent of GDP) | Country | 2021 | 2022(E) | 2023(P) | Forex reserves* (US$ billion) | Country | 2021 | 2022 | 2023 | | Brazil | -4.4 | -5.8 | -7.5 | Brazil | 362.2 | 324.7 | 328.1 | | Russia | 0.8 | -2.3 | -2.1 | Russia | 630.6 | 582.0 | 597.0 | | India | -10.0 | -9.9 | -9.0 | India | 633.6 | 562.7 | 562.7 | | China | -6.1 | -8.9 | -7.2 | China | 3426.9 | 3306.5 | 3372.5 | | South Africa | -6.0 | -4.9 | -5.4 | South Africa | 57.8 | 60.6 | 61.9 | E: Estimate. P: Projection.
*: Forex reserves for 2023 pertain to January 2023 for all except Brazil and India (February).
#: Gross debt refers to the nonfinancial public sector, excluding Eletrobras and Petrobras, and includes treasury bill in the central bank's balance sheet.
Notes: India's data correspond to fiscal year (April-March) except data on forex reserves which are as per calendar year. India's inflation data for 2022 is from April 2022 - February 2023.
Sources: Official statistical agencies; WEO October 2022 database and January 2023 Update, IMF; Fiscal Monitor Update, October 2022, IMF; International Reserve and Foreign Currency Liquidity (IRFCL), IMF; and RBI. | The Southeast Asia region recorded a robust growth performance in Q3:2022 on revival of consumption and tourism before decelerating in Q4:2022. The ASEAN3 manufacturing PMI for February pointed to an improvement in operating conditions in the manufacturing sector as expansions in output and new orders gained momentum. Additionally, employment rose for the first time since October. The operating conditions continued to improve in March. Amongst high frequency indicators, the Organisation for Economic Co-operation and Development (OECD) composite leading indicators (CLIs) for January-February 2023 remained below trend for most economies (Chart V.1a). The global composite PMI at 52.1 in February returned to expansion – ending a six-month sequence of contraction – led by the services sector and the first expansion of manufacturing production since July 2022 (Chart V.1b). Manufacturing production continued to expand in March, albeit at a slower pace. 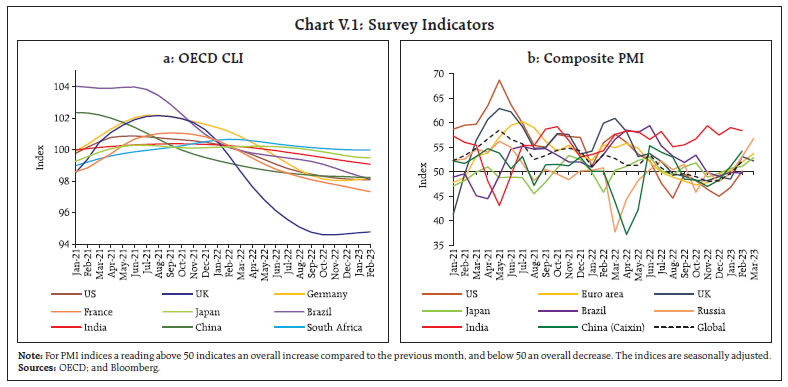 Weakening global demand led to subdued trade volumes, despite an easing of supply chain pressures. Merchandise trade volume declined by 0.3 per cent (y-o-y) in Q4:2022, and by a further 1.5 per cent in January 2023 (Chart V.2a). The Baltic Dry Index, which measures shipping costs for a wide variety of bulk commodities such as coal and iron ore, was 9.3 per cent higher in March 2023 than the pre-COVID average of 2019-20 (Chart V.2b). The goods trade barometer compiled by the WTO fell to 92.2 in December 2022 (96.2 in September), indicating a weakening growth in trade volumes in Q1:2023. The IMF in its WEO update (January 2023) forecast world trade (goods and services) volume growth to decelerate to 2.4 per cent in 2023 from 5.4 per cent in 2022. V.2 Commodity Prices and Inflation Global commodity prices remained volatile in Q4:2022 and Q1:2023. They initially increased by 5.4 per cent (in terms of the Bloomberg commodity price index) in the first half of Q4:2022, but continued to soften during the rest of Q4 and Q1:2023, touching January 2022 (the pre-Ukraine war) levels (Chart V.3a). Global food prices, according to the Food and Agriculture Organization (FAO), eased by 3.1 per cent in Q4:2022 and 1.5 per cent in Q1:2023 (up to February), driven by correction in the prices of meat, vegetable oil and dairy products (Chart V.3b). The prices of cereals moderated marginally whereas sugar prices increased. Crude oil prices softened during Q4 and Q1 but rose in early April following production cut announcement by the Organization of the Petroleum Exporting Countries (OPEC) amidst continuing volatility. A mild winter, weak industrial activity in Europe, COVID lockdowns in China, and winter blizzards in the US and Canada that disrupted holiday travel led to a contraction (y-o-y) in crude oil demand in Q4:2022 and lower prices (Chart V.3c). Natural gas prices softened significantly – by 77 per cent between their peak in August 2022 and March 2023 (according to World Bank’s natural gas index) – on a milder winter in Europe and weaker economic activity (Chart V.3c). Base metal prices edged up over the past six months, reflecting the weakening US dollar, decline in inventories, reopening of the Chinese economy and better-than-anticipated industrial growth in Europe. Gold prices rebounded on retreat of the US dollar from its two-decade high level and safe haven demand amidst a few bank failures in the US. Other metals like copper, aluminium, iron and steel also gained during Q4:2022 and Q1:2023 (Chart V.3d). Consumer Price Inflation Consumer price inflation remained elevated across economies due to sustained high core inflation, and cost push pressures from elevated food and energy prices. It has, however, come off from recent peaks due to softening energy prices, easing supply chain bottlenecks, and the unwinding of monetary and fiscal stimulus. The recent softening notwithstanding, headline inflation remains well above target across AEs and EMEs (Table V.3). Core inflation persistence reflects tight labour market and a low unemployment rate, especially for AEs. According to the IMF WEO (January 2023), global inflation is projected to moderate from 8.8 per cent in 2022 to 6.6 per cent in 2023 and 4.3 per cent in 2024 – still above the pre-pandemic (2017-19) average of 3.5 per cent. In the US, headline CPI inflation receded from its 40-year high of 9.1 per cent in June 2022 to 6.0 per cent in February 2023, driven down by decline in energy and food prices inflation. Over the same period, inflation in terms of the personal consumption expenditure (PCE) price index – the Federal Reserve (Fed)’s preferred measure of inflation – moderated from 7.0 per cent to 5.0 per cent (Chart V.4a), while core PCE inflation eased only modestly from 5.0 per cent to 4.6 per cent (Chart V.4b). In the Euro area, CPI inflation (Harmonised Index of Consumer Prices or HICP) eased to 6.9 per cent in March 2023 from its peak of 10.6 per cent in October 2022. The underlying measures have, however, hardened over the same period – core inflation (inflation excluding energy, food, alcohol and tobacco) increased to 5.7 per cent from 5.0 per cent and services inflation rose to 5.0 per cent from 4.3 per cent. In the UK, CPI inflation eased to 10.4 per cent in February 2023 from 11.1 per cent in October 2022, on lower price pressures in transport and restaurants and hotels. In Japan, CPI inflation soared to a 41-year high of 4.3 per cent in January 2023 from 3.0 per cent in September 2022, led by fuel, light and water charges4. It moderated to 3.3 per cent in February. | Table V.3: Consumer Price Inflation | | (Y-o-y, per cent) | | Country | Inflation Target | Q1:2022 | Q2:2022 | Q3:2022 | Q4:2022 | Q1:2023 | | Advanced Economies | | Canada | 2.0 | 5.8 | 7.5 | 7.2 | 6.7 | 5.6 | | Euro area | 2.0 | 6.1 | 8.0 | 9.3 | 10.0 | 8.0 | | Japan | 2.0 | 0.9 | 2.5 | 2.9 | 3.8 | 3.8 | | South Korea | 2.0 | 3.8 | 5.4 | 5.9 | 5.2 | 4.7 | | UK | 2.0 | 6.2 | 9.2 | 10.0 | 10.8 | 10.3 | | US | 2.0 | 8.0 | 8.7 | 8.3 | 7.1 | 6.2 | | | | (6.4) | (6.6) | (6.3) | (5.7) | (5.2) | | Emerging Market Economies | | Brazil | 3.25 ± 1.5 | 10.7 | 11.9 | 8.7 | 6.1 | 5.7 | | Russia | 4.0 | 11.5 | 16.9 | 14.4 | 12.2 | 11.4 | | India | 4.0 ± 2.0 | 6.3 | 7.3 | 7.0 | 6.1 | 6.5 | | China | | 1.1 | 2.2 | 2.7 | 1.8 | 1.6 | | South Africa | 3.0-6.0 | 5.8 | 6.6 | 7.6 | 7.4 | 7.0 | | Mexico | 3.0 ± 1.0 | 7.3 | 7.8 | 8.5 | 8.0 | 7.8 | | Indonesia | 3.0 ± 1.0 | 2.3 | 3.8 | 5.2 | 5.5 | 5.2 | | Philippines | 3.0 ± 1.0 | 3.3 | 5.5 | 6.5 | 7.9 | 8.3 | | Thailand | 1.0-3.0 | 4.7 | 6.5 | 7.3 | 5.8 | 3.9 | | Turkey | 5.0 ± 2.0 | 54.8 | 74.0 | 81.1 | 78.1 | 54.5 | | Memo: | | | 2021 | 2022 (E) | 2023 (P) | 2024 (P) | | World consumer price inflation | 4.7 | 8.8 | 6.6 | 4.3 | Notes: (1) Figures in parentheses for US are y-o-y change in personal consumption expenditure (PCE) price index.
(2) The Bank of Canada aims to keep inflation at the 2 per cent mid-point of an inflation control target range of 1-3 per cent.
(3) Brazil’s inflation target for 2022 was 3.50 ± 1.5 per cent.
(4) Inflation numbers for Q1:2023 are up to February 2023 except for Euro area, South Korea, Indonesia, Philippines, Thiland, and Turkey.
Sources: Central bank websites; and Bloomberg. |
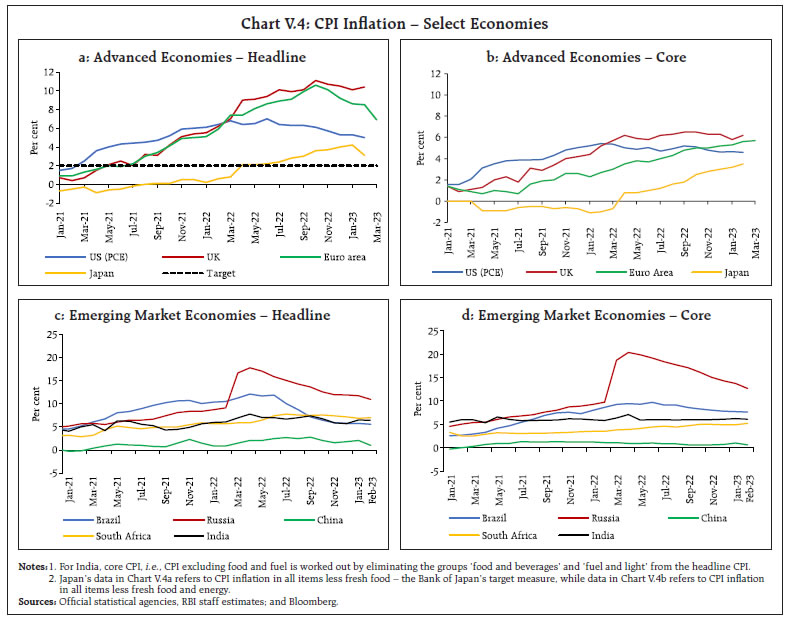 Amongst major EMEs, CPI inflation in Brazil moderated to 5.6 per cent in February 2023 from 7.2 per cent in September 2022 (Chart V.4c). In Russia, it eased to 11.0 per cent in February 2023 from 13.7 per cent in September, partly due to currency appreciation. In South Africa, CPI inflation softened to 7.0 per cent in February 2023 from 7.5 per cent in September. In China, headline inflation remained subdued, falling to 1.0 per cent in February 2023 from 2.8 per cent in September, due to weak demand. Core inflation in EMEs remained relatively stickier (Chart V.4d). V.3 Monetary Policy Stance During Q4:2022 and Q1:2023, central banks pivoted towards smaller rate hikes or a pause from the aggressive pace in the initial part of 2022, recognising that headline inflation is inching down but at a tardy pace and underlying inflation pressures remain relentlessly high. Heightened financial market volatility and financial stability concerns after the bank failures and bailouts have, however, added uncertainty to the future monetary policy trajectory. Starting in March 2022, the US Fed has hiked the target range for federal funds rate in all its subsequent policy meetings to tame inflation. In November 2022, the US Fed effected a 75 bps increase in the target range, its fourth successive 75 bps hike. It slowed the pace of tightening with hikes of 50 bps in December and 25 bps each in February and March 2023. Cumulatively, the US Fed has raised rates by 475 bps in the current tightening phase spread over one year – the fastest pace since the 1980s. According to the Summary of Economic Projections released in March 2023, the majority of FOMC participants expected the federal funds rate to be in the range of 5.0-5.25 per cent by end-2023. In the wake of turmoil in the banking sector, the US Fed in March announced a new lending facility, the Bank Term Funding Program (BTFP), to provide banks liquidity to meet the needs of all their depositors. The BTFP offers loans of up to one year against collateral including US Treasuries and other qualifying assets, which will be valued at par. Additionally, the Federal Reserve along with the Bank of Canada, the Bank of England, the Bank of Japan, the European Central Bank, and the Swiss National Bank announced on March 19, 2023 a coordinated action to enhance the provision of liquidity via the standing U.S. dollar liquidity swap line arrangements. The ECB increased its key rate by 75 bps, its second successive 75 bps hike, in October 20225. It toned down the pace of tightening with 50 bps hikes in December 2022, February and March 2023 each. In its December 2022 policy, the ECB also decided to reduce its asset purchase programme (APP) portfolio from the beginning of March 2023 at a pace of 15 billion per month on average until the end of the second quarter of 2023, with the subsequent pace of decline to be determined over time. It, however, intends to continue reinvesting maturing securities under its Pandemic Emergency Purchase Programme (PEPP) until at least the end of 2024. The Bank of England (BoE) raised its policy rate in the November 2022 meeting by 75 bps, followed by 50 bps in December and February 2023 each and 25 bps in March. The BoE started its gilt sales under £80 billion stock reduction programme on November 1, instead of the initial scheduled start of early October 2022. The postponement was due to the significant volatility in the UK financial markets in September. The BoE also wound down the emergency bond-buying scheme of £19 billion it had launched in September 2022 to restore orderly market conditions. Amongst other major AEs, the Bank of Canada raised its policy rate by 50 bps each in its October 2022 and December meetings, 25 bps in January 2023 and paused in March. After raising its cash rate target by 50 bps in September, the Reserve Bank of Australia scaled down its rate hike size to 25 bps each in its October, November, December 2022, February and March 2023 meetings. The Norges Bank slowed its pace of rate hike to 25 bps starting November 2022 meeting from the 50 bps hikes in its previous meetings. The Bank of Korea paused its rate hike cycle in February 2023 after more than one year of monetary tightening. The Czech National Bank has maintained pause since August 2022 after effecting a cumulative 325 bps rate hike in 2022 (Chart V.5a). The Bank of Japan continued to diverge from the other AEs by maintaining an accommodative stance. It expanded its tolerance range of 10-year Japanese Government bond yield fluctuations from ± 0.25 percentage points to ± 0.5 percentage points in its December 2022 policy meeting. Amongst EMEs, the Banco Central do Brasil maintained its policy rate at 13.75 per cent since the pause in September 2022. The South African Reserve Bank raised its policy rate by 75 bps in November 2022, 25 bps in January 2023 and 50 bps in March (Chart V.5b). The People’s Bank of China (PBoC) and the Bank of Russia (BoR) maintained accommodative stances, after rate cuts in August and September, respectively. The PBoC reduced the required reserve ratio (RRR) for financial institutions by 25 bps from March 27, 2023. 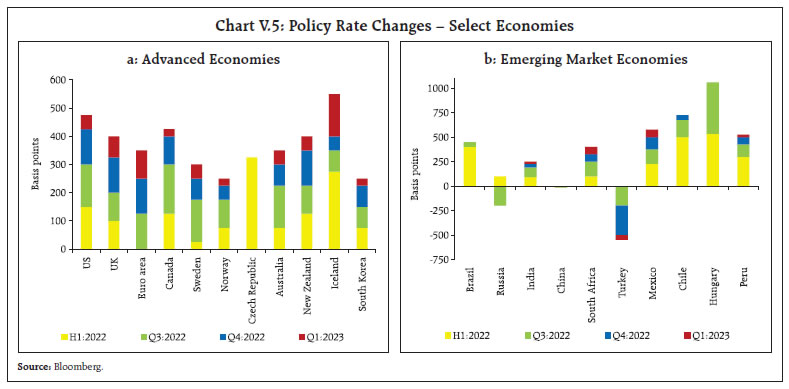 Amongst Asian EMEs, the Bank of Thailand which embarked on the tightening cycle in August 2022 raised rates by 25 bps in all its subsequent meetings. The Bank Indonesia increased its policy rate by 50 bps each in October and November 2022 and by 25 bps each in December 2022 and January 2023, with a pause since February. In Latin America, central banks of Mexico and Colombia slowed their pace of tightening to 25 bps in March 2023, while Chile and Peru have maintained a pause since December 2022 and February 2023, respectively. Among European EMEs, Hungary paused its hiking cycle in October 2022. The central bank of Turkey, on the other hand, cut its key policy rate by 150 bps each in October and November 2022 and by 50 bps in February 2023, even as inflation at 50.5 per cent in March 2023 was well above the target. V.4 Global Financial Markets Global financial markets witnessed large swings in Q4:2022 and Q1:2023, driven by fluctuating perceptions on the stickiness of inflation, the strength of economic activity and expectations relating to the monetary policy path. Since March 10, financial stability concerns following the collapse of a few banks in the US have imparted sizeable volatility to global financial markets: bond yields crashed; there has been a sharp correction in equity markets; and the expectations of further monetary tightening yielded to pause/rate cuts. In equity markets, the US S&P 500 generally rallied in Q4 and January on expectations of less aggressive US Fed actions amidst some fall in inflation and strong economic data. In February, the market corrected on concerns of more tightening and rates remaining higher for longer after the release of robust US non-farm payrolls and stronger inflation prints. The correction continued in March after bank failures, though it recouped losses by end of the month. Overall, the US S&P index rose by 14.6 per cent between October 2022 and March 2023. The Chicago Board Options Exchange Volatility Index (CBOE VIX) shot up to its highest level in 2023 on March 13 in response to bank collapses. The European stock market outperformed the US markets, over waning recessionary concerns and benefitting from the sharp decline in natural gas prices. 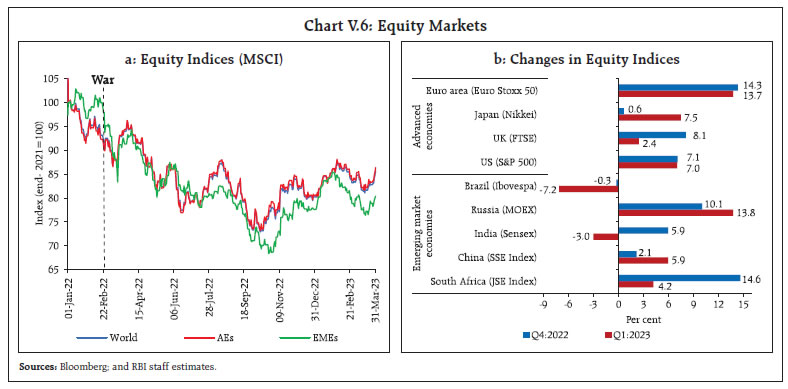 EME equities gained around 9 per cent in Q4:2022, similar to developed markets. In Q1:2023, equity markets in AEs rallied sharply vis-à-vis EME equity markets on expectation of a turn in the US Fed's monetary policy cycle. Portfolio outflows exerted downward pressures on equities in EMEs (Chart V.6). Given the prominent role of the US dollar in the international economy, US monetary policy surprises have a significant impact on global financial markets (Box V.1). Box V.1: US Monetary Policy Surprises and Global Financial Markets In 2022, the US Federal Reserve undertook aggressive monetary tightening, along with forward guidance of ‘higher for longer’, which impacted financial markets across segments and geographies. US monetary policy surprises can be proxied by the variations in the US overnight index swap rates (OIS) (Lloyd, 2018). Against this backdrop, an interest rate surprise is identified by a change in 3-month OIS rate. Its impact on global equities and bonds markets, both AEs and EMEs, is modelled using daily data as: where rt is the return on equity or bond index (in US$ terms); vixt is the JP Morgan global FX volatility index to capture global volatility; sentimentt is the global sentiment index; surprise is the difference of the 3-month OIS from its previous day closing. MSCI world, AE and EME equity indices are used for calculating equity returns for the respective stock markets, respectively, while FTSE Government and FTSE Emerging Markets bond indices are used for calculating returns on bonds. The empirical analysis focuses on the experience during 2022 and indicates that, controlling for volatility and the prevailing global sentiment, an unanticipated US monetary tightening reduces global equity as well as bond returns (Table V.1.1). As regards EMEs, their bond markets turn out to be sensitive to US monetary surprises – rising interest rate differentials in favour of the US can make EME debt assets less attractive and depress portfolio inflows. Under these circumstances, inflation management is complicated by the impossible trinity constraints and mobile capital flows seeking safe haven (Patra, 2022). | Table V.1.1: US Monetary Policy Surprises and Global Financial Markets | | Variables | Equity Markets | Bond Markets # | | World | AEs | EMEs | World | EMEs | | Surprise | -3.406***
(-3.75) | -3.936***
(-3.86) | -0.876
(-1.25) | -0.919**
(-2.28) | -1.052***
(-2.85) | | Return, lag 1 | -0.148***
(-2.64) | -0.194***
(-3.55) | 0.073
(1.42) | 0.061
(1.00) | 0.170*
(1.83) | | Return, lag 2 | -0.151***
(-2.97) | | | | | | Change in Volatility Index | -1.194***
(-4.23) | -1.282***
(-4.20) | -2.127***
(-6.76) | -0.084
(-0.63) | 0.097
(0.77) | | Change in World Sentiment Index | 8.720***
(-9.09) | 8.355***
(8.65) | 4.437***
(4.67) | 0.541
(1.29) | 0.343
(1.02) | | Constant | -0.021
(-0.33) | -0.001
(-0.02) | -0.042
(-0.65) | -0.063
(-1.99) | 0.007
(0.31) | | Adjusted R2 | 0.43 | 0.38 | 0.36 | 0.15 | 0.21 | | LM test (p-value) | 0.49 | 0.10 | 0.74 | 0.88 | 0.09 | Note: Figures in parentheses refer to t-values (using Newey-West standard errors).
***, **, * denote levels of significance at 1%, 5% and 10%, respectively.
#: Regressions include dummy variables to control for outliers.
Source: RBI staff estimates. | References: Lloyd, S. P. (2018), “Overnight Index Swap Market-Based Measures of Monetary Policy Expectations”, Bank of England Staff Working Paper No. 709. Patra, M. D. (2022), “Statement by Dr. Michael Debabrata Patra”, Minutes of the Monetary Policy Committee Meeting, September 28-30, 2022, Reserve Bank of India. | In Q4, sovereign bond yields across major AEs softened in November on signs of easing inflationary pressures and expectations of less aggressive rate hikes. Yields, however, raced up in December 2022, with the BoJ’s expansion of its tolerance range for 10-year Japanese Government bond yield fluctuations to ± 0.5 percentage points. In Q1:2023, moderating inflation across countries led to softening of yields in January. 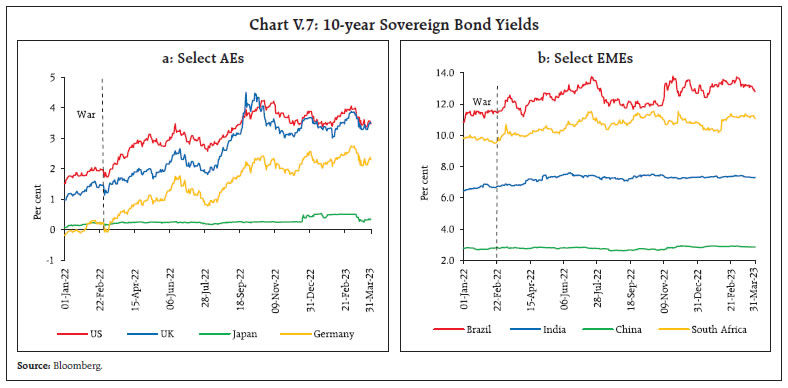
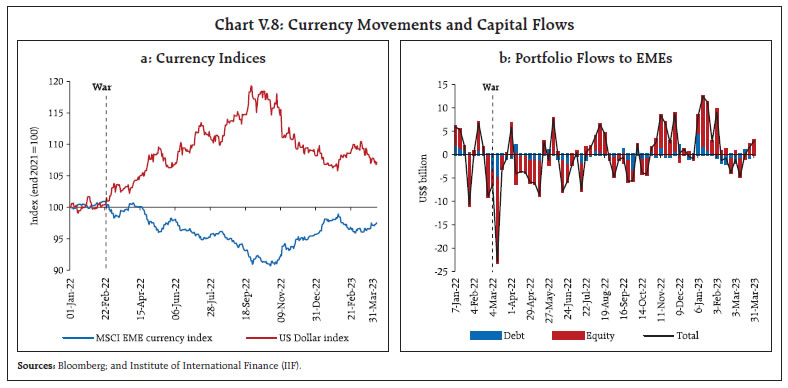 Yields, however, moved sharply higher in February on data showing sticky inflation and robust US retail sales and non-farm payroll gains. Yields fell precipitously in March as investors panicked and rushed towards safer assets amidst financial market turbulence caused by bank failures (Chart V.7a). The yield curve remained inverted in Q4 and Q1 over recession concerns and expectations of a turn in the monetary policy cycle. UK and German 10-year bond yields tracked the US markets. The Japanese bond yields remained range-bound, reflecting the yield curve control policy of the BoJ, barring the upward adjustment in the tolerance range in December. Bond yields in EMEs exhibited two-way movements, with a hardening bias driven by domestic monetary tightening as well as global cues (Chart V.7b). Chinese bond yields firmed up modestly despite monetary accommodation. In the currency markets, the US dollar reversed its rally in October – after hitting a two-decade high in September 2022 – on perceptions of the Fed stepping down from its aggressive policy tightening (Chart V.8a). However, tight labour market conditions and stronger-than-expected inflation data led the market to assess that the tightening cycle may last longer, strengthening the greenback in February. The US dollar treaded down in March on financial stability concerns and expectations that the Fed may be forced to reverse its tightening cycle. The US dollar dynamics were mirrored in the EME currencies, with the volatility exacerbated by capital outflows (Chart V.8b). The MSCI Emerging Market Currency Index gained 4.3 per cent in Q4:2022 and 1.9 per cent in Q1:2023. V.5 Conclusion The risks to the global growth outlook are tilted to the downside. The recent financial stability risks and global spillovers have imparted significant uncertainty to the economic outlook, as policymakers juggle between sticky inflation on the one hand and financial stability risks on the other. These developments are imparting sizeable volatility to global financial markets and generating large adverse spillovers on to emerging market economies through volatility in capital flows, currency movements and bond yields, posing downside risks to their growth prospects. __________________________________________________________________________________
ABBREVIATIONS | AEs | Advance Estimates | | AEs | Advanced Economies | | AIC | Akaike Information Criterion | | AIDC | Agriculture Infrastructure and Development Cess | | APP | Asset Purchase Programme | | AR | Autoregressive | | ASEAN | Association of Southeast Asian Nations | | ATF | Aviation Turbine Fuel | | ATM | At the money | | BCD | Basic Customs Duty | | BE | Budget Estimates | | BIES | Business Inflation Expectations Survey | | BoE | Bank of England | | BoJ | Bank of Japan | | BoR | Bank of Russia | | bps | Basis points | | BRICS | Brazil, Russia, India, China and South Africa | | BSE | Bombay Stock Exchange | | BTFP | Bank Term Funding Program | | CACP | Commission for Agricultural Costs and Prices | | CAG | Comptroller and Auditor General | | CBOE VIX | The Chicago Board Options Exchange Volatility Index | | CCIL | Clearing Corporation of India Limited | | CD | Certificate of Deposit | | CDS | Credit Default Swap | | CGTMSE | Credit Guarantee Fund Trust for Micro and Small Enterprises | | CI | Confidence Interval | | CiC | Currency in Circulation | | CII | Confederation of Indian Industry | | CLI | Composite Leading Indicator | | CMIE | Centre for Monitoring Indian Economy | | COVID-19 | Coronavirus Disease 2019 | | CP | Commercial Paper | | CPB | Central Planning Bureau | | CPI | Consumer Price Index | | CPI-AL | Consumer Price Index for Agricultural Labourers | | CPI-IW | Consumer Price Index for Industrial Workers | | CPI-RL | Consumer Price Index for Rural Labourers | | CRR | Cash Reserve Ratio | | CSI | Current Situation Index | | CU | Capacity Utilisation | | DCA | Department of Consumer Affairs | | DGCA | Directorate General of Civil Aviation | | DGCI&S | Directorate General of Commercial Intelligence and Statistics | | DI | Diffusion Index | | DII | Domestic Institutional Investor | | EBIT | Earnings Before Interest and Taxes | | EBLR | External Benchmark Based Lending Rate | | ECB | European Central Bank | | ECB | External Commercial Borrowing | | ECI | Eight Core Industries | | ECLGS | Emergency Credit Line Guarantee Scheme | | EIA | Energy Information Administration | | EMDEs | Emerging Market and Developing Economies | | EMEs | Emerging Market Economies | | EPFO | Employees’ Provident Fund Organisation | | FAO | Food and Agriculture Organization | | FBIL | Financial Benchmarks India Pvt. Ltd | | FCI | Financial Conditions Index | | FDI | Foreign Direct Investment | | Fed | Federal Reserve | | FEI | Future Expectations Index | | FICCI | Federation of Indian Chambers of Commerce and Industry | | FIMMDA | Fixed Income Money Market and Derivatives Association of India | | FI | Financial Institution | | FMCG | Fast-Moving Consumer Good | | FOMC | Federal Open Market Committee | | FPI | Foreign Portfolio Investment/Investor | | FRE | First Revised Estimate | | FRRR | Fixed Rate Reverse Repo | | F-TRAC | FIMMDA Trade Reporting and Confirmation System | | FTSE | Financial Times Stock Exchange | | GCF | Gross Capital Formation | | GDP | Gross Domestic Product | | GFCE | Government Final Consumption Expenditure | | GFCF | Gross Fixed Capital Formation | | GFD | Gross Fiscal Deficit | | GM | Genetically Modified | | GMM | Generalised Method of Moments | | GNDI | Gross National Disposable Income | | GoI | Government of India | | GSDP | Gross State Domestic Product | | G-Secs | Government Securities | | GST | Goods and Services Tax | | GVA | Gross Value Added | | H1 | First Half of the Financial Year (April- September) | | H2 | Second Half of the Financial Year (October-March) | | HFI | High Frequency Indicator | | HICP | Harmonised Index of Consumer Prices | | HSD | High-Speed Diesel | | HTM | Held to Maturity | | ICIO | Inter Country Input Output | | ICR | Interest Coverage Ratio | | IIF | Institute of International Finance | | IIP | Index of Industrial Production | | IMF | International Monetary Fund | | INR | Indian Rupee | | IOCL | Indian Oil Corporation Limited | | IOT | Input Output Table | | IPO | Initial Public Offering | | IRDAI | Insurance Regulatory and Development Authority | | IRFCL | International Reserves and Foreign Currency Liquidity | | IT | Information Technology | | JSE | Johannesburg Stock Exchange | | LAF | Liquidity Adjustment Facility | | LCR | Liquidity Coverage Ratio | | LFPR | Labour Force Participation Rate | | LHS | Left Hand Side | | LM | Lagrange Multiplier | | LMT | Lakh Metric Tonnes | | LPG | Liquefied Petroleum Gas | | MCLR | Marginal Cost of Funds Based Lending Rate | | MFs | Mutual Funds | | MGNREGA | Mahatma Gandhi National Rural Employment Guarantee Act | | MMRP | Modified Mixed Reference Period | | MOAFW | Ministry of Agriculture and Farmers’ Welfare | | MOEX | Moscow Exchange | | m-o-m | Month-on-Month | | MOSPI | Ministry of Statistics and Programme Implementation | | MPC | Monetary Policy Committee | | MPR | Monetary Policy Report | | MRO | Main Refinancing Operation | | MSCI | Morgan Stanley Capital International | | MSF | Marginal Standing Facility | | MSME | Micro, Small and Medium Enterprise | | MSP | Minimum Support Price | | NBFCs | Non-Banking Financial Companies | | NCAER | National Council of Applied Economic Research | | NDS | Negotiated Dealing System | | NDTL | Net Demand and Time Liabilities | | NEER | Nominal Effective Exchange Rate | | NPA | Non-Performing Asset | | NSC | National Savings Certificate | | NSDL | National Securities Depository Limited | | NSO | National Statistical Office | | NSSO | National Sample Survey Office | | OECD | Organisation for Economic Co-operation and Development | | OIS | Overnight Index Swap | | OMCs | Oil Marketing Companies | | OMO | Open Market Operation | | OPEC | Organization of the Petroleum Exporting Countries | | OTC | Over-the-Counter | | PADO | Public Administration, Defence and Other services | | PBoC | People’s Bank of China | | PCE | Personal Consumption Expenditure | | PDS | Public Distribution System | | PEPP | Pandemic Emergency Purchase Programme | | PFCE | Private Final Consumption Expenditure | | PMGKAY | Pradhan Mantri Garib Kalyan Anna Yojana | | PMI | Purchasing Managers’ Index | | POL | Petroleum, Oil and Lubricants | | POSOCO | Power System Operation Corporation Limited | | PPAC | Petroleum Planning and Analysis Cell | | PPP | Public Private Partnership | | PSB | Public Sector Bank | | PSU | Public Sector Undertaking | | PvB | Private Sector Bank | | Q1 | First Quarter | | Q2 | Second Quarter | | Q3 | Third Quarter | | Q4 | Fourth Quarter | | q-o-q | Quarter-on-Quarter | | QPM | Quarterly Projection Model | | RBI | Reserve Bank of India | | RE | Revised Estimates | | REER | Real Effective Exchange Rate | | RHS | Right Hand Side | | RL | Rural Labourers | | RRR | Required Reserve Ratio | | S&P | Standard and Poor | | SAAR | Seasonally Adjusted Annualised Rate | | SAE | Second Advance Estimate | | SCB | Scheduled Commercial Bank | | SDF | Standing Deposit Facility | | SEBI | Securities and Exchange Board of India | | SGS | State Government Securities | | SIAM | Society of Indian Automobile Manufacturers | | SIBC | Sector-wise and Industry-wise Bank Credit | | SIC | Schwarz Information Criterion | | SIP | Systematic Investment Plan | | SLR | Statutory Liquidity Ratio | | SSE | Shanghai Stock Exchange | | SSI | Small Savings Instruments | | STU | Stocks-to-Use | | SVAR | Structural Vector Auto Regression | | TBs | Treasury Bill | | TLTROs | Targeted longer-term refinancing operations | | TREPS | Tri Party Repo Dealing System | | TRQ | Tariff Rate Quota | | UAE | United Arab Emirates | | UK | United Kingdom | | US | United States | | US$ | US Dollar | | USA | United States of America | | VAR | Vector Autoregression | | VAT | Value Added Tax | | VRR | Variable Rate Repo | | VRRR | Variable Rate Reverse Repo | | WAC | Weighted Average Coupon | | WACR | Weighted Average Call Money Rate | | WADR | Weighted Average Discount Rate | | WADTDR | Weighted Average Domestic Term Deposit Rate | | WALR | Weighted Average Lending Rate | | WAM | Weighted Average Maturity | | WAR | Weighted Average Rate | | WEO | World Economic Outlook | | WMA | Ways and Means Advances | | WPI | Wholesale Price Index | | WTO | World Trade Organization | | y-o-y | Year-on-Year | |