Issued for Discussion DRG Studies Series Development Research Group (DRG) has been constituted in Reserve Bank of India in its Department of Economic and Policy Research. Its objective is to undertake quick and effective policy-oriented research backed by strong analytical and empirical basis, on subjects of current interest. The DRG studies are the outcome of collaborative efforts between experts from outside Reserve Bank of India and the pool of research talent within the Bank. These studies are released for wider circulation with a view to generating constructive discussion among the professional economists and policy makers. Responsibility for the views expressed and for the accuracy of statements contained in the contributions rests with the author(s). There is no objection to the study published herein being reproduced, provided an acknowledgement for the source is made that the study was funded by the Reserve Bank of India under the DRG Study Series. The reproduced study should not contradict the findings of the original DRG study. Further, the reproduced study may be published with the same set of authors as the original DRG study. DRG Studies are published in RBI web site only and no printed copies will be made available. Director
Development Research Group |
Determinants of Financial Literacy and Financial
Inclusion in North-Eastern Region of India:
A Case Study of Mizoram by Bhartendu Singh1
Raj Rajesh
Ramesh Golait
K. Samuel L. Abstract The present study evaluates the determinants of the status of financial inclusion and financial literacy in the under-banked North-Eastern Region of India based on field survey-data in the State of Mizoram. The survey indicated that there was limited financial awareness in the study region, about 32 per cent of the respondents were not aware of any financial products except the savings bank account. About 20 per cent of the respondents reported lack of knowledge of the basic payment options and about 43 per cent of the respondents reported knowledge but lack of usage of these options. About half of the respondents were found to be unaware of the financial institutions other than banks, viz., non-banking financial companies, microfinance institutions and small finance banks. It was also found that use of life insurance products was low among respondents. The financial inclusion score and financial literacy score for the study region were generated using the OECD/INFE (Organisation for Economic Co-operation and Development/ International Network on Financial Education) Toolkit for measuring financial literacy and financial inclusion. The average financial literacy score estimated in the study was 14.37 on a scale of 0 to 21 (i.e., 68.43 per cent) and the average financial inclusion score was 3.35 on a scale of 0 to 7 (i.e., 47.86 per cent). Several factors based on the literature were identified and tested in terms of their effect on financial inclusion and financial literacy using suitable econometric techniques, including a logistic regression framework. Among the identified factors, the place of residence (block), employment type and nature of family (joint versus nuclear) of the respondents were seen to strongly influence their financial inclusion and financial literacy status. JEL Codes: G2, G18, G29, G21, G23 Keywords: Financial institutions and services, government policies and regulations, banks, financial institutions
Acknowledgement The authors are profoundly grateful to the Local Board for Eastern Area, RBI for conceptualisation of the study. The authors take this opportunity to extend their thanks to the participants of the Department of Economic and Policy Research (DEPR) Study Circle seminar of RBI for useful comments on an earlier draft of the study. Authors are also grateful to an anonymous external referee for very detailed suggestions and generous comments on the study. The authors would also like to thank Dr. Deba Prasad Rath, Principal Adviser, DEPR for insightful suggestions and encouragement. Authors would also like to thank Dr. Pallavi Chavan, Director, DRG, DEPR, and her team members for their comments and support throughout the study. Nonetheless, the views expressed in this study are those of the authors alone and not of the organisations they are attached to. The authors only are responsible for errors and omissions, if any. Bhartendu Singh
Raj Rajesh
Ramesh Golait
K. Samuel L.
Executive Summary Financial inclusion relates to the access to financial products and services. It is not limited to the basic access to deposits, but extends to the access to various financial services, including investments, credit, payments and insurance. Financial literacy provides basic knowledge and skills to analyse and understand financial products and services and assists in taking informed financial decisions. Financial inclusion without financial literacy may lead to exploitation as consumers may not be in a position to choose the right products and may end up taking uninformed decisions. On the other hand, financial literacy without financial inclusion is akin to providing skills without an opportunity to apply the same. In the long run, however, financial literacy takes people closer towards financial inclusion as there is a high likelihood that an aware person will seek access to finance and also achieve it. Against this backdrop, the present study was conceived to look into various factors impacting financial literacy and financial inclusion in the north-east taking Mizoram as the site of the study. The study is based on primary data collected through a structured questionnaire. Total 523 respondents were selected from eight blocks, covering four districts, of Mizoram. The factors2 identified for the study are based on extensive review of the literature and the existing financial situation in Mizoram. The survey indicated that there was a limited financial awareness in the study region. About 32 per cent of the respondents were not aware of any financial products except the savings bank account. About 20 per cent of the respondents reported lack of knowledge of the basic payment options and about 43 per cent of the respondents reported knowledge but lack of usage of these options. About half of the respondents were found to be unaware of the financial institutions other than banks, viz., non-banking financial companies, microfinance institutions and small finance banks. It was also found that use of life insurance was low among respondents. The financial inclusion score and financial literacy score for the study region was generated using the OECD/INFE (Organisation for Economic Co-operation and Development/ International Network on Financial Education) Toolkit for measuring financial literacy and financial inclusion. The average financial literacy score estimated in the study was 14.37 on a scale of 0 to 21 (i.e., 68.43 per cent). The average financial inclusion score was found to be 3.35 on a scale of 0 to 7 (i.e., 47.86 per cent). Out of 27 factors considered for the study as possible determinants of financial inclusion and financial literacy, the place of residence (block) was found to have large effect on both. Besides this, the type of employment and type of family (joint versus nuclear) also moderately influenced financial literacy. The subjects studied by the respondents as part of academic curriculum were also found to have moderate effect on financial inclusion. The financial literacy and financial inclusion were found to have a negligible effect on each other. The relatively lower level of economic development, particularly financial development in the north-eastern region (NER), as reflected in relatively lower credit intermediation, is a major concern from policy perspective. In this context, the study highlights the need to conduct a greater number of financial literacy workshops, especially for the people belonging to the vulnerable groups at regular intervals in the region. Moreover, the development and outcome of such workshops need to be closely monitored by the funding agencies.
Determinants of Financial Literacy and Financial Inclusion
in North-Eastern Region of India: A Case Study of Mizoram Introduction Financial literacy provides basic knowledge and skills to analyse and understand financial products and services and assists in taking informed financial decisions. Financial inclusion relates to the access to financial products and services. It is not limited to the basic access to deposits, but extends to the access to various financial services, including investments, credit, payments and insurance. Financial inclusion without financial literacy may lead to exploitation as consumers may not be in a position to choose the right products and end up taking uninformed decisions. On other hand, financial literacy without financial inclusion is akin to providing skills without an opportunity to apply the same. In the long run, however, financial literacy takes people closer towards financial inclusion as there is a high likelihood that a financially aware person will seek access to finance and also achieve it. The Organisation of Economic Cooperation and Development (OECD) defines financial literacy as a combination of financial awareness, knowledge, skills, attitude and behaviour necessary to make sound financial decisions and ultimately achieve individual financial well-being. People achieve financial literacy through a process of financial education. According to the Reserve Bank’s ‘Committee on Financial Inclusion’ (Chairman: Dr. C. Rangarajan) (RBI, 2008), financial inclusion is the process of ensuring access to financial services, timely and adequate credit for vulnerable groups such as weaker sections and low-income groups at an affordable cost. Financial literacy and financial inclusion are associated with each other. While there may be a positive correlation between the two, it is interesting to know if these two share a causal relation. It has been found in few studies that people who are financially included are not necessarily financially literate and many otherwise financially literate people are actually not financially included. Different studies in different places have arrived at contradictory findings, like there are studies which concluded that financial education results into higher savings for an individual in his/her lifespan later (Bernheim et al., 1997; Lusardi, 2003). However, some other studies could not find conclusive evidence that financial education improves personal financial decisions (Mandell, 2006; O’Connell, 2008). In the light of these contradictory results, it is interesting to know the other factors that have positive or negative impact on financial inclusion and financial literacy. The North Eastern Region (NER) of India, comprising eight States namely, Arunachal Pradesh, Assam, Manipur, Meghalaya, Mizoram, Nagaland, Tripura and Sikkim, is characterised with a unique socio-cultural segment and predominantly semi-urban and rural areas encompassing hilly geographic terrain. The NER, home to 3.8 per cent of the national population, occupies about 8 per cent of India’s total geographical area, and is strategically important with over 5,300 km of international borders. Economic activity and banking parameters of the NER States, however, have remained unfavourable vis-à-vis all-India figures. At the same time, there remains a significant diversity in the level of development among the north-eastern States. The Government of India, Reserve Bank of India and the respective State governments have been making special efforts for an all-round development of the region. Recognising the critical role of financial sector in economic development, and to investigate the issues limiting the success in achieving financial inclusion in NER, the Reserve Bank constituted a committee on ‘Financial Sector Plan for NER’ (Chairperson: Smt. Usha Thorat, 2006). Further, to address the issues related to development of the Micro, Small and Medium Enterprises (MSMEs) sector in NER, a separate sub-group was constituted under the Prime Minister’s task force on MSMEs (Chairman: Shri T.K.A. Nair) in 2009. It was also emphasised in the literature that financial inclusion and development of NER holds the key to balanced regional economic prosperity (Rajan, 2016). The relatively low level of economic development, in general, and financial development in particular, of NER, as reflected in relatively lower credit intermediation, is a major concern from policy perspective. In this context, the rest of the study is organised as follows: Section 2 lays out the objectives and rationale for choosing the State of Mizoram for the study. Section 3 highlights the socio-economic profile of the State. Section 4 presents the literature review. Section 5 provides the banking landscape of Mizoram economy. Section 6 presents empirical results and Section 7 concludes the study. 2. Objectives and Rationale for Choosing Mizoram for the Study The objectives of this study are set out as follows: -
To understand the architecture and ecosystem of Mizoram’s economy using secondary data; -
To estimate the financial inclusion score of the State; -
To analyse the factors, which determine financial inclusion in the State; -
To estimate the level of financial literacy in the State; -
To analyse the factors, which determine financial literacy in the State; -
To assess public awareness about various government schemes (such as Direct Benefit Transfer (DBT), Pradhan Mantri Mudra Yojana (PMMY), PM Jan Dhan Yojna (PMJDY), etc.). As per CRISIL (2018) Inclusix Score, North East Region (NER) is the least financially included region of India. Mizoram stood 31st among all the States in India by CRISIL Inclusix Score, though it is one of the most urbanised States of India. At the time of the survey conducted by CRISIL, out of eight districts, seven were ranked below 440 among all the districts of India. The capital of the State, Aizawl, stood at 294th in rank. Interestingly, Mizoram is found to enjoy high branch penetration and above-average credit and deposit penetration as compared to other States. Further, as per the Census of India 2011, it is the second-most literate State in India whereas as second-least financially literate State as per National Centre for Financial Education Report, 2013. The banking development in NER, including Mizoram, is a phenomenon post-bank nationalisation in 1969. Prior to it, no bank branch of commercial bank existed in Mizoram. In the year 1972, when it was accorded the status of a Union Territory, the whole of the State was served by a single branch of State Bank of India (SBI). Even today, the banking penetration remains highly skewed in terms of location. Furthermore, unlike other States, only one regional rural bank (RRB) serves whole of the State. The studies focusing on financial inclusion and financial literacy in the State are less in number. All these aspects make the State an interesting case study to understand the factors influencing financial inclusion and financial literacy in a hilly State with a difficult geographical terrain. 3. Socio-Economic Profile of Mizoram The State is situated in the southern corner of NER. The word ‘Mizoram’ is a combination of two words of local language, viz., Mizo and Ram. The word “Mizo” means ‘native inhabitants’ while “Ram” means ‘land’, thus “Mizoram” means ‘land of the Mizos’. It was known as Lushai Hills District of Assam till 1954 and then was renamed as Mizo Hills District of Assam until 1972, when it was carved out and given the status of a Union Territory. It continued as a Union Territory until 1987, when it was declared as the 23rd State of India on February 20, 1987 by the 53rd Amendment of the Indian Constitution. 3.1 History and Geography of Mizoram Mizoram is a land-locked State sharing its borders with three Indian States, viz., Tripura (277 Kms) in the northwest, Assam (123 Kms) in the north and Manipur (95 Kms) in the northeast. It shares its boundary with two neighbouring countries, viz., Myanmar (404 Kms) in the east and south and Bangladesh (318 Kms) in the west. It had three districts when it was given the status of a State (1987), viz., Aizawl, Lunglei and Lawngtlai. In the year 1998, five new districts were created, viz., Kolasib, Mamit, Serchhip, Champhai (carved out of Aizawl) and Saiha (carved out of Lawngtlai). Recently on June 03, 2019, three new districts were added, viz., Hnahthial (carved out of Lunglei), Khawzawl (carved out of Champhai) and Saitual (carved out of Aizawl and Champhai). About 95 per cent of population in State is of diverse tribal origins, mostly from Southeast Asia, who were settled over waves of migration since 16th century but mainly in 18th century. It has the highest concentration of tribal people among all States in India, and they are currently protected under the Indian constitution as a Scheduled Tribe. The tribes adopted Christianity over the first half of 20th century. Now, it is one of the three States of India with a Christian majority (87 per cent). Its people belong to various denominations, mostly Presbyterian in north and Baptists in south. It is a highly literate agrarian economy; however, it suffers from slash-and-burn jhum or shifting cultivation, and poor crop yields. In recent years, the jhum farming practices are steadily being replaced with a significant horticulture and bamboo products industry. The State has about 871 kilometres of national highways, with NH-54 and NH-150 connecting it to Assam and Manipur respectively. It is also a growing transit point for trade with Myanmar and Bangladesh. It is a land of rolling hills, valleys, rivers and lakes. As many as 21 major hill ranges or peaks of different heights run through the length and breadth of the State. As per the State of Forest Report, Mizoram has the highest forest cover as a percentage of its geographical area, i.e., 84.5 per cent. The fabric of social life in the Mizo society has undergone tremendous changes over years. Before the British moved into the hills, the village and the clan formed units of Mizo society for all practical purposes. Mizos are giving up their old customs rapidly and adopting new modes of life, which is greatly influenced by the western culture. Many of their present customs are mixtures of their old traditions and western pattern of life. 3.2 Architecture of the Mizoram Economy: A Sectoral Analysis In line with the trend in structural shift in other States, the share of agriculture has declined and the share of industry and services sector in gross state value added (GSVA) has picked up (Chart 3.1). Within the agriculture sector, ‘forestry and logging’ (accounting for more than half of the agriculture and allied sector) dominates and its share has expanded in the last couple of years with a corresponding shrinkage in the share of crops, livestock and fishing and aquaculture (Chart 3.2). Mizoram is richly endowed with bamboo forests, which broadly cover half of the State’s land. It has the largest bamboo cover as a proportion of its geographical area in the country. It produces a variety of bamboo-based handicraft products and exports bamboo and teak wood to Bangladesh. The handloom production, estimated to be Rs.6 crore, generates several non-farm employment. It has great potential for export under the Look East Policy of the Government of India, given the similarity of fabrics being worn by the inhabitants of the South East Asian countries as produced by local weavers of the State. In line with the all-India trend, despite the decline in the share of agriculture in GSVA, the State economy is primarily agrarian with 60 per cent of the population depending, directly or indirectly, on agriculture. Rest of the working population is engaged in government jobs, small businesses and transport activities. Within the industrial sector, ‘electricity, gas, water supply and other utility services’ dominates with 56.4 per cent share in the industrial sector followed by ‘construction’ with 39.8 per cent share in 2019-20 (Chart 3.3). Manufacturing constitutes around 0.7 per cent of the GSVA, while mining constitutes around 0.3 per cent of GSVA. Within the industrial sector, the share of manufacturing, mining and construction has been shrinking in the last couple of years, while that of ‘electricity, gas, water supply and other utility services’ has been expanding. As per the sectoral composition, services sector activity dominates the State economy as it accounts for nearly half of the GSVA (Chart 3.4). The service sector is dominated by public administration, which constitutes around 30 per cent of the services sector followed by trade, repair, hotels and restaurants. The overall GSVA growth in the State has been highly volatile in line with the growth of the constituent sectors, which have exhibited marked year-to-year variation (Chart 3.5). Mizoram remains distinct from other north-eastern States in terms of economic development, the second highest per capita income followed by Sikkim in the NER. In line with its elevated level of per capita income, its poverty level is lower than the national average (Chart 3.6). 3.2.i Agriculture Agriculture is the mainstay of the people of Mizoram (Savant and Patnaik, 1998). About 90 per cent of the farmers in the State are small and marginal farmers3. The average size of land holding of the farmers is 1.25 hectares. Jhum or shifting cultivation is the main agricultural practice and it is carried out annually by a large number of people living in rural areas. The productivity of this type of agriculture is comparatively lesser than the national average. The performance of area, production and yield of major food-grains in the State suggests a mixed trend (Chart 3.7). Rice, coarse cereals and pulses are the main crops. Food grain production, at 76.9 thousand tonnes (in 2019-20), is the least amongst the NER States. It constituted merely one per cent of the total food grain production of the region. The State has total geographical area of 2,108,700 ha of which net sown area is 218,608 ha (10.4 per cent of total geographical area). The average of gross and net sown area for the last five years in Mizoram has changed in tandem with NER (Chart 3.8). 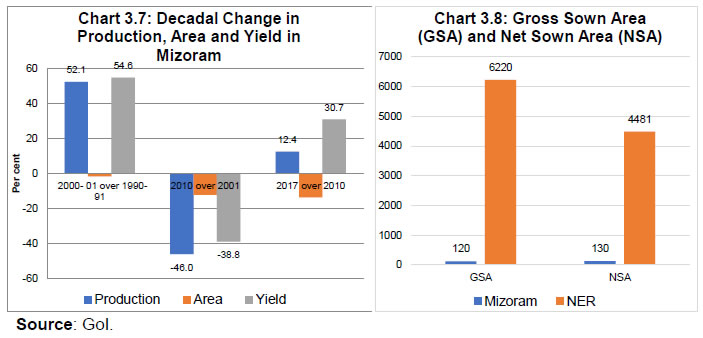 Net irrigated area in the State is 18,813 ha, which is just 8.6 per cent of total sown area. Major and medium irrigation is a challenge due to the hilly terrain. Although Mizoram receives sufficient rainfall during monsoon, only small areas of fertile land can be brought under cultivation during rabi season due to lack of enough water harvesting structures. Concerted efforts are required to increase soil moisture retention capacity, create irrigation facilities like tube wells, rainwater-harvesting structures and other water bodies for life saving irrigation during dry season. The State is blessed with an abundant rainfall, but its porous soil and inadequate irrigation infrastructure has affected its crop yield. The yield issue can be addressed by creating irrigation infrastructure and adoption of better crop technologies. Chart 3.9 shows that the State also has very low consumption of fertilisers and pesticides. 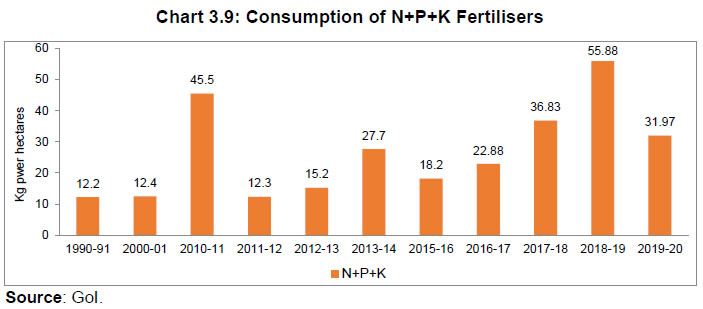 Farm mechanisation on an extensive scale is not feasible in the State due to hilly terrain, limited flat land, fragmented land holdings and poor road connectivity. Consequently, use of tractors and power tillers, adoption of new cropping pattern and efficient utilisation of available irrigation facilities are not being utilised at desired level for increasing the agricultural production in the State. Given the by and large subsistence nature of farming, the requirements of credit by agricultural households are meagre. As per the NSSO’s survey, agricultural households in Mizoram met about 86 per cent of their loan needs from institutional sources (Chart 3.10). This contrasts with some of the other NER States such as Manipur wherein the informal sources formed a significant chunk of credit (Chart 11). Integrated farming system is used mostly in the hilly farming system where resources are well managed through a combination of crop, livestock and fishery farming. Almost 60 per cent of households rear livestock mainly for nutritional, manure and additional income generation purpose. The production system in the villages is traditional, mainly based on indigenous breeds. The State has a great potential for the development of horticulture. More than 60 per cent of the population of Mizoram depends on land-based activities for their livelihood and horticulture plays a vital role covering 1.50 lakh Ha of plantation. The moderate slopes and geo-climatic situation offer excellent scope for growing wide variety of horticulture crops including fruits, vegetables, spices, plantation crops, medicinal and aromatic plants of high economic value. Recently, horticulture and floriculture has gained momentum and shown marked improvement in their productions. Major horticultural crops in the State are orange, banana, pineapple, passion fruit, areca nut, ginger, turmeric, bird’s eye chili, jackfruit, etc. which are marketed through various channels including sales in local markets, pre-harvest private contracts and sale to outside traders for marketing outside the State. Post-harvest handling, value addition through processing and market access are the major issues for development of this sector in the State. It holds the record of being the only State to successfully produce dragon fruit, a cactus like fruit imported from Thailand and Vietnam. It also exports anthurium, a decorative plant commonly known as lace leaf, to different States. The varied climatic conditions also facilitate sericulture viz., mulberry, eri, muga and tasar. The State is well-suited for organic farming, which is not only environment-friendly, but also beneficial for the farmers as it fetches higher price for the produce. Ipso facto, the government has promoted organic farming since the 1990s and it enacted the Mizoram Organic Farming Act, 2004 to boost organic farming in the State. Since 2015-16, the State promoted organic farming mainly under the Mission Organic Value Chain Development for North Eastern Region (MOVCD-NER)4 scheme, which aims at development of certified organic production in a value chain mode to link growers with consumers and to support development of entire value chain starting from inputs, seeds, certification, to the creation of facilities for collection, aggregation, processing marketing and brand building initiatives. The farm produce promoted under the scheme includes Mizo chilli, ginger turmeric and tea; of which the Mizo chilli received the coveted Geographical Indication (GI) tag in 2015. The State government harbours the goal of converting the State to Organic Farming and aims to set-up Bio Fertilizer Production Laboratories and Biocontrol Pesticide Laboratories in different parts. Mission Organic Mizoram has also tied-up with Mizden, an online marketing/logistic partner for online marketing of organic products in May 2020. The success of organic farming and its adoption by the farmers on a larger scale would inter alia hinge on government support for collection, transportation, storage and marketing of the produce as also minimising the cost of certification. Mizoram, possibly, may take a cue from Sikkim, which is a cent per cent organic State since 20165. In spite of having substantial growth potential in the agriculture and allied sectors, the State is yet to achieve the desired results. The reasons are manifold, including both supply as well as demand side. On supply side, the low volume of production surplus due to small holdings and traditional methods of cultivation practices results into low volume of marketable surplus, which is the major impediment for growth of desirable market dynamics in the region. On demand side, extremely low population density and the low purchasing power particularly in the rural areas constrained the expansion of demand for these high value commodities. High cost of transportation as well as lack of cold chain infrastructure (which is essential to transport these perishable commodities) force the producers to sell either at low prices or increases the extent of post-harvest losses which acts as disincentives for the producers. Foodgrains, vegetables, eggs, fish, etc. are sourced from the neighbouring States for meeting local consumption needs. Hence, warehousing facilities, including cold storage facilities, are a critical need for the State. The flagship government subsidised crop insurance scheme, Pradhan Mantri Fasal Bima Yojana (PMFBY), needs to be further operationalised in the State. Regulated agriculture markets and marketing infrastructure like market yards are further to be developed. The local surplus produce is generally sold in local markets only. Traders from neighbouring States like Assam also take up bulk purchasing of agriculture produce like squash (chow chow), ginger, pineapple, orange, hatkhora, etc. but such arrangements are rudimentary and do not necessarily ensure fair price to the farmers. Bamboo is an important and one of the fastest growing Non-Timber Forest Produce, which grows across the world. India, China and Myanmar together have 19.8 million hectares of bamboo reserves which is nearly 80 per cent of the world’s bamboo forests, out of which, the share of India is about 45 per cent (Nath, Pal and Banerjee, 2008). Approximately 60 per cent of the total growing stock of Bamboo in India is in the NER. A wide variety of products is made from bamboo in Mizoram, which include furniture, baskets, pipes, toys, hats, umbrella handle, fish baskets, mugs, weaving tools, traditional ornaments and even houses. The eco-friendly Bamboo crop, which represents a vast underused resource, has huge potential in improving not only rural economy but also industrial development and creating a sound economic base for the State (Northeast Window, 2017). Government of India increased import duty on bamboo from 10 per cent to 25 per cent, which will have a positive impact on farmers and entrepreneurs in the field. This step will invoke micro entrepreneurs to boost use of local bamboo in making ‘agarbatti’ and increase production. At present, India consumes about 1,490-ton agarbatti while only 760-ton agarbatti is being produced locally. This increase in import duty may produce thousands of new employment opportunities in a year, especially in rural area. 3.2.ii Industry Industrialisation in the State is slow due to absence of many prerequisite factors for industrial development (Laskar, 2009). Owing to the geo-tectonic features of the region, mining activity remains limited to mere sand mining and sandstone quarrying (GoM, 2020). There has been a significant year-to-year fluctuation in the production of sand and stone quarry, while the issuance of mining permits has increased significantly in the last couple of years (Chart 3.12). 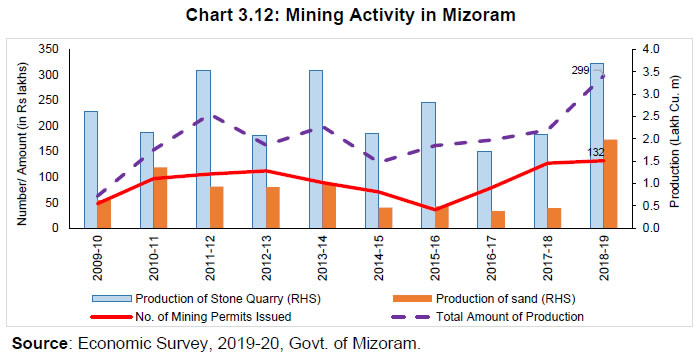 Unfavourable location and topography, lack of better road transport connectivity, paucity of mineral resources, low level of entrepreneurship and skills are some of the major factors hindering industrial growth in the State. Industries in the State are mainly cottage industries, handloom and handicrafts, bamboo products, forest products and horticulture products. Handloom is one of the major industry sectors in the State employing thousands of weavers (Deccan Chronicle, 2019). The weavers produce traditional Mizo products like puan, shawls, bags, etc. The availability of raw material, designs and marketing are the major issues affecting the growth of the sector. Khadi and Village Industries Board (KVIB) was set up in the State in March 1986. The Board provides financial assistance to registered individuals, institutions, co-operatives and departmental units. It also provides technical guidance and training. The agro-climatic conditions of the State are conducive to agricultural and horticultural crops and thereby a strong and effective food-processing sector could play a significant supportive role in the economy. Food processing industry has been a key focus of the State government and hence the Mizoram Food and Allied Industries Corporation (MIFCO) was established in 1989 in order to promote the rapid development and promotion of food processing industries. As per the 6th Economic Census (March 2016), the NER accounts for mere 4.8 per cent and 4.2 per cent of the total number of agriculture and non-agriculture establishments and the number of people employed in such establishments, respectively (Chart 3.13). Within the NER, Mizoram has lesser number of establishments and accordingly it accounts for barely 2.1 per cent of the total establishments in the NER. It ranks sixth6 amongst the eight NER States, both in terms of number of establishments and employment. In the last few years, many micro and small enterprises have been set up under Stand-Up India Scheme, Prime Minister's Employment Generation Programme (PMEGP) and Pradhan Mantri Mudra Yojana (PMMY). During 2018-19, the banks financed 149 units under Stand-Up India, 1,175 units under PMEGP and 9,176 units under PMMY respectively. Outstanding credit to MSMEs of the State has increased from Rs.907.7 crore as on March 31, 2018 to Rs.1067.6 crore as on March 31, 2019 (Chart 3.14). There are 26 MSME clusters recognised in the State - 3 MSME clusters recognised under MSE-MDP programme and 23 handloom clusters under the National Handloom Development Programme (NHDP) as on March 31, 2019. 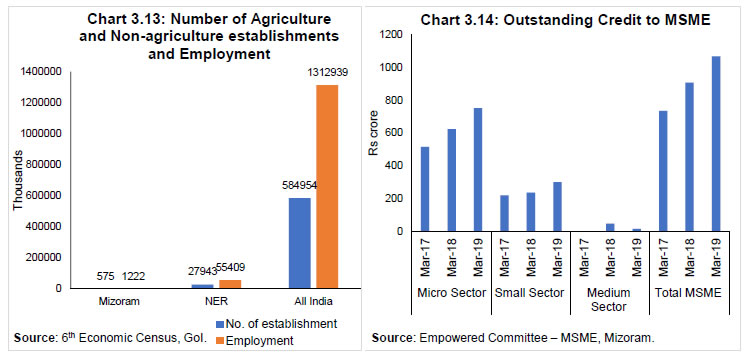 For promoting entrepreneurship, the State government has initiated Entrepreneurship Development Scheme (EDS) to educate the youth of the State on various opportunities beyond the public sector and impart skills necessary to prepare them to start their own venture and be successfully self-employed. In order to implement the EDS, the State has constituted the “Mizoram State Entrepreneurship Development and Monitoring Committee” or MEDMOC, which organises skill development programmes, etc. The government also runs various other schemes. The State government provides 50 per cent of the start-up capital (maximum Rs.5 lakh) as grant for starting the business to an entrepreneur selected through a competition. The government also runs a scheme to create community asset in each district through public participation wherein the State government allocates a budget of Rs.1 crore per project. The State government has also set up Zoram Industrial Development Corporation (ZIDCO) for the purpose of Industrial Development of the State. Another government unit, Zoram Electronics Development Corporation (ZEDCO) had also been set up to promote electronic industry. There is a potential for setting up fruit juice plants based on locally produced fruits. A number of cottage and household industries are functioning under the KVIB fold. The flow of investment and employment generated in the industrial sector as per the Entrepreneurs Memorandum and Udyog Aadhaar Memorandum (UAM) filed at district industrial centres (DICs) during 2007-08 to 2018-19 is as below (Chart 3.15). 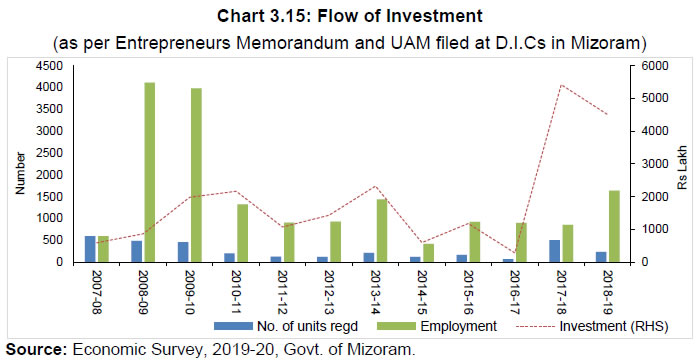 Lower level of industrialisation does not enthuse sufficient demand for bank credit and hence the share of credit to industry stands low at 14 per cent, which is less than half the all-India level (Charts 3.16 and 3.17). Personal credit constitutes 55 per cent in total credit, which is about 2.5 times that of the all-India level. Popular activities like tailoring, furniture making, automobile repairs, bakery, handloom weaving and black smithy account for more than 80 per cent of the total number of enterprises/units in the State. Most of these units are in and around Aizawl, followed by Lunglei district. There is a scope for development of plywood and paper industry with abundance of timber and bamboo, apart from handicrafts, village and cottage industries, agro-based industries and agro-processing units in the State. Development of handloom industry and agro-based industries has brought about migration of workforce from agriculture to non-agriculture sector to some extent. 3.2.iii Services Sector Tertiary sector transacts with the production of intangible goods like transportation, hotel restaurants, real estate, arts, entertainment health insurance services, education and telecom services etc. Services sector is the largest sector of India. Gross Value Added (GVA) at current prices for services sector is estimated at Rs.92.26 lakh crore in 2018-19. Services sector accounts for 54.40 per cent of India's total GVA of 169.61 lakh crore Indian rupees. With GVA of Rs.50.43 lakh crore, Industry sector contributes 29.73 per cent, while agriculture and allied sector has a share of 15.87 per cent (Ministry of Statistics and Programme Implementation, 2018-19). In the NER, services sector contributes between 40 per cent and 65 per cent except the State of Sikkim where services contribute less than 28 per cent of the GVA. Among the States in the NER of India, Manipur reports the highest contribution from the services sector. The share of this sector in Mizoram is more than 45 per cent. At the all-India level, financial services contribute between 12 per cent and 14 per cent in recent years, while in the NER, this sector contributes between 5 per cent and 6.6 per cent. The contribution of financial services in Mizoram largely remained less than 5 per cent (Chart 3.18). Contribution of financial services in Manipur is the lowest in the NER (3.14 per cent in 2018-19), while for Mizoram, it was the second lowest. 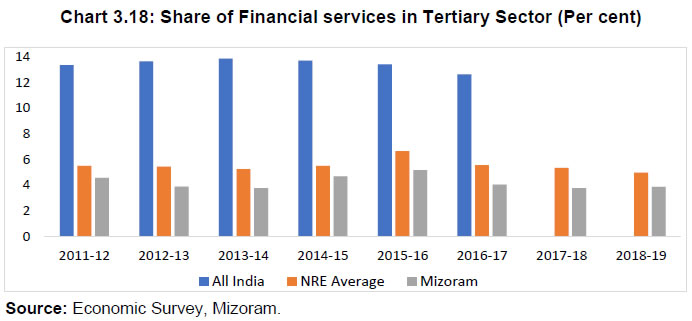 The share of real estate, ownership of dwelling and professional services is another important sub-sector of services sector. At all-India level, this sub-sector holds a substantial share which is more than 25 per cent of the whole and it has shown an increasing trend over the period. On the contrary, this sub-sector could contribute on an average only 7.8 per cent of the total services in Mizoram. Moreover, this sector has shown a decreasing trend during the last decade. Nevertheless, the small share of this sector opens up a positive opportunity for future growth of the sector. The contribution (in percentage terms) of sub-sector, viz., trade, repair, hotels and restaurants in the State is at par with the all-India figures, while a difference of approximately 5 per cent (on an average) is found in the sub-sector, viz., transport, storage, communication and services related to broadcasting. The contribution of other services moves between 25-30 per cent, while at all-India level, it is found moving between 13 per cent and 14 per cent. 3.3 Infrastructure Availability Availability of Infrastructure is primary requirement to the development of economy. On one hand, it provides basic services to general public and on the other hand, it is the enabler, facilitator and accelerator of the economic growth. It is a well-accepted fact that there exists a strong positive correlation between investment in infrastructure and GDP growth. 3.3.i Power Position Power generation is far below its own requirement in Mizoram. It is only 15 MW as against a peak power demand of more than 102 MW. Though the State has huge hydroelectric power potential (estimated at around 4500 MW), only a fraction of the potential is harnessed at present through Small and Mini Hydel Projects. The State is also endowed with abundant potential for solar energy estimated at 9.09 GW as per the National Institute of Solar Energy (NISE) with an average capacity of 250 sunny days in a year, receiving an average hourly radiation of 200 MW per sq.km. (Chart 3.19). 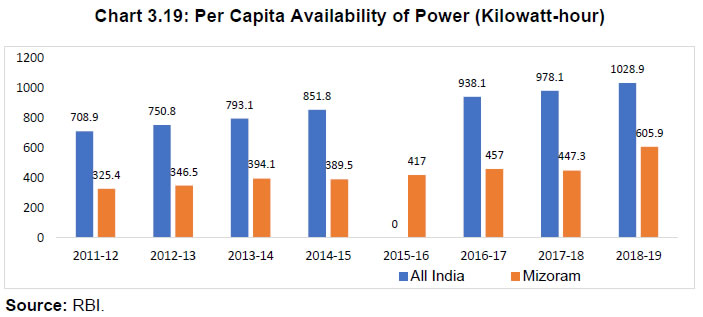 In line with the all-India trend, over the years, per capita availability of power has been improving in the NER as also in Mizoram (Chart 3.20), though in terms of per capita power availability, it significantly lagged behind with about half of the national average. As per the requirement and availability, State’s power position has improved significantly in the last five years and remains better than the NER, though it lags behind the national average (Chart 3.21).
3.3.ii Road and Railways Transport The road density is much lower than the national average as also the NER in Mizoram (Chart 3.22). The State is connected with the rest of India by National Highway (NH-54), which runs through Assam and Meghalaya. Also, roads are narrow and winding through hilly terrains, thereby lengthening journey period. The need for strengthening the road infrastructure cannot be over-emphasised since road transport remains the sole mode of transport owing to the absence of railways and waterways in the State (GoM, 2020). 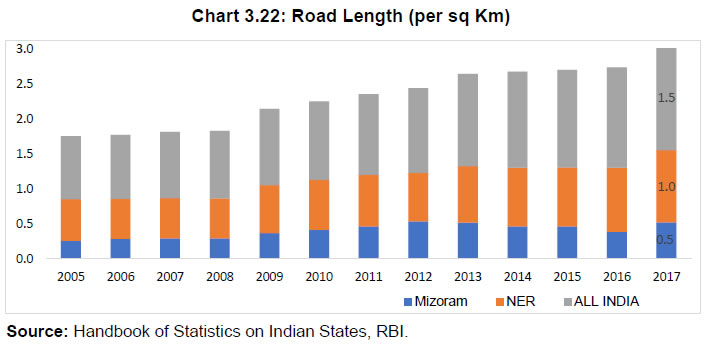 Due to the near absence of other means of transport, particularly railways and waterways, roads are the primary means of communication, and the importance and dependence of the whole State on the road infrastructure cannot be over-emphasised. In this context, recently, the Indian Railways is implementing various projects to improve its network across North-East India. One of the major railway projects, Bairabi-Sairang new rail line project is all set to give a massive boost to the rail connectivity in the region, as it will connect Mizoram to Indian Railways network up to Bairabi railway station, which is the gateway to the State. The challenges in the construction of this project are immense due to difficult geography, deep gorges, high hills and prolonged rainfall leaving less working period. Slope stabilisation is another challenge due to alternate band of very weak strata of sandstone, silt and shale. Also, construction material such as coarse and fine aggregates as well as other quarry products are not available locally. So, it is transported from other States, as far as from Pakur in Jharkhand. The project is expected to get completed by end-2022. The economy of Mizoram is primarily agrarian with 60 per cent of the population depending, directly or indirectly, on agriculture. Rest of the working population is engaged in government jobs, small businesses and transport activities. Sectoral composition of GSVA suggests the dominance of forestry and logging (coupled with the practice of traditional subsistence level farming) in the primary sector, ‘electricity, gas and water supply services’ in the industrial sector and ‘public administration in the tertiary sector. This composition coupled with lower level of industrialisation, and inadequate availability of infrastructure facilities possibly does not generate sufficient demand for credit in the State. Development of physical infrastructure, particularly in the rural areas, is equally important for generation of demand for financial services. Improvement in availability of electricity, roads and telecommunications, warehouses in rural areas would lead to better supply chain management, enhanced productivity and greater value addition. There is a significant potential for organic farming and the State government has taken a number of initiatives to promote it. The unique socio-economic condition of the State also warrants apposite financial innovations to suit local needs. In view of its long international border with Bangladesh, Mizoram is well-positioned to reap benefits from exporting quarry stones and stone chips, which are in great demand in Bangladesh. It can also boost the export of handloom products under Look East policy, given the similarity of fabrics worn by people of South-east Asian countries and that produced by local weavers. 4. Literature Review While financial inclusion is addressed by improving the financial infrastructure, many studies find that high financial literacy also has a clear beneficial effect on financial inclusion. Volpe, Joseph and Haiyang (2002) studies investment literacy among 530 investors and found that the level of investment literacy varied with people’s age. The study concluded that older investors performed better than their counterparts did. Almenberg and Soderbergh (2011) found that older people possess lower financial literacy. Bhushan and Medury (2013) conducted a study to measure the level of financial literacy among salaried individuals and identify the socio-economic-demographic factors affecting the level of the financial literacy. Various studies suggest that the literacy level, in general, varies with gender. The studies have found that general literacy level among male population is higher than their counterparts. Volpe, Joseph and Haiyang (2002) studied investment literacy among 530 investors and found that the male investors and older investors performed better than their counterparts. Agarwalla et al. (2013) studied the influence of socio-demographic variables on the three-response variables viz., financial knowledge, financial behaviour and financial attitude among working youth in urban India. The study considered a sample of 754 respondents and employed the methodology used by OECD-INFE study. The study also found that the influence of gender is similar to what has been reported in other studies. Bashir et al. (2013) tried to identify and analyse the psychosocial factors that may have influence over financial literacy in Pakistan by administrating a questionnaire among 120 respondents. Study concluded that males were more financially literate. Another attempt was made by Bhushan and Medury (2013) to measure the level of financial literacy among salaried individuals by selecting a sample of 516 respondents from Himanchal Pradesh. The study found that the overall financial literacy level (58.30 per cent) is not very encouraging. Moreover, the level of financial literacy among females were even worse. Firli (2017) and Almenberg and Soderbergh (2011) found a similar result about gender. Danes and Hira (1987) surveyed 323 college students from Iowa State University using a questionnaire of 51 items to measure their knowledge of credit cards, insurance, personal loans, record keeping, and overall financial management. Their findings indicate that males know more than females in most areas, married students know more than unmarried students, and senior students know more than junior students. Their overall finding was that college students have low financial knowledge. Literacy and education, in general terms, are positively correlated. Some of the researchers took an attempt to study the relation between level of education and financial literacy. Volpe, Joseph and Haiyang (2002) found that the level of investment literacy varied with people’s education. A study was conducted by Agarwalla et al. (2012) to study level of financial literacy among students, young employees and the retired employees in India, by taking a sample of approximately 3,000 respondents spread across the country and by employing OECD approach. They arrived at a conclusion that the overall financial literacy score is on par with the poor global standards. The study concluded that the financial knowledge is positively correlated with education, but education has no influence on the financial attitude. Another study conducted by Agarwalla et al. in the following year, i.e., 2013 highlighted that the respondents in the sample had high educational levels but did not have adequate financial literacy. This may be due to absence of inputs relevant to financial literacy in the Indian education system. Bhushan and Medury (2013) and Firli (2017) found that financial literacy is positively associated with education and income. The State has established Financial Literacy and Credit Counselling Centres (FLCCs) operationalised by the banks in each district. Traditionally, India is known for its joint family system. Higher number of families living together provides greater opportunity for interaction. Such situation gives an opportunity for psychological and moral support from the elders, and at the same time, older people get helping hands of the younger. This mutual support creates a synergy that helps members learn from each other. In recent years, due to migration for employment, joint families converted into nuclear families in most of the places. A landmark study conducted by Agarwalla et al. (2013) highlighted that there are few factors specific to India, such as joint-family and consultative decision-making process which tend to influence financial literacy significantly. Das and Mahapatra (2019) in their study of financial literacy in Assam concluded that the level of financial literacy among Assamese people is satisfactory when compared to the national average. They found a weak relationship between financial literacy and financial attitude. Another study conducted by Bora (2020) reveals that among the eight States of NER, Tripura is the most financially inclusive State with an intermediate level of financial inclusion followed by Assam, Sikkim, Mizoram, and Meghalaya. However, the financial inclusion index score was low in the States of Arunachal Pradesh, Manipur, and Nagaland. The purpose of financial inclusion is to ensure easy availability of formal financial sources to every citizen of a country, so that the common people do not fall prey to the gimmicks and trick of financial frauds. Zinsa and Weill (2016) conducted a study to examine the factors that determines financial inclusion in Africa. The study was based on World Bank’s Global Findex database on 37 African countries and applied Probit model. The study identified that male, rich, educated and older were more financially included. The study found no significant difference between factors that determined traditional banking or mobile banking. On the contrary, the study concluded that determinants of informal finance differ from those of formal finance. Mohapatra (2014) on the issue of financial inclusion commented that RRBs are playing a vital role in this regard. Age is an important demographic factor that needs to be studied in connection with financial inclusion. An attempt is made by Tuesta et al. (2015) to study the three dimensions (i.e., access, use and barriers) determining financial inclusion in Argentina. They considered variables like use of financial products (like account, debit card, credit card, e-payments, formal credit), perceived barriers (like distance, costs, documents required, distrust of financial institutions, other family member, lack of money) and demographic factors (like gender, age, income, and level of education). The study concluded that age was one of the major factors of financial inclusion on the demand-side. Abel, Mutandwa and Roux (2018) conducted a study with an objective to assess determinants of financial inclusion in Zimbabwe by a nationally representative sample of 4,000 Zimbabweans of age older than 18 years. The study employed the Logit Model to investigate the determinants of financial inclusion and concluded that age was positively related to financial Inclusion. Another study conducted in India by Singh (2019) found similar results. A study conducted in the NER by Bhanot, Bapat and Bera (2012) pointed out that proximity to a bank branch or post office increases the chances of financial inclusion, but these do not facilitate inclusion. The complicated and lengthy procedure involved in the system discourages the stakeholders to avail formal financial services. Tuesta et al. (2015) and Zulfiqar et al. (2016) highlighted that lengthy and multiple documentations is perceived by prospective users as a major barrier to financial inclusion by various demographic groups. The world is going techno-savvy day by day. The information which were not accessible easily by the common people earlier are now accessible over mobile phone or on computer, at the convenience. Access to information is not perceived as a big barrier to financial inclusion. Smart mobile phones have made the access to information even easier. Although, smart mobiles are getting cheaper, but still it has not reached the rural masses. Furthermore, internet connectivity (Wi-Fi/GPRS etc.) is still a barrier to access, especially in the rural and remote areas. Many studies have been conducted to collect the perception of the stake holders on this respect. A study conducted by Bhuvana and Vasantha (2016) concluded that financial literacy, high cost, technology, trust, income level, distance and inappropriate products were deciding factors for the level of financial inclusion in rural areas. Singh (2011) investigated into the inclusive growth and regional disparity in banking services. The secondary data centred study found disparity in distribution of bank offices across six banking regions in India and within north-eastern region as well. The study concluded that the NER suffers from weak infrastructural facilities like connectivity, geographical inconvenience like difficult terrain, thinly populated States, and other reasons like lower business for commercial banks. The study also pointed out that the region was suffering with lower credit-deposit (C-D) ratio, low recovery of loans and higher NPA. Atkinson and Messy (2012) and OECD (2013) highlighted that women possess lower level of financial knowledge as compared to men and women were less likely to be active financial consumers as compared to men. Improved financial knowledge may help women to become financially included. In India, a study was conducted by Ghosh (2019) using district-level secondary data to estimate the impact of Financial Literacy Centres (FLC) on financial inclusion or financial knowledge. The study used household level data from the Financial Inclusion Insights (FII) survey, operated by the global research group InterMedia. A study conducted by Lalhmingsangi (2019) found that less than 20 per cent self-employed individuals in Aizawl prepare monthly budget. Surprisingly, only 1 per cent of the respondents were regularly saving the surplus money while 45 per cent used to keep money in cash while 39 per cent keep in savings bank account. Out of 157 respondents, 35 per cent respondents do not discuss financial matters openly. The study concluded that the level of financial literacy in Mizoram is very low. Lalrinmawii (2019) in a study on Financial Inclusion in Aizawl concluded that the availability of a bank in a person's vicinity is the most important factor in influencing financial inclusion. The finding of the study also showed that since every credit was disbursed through banks, and even MGNREGS money was transferred through bank accounts, most of the women had bank accounts. Another study conducted by Lalremruati and Fanai (2018) on financial inclusion of food and grocery shop owners in Aizawl found that over 97 per cent of the respondents were financially included. The preference for doing transactions in cash, low income and assets, lack of financial knowledge, attitude of bank branch officials, limited number of banks in the local area, and cumbersome banking procedures are the main problems faced by the food and grocery store owners in availing/accessing banking services. Vanlalmuana and Gupta (2015) in their study of financial inclusion among private schools’ teachers in Aizawl district highlighted that school-teachers did not go beyond a basic savings account despite the fact they are better educated and well-equipped with financial resources. 15 per cent of the private school teachers did not have a basic savings account. Similarly, another study by Sailo and Singh (2019) found that financial literacy is relatively low among college teachers in Aizawl. The respondents were familiar with the low-risk investment avenues, but the knowledge decreases with the increase in the risk involved. Boro (2015) in a study found that the customers in their younger age availed more technological mediums for banking transactions. Further, consumers were highly aware of ATMs and used it more as compared to other technological mediums such as credit cards, net-banking, mobile banking, NEFT, RTGS and mobile wallets. Another study found that Assam is less financially included as compared to all-India average. The study mentioned that bank branches in Assam had grown at a higher rate than rest of India, but there were significant differences in geographic/ demographic penetration and usage ratio between Assam and aggregate India. Thus, banks should think of spreading technology-driven products and services to the excluded areas and population, e.g., business correspondents (Maity and Sahu, 2021). Chakraborty and Barman (2013) conducted a study about financial inclusion in Tripura. In the study, they pointed out that it was somewhat difficult to recover the amount disbursed by financial institutions to poor people. Another study conducted in the NER observed that Indian financial system has experienced considerable widening and deepening in recent years, especially banking services, still financial exclusion of underprivileged section remains a major concern. The researcher stressed the need for financial inclusion by delivery of basic banking services to all the sections of the society at affordable rate (Goyal, 2008). Kodan, Garg and Kaidan (2011) evaluated the level of financial inclusion in the NER and highlighted the indications and implications on future course of action that can be initiated by the Reserve Bank. The review of the literature suggests that a good number of studies have been conducted in India to assess the level of financial literacy and financial inclusion. There are some studies also for NER, but the studies extensively in the State of Mizoram have been fewer. 5. Banking Landscape in Mizoram 5.1 Access and Usage of Banking Services in NER Like many other socio-economic indicators, banking indicators are not uniform across regions in India. It is observed that the banking density7 is significantly higher in the Southern, Northern and Western Region as compared with North-Eastern, Eastern and Central Regions (Table 5.1). | Table 5.1: Region-wise Banking Density | | (Population per Office (‘000)) | | Region | 2003-04 | 2016-17 | Change | | Northern Region | 12.5 | 6.8 | -5.7 | | North-Eastern Region | 21.0 | 13.1 | -7.9 | | Eastern Region | 19.7 | 13.0 | -6.6 | | Central Region | 19.5 | 12.1 | -7.4 | | Western Region | 14.5 | 8.9 | -5.6 | | Southern Region | 12.2 | 6.8 | -5.4 | | All- India | 15.6 | 9.3 | - 6.4 | | Source: Authors estimates based on BSR, RBI and National Accounts Statistics, Govt of India (NAS) (various issues). | Within the NER, Mizoram appears to be well covered by banking network in terms of the number of people served per bank branch. This, however, overlooks the sparse population distributed across difficult hilly terrains. In terms of demographic penetration, population served per bank branch is higher than the all-India figure, though it is lower than the NER (Chart 5.1). Mizoram is better placed than NER, it lags behind all-India figure and has higher pressure of population on bank branches. In terms of geographical area served by each bank branch, it lags far behind all-India and even within the NER. The area served by each bank branch is roughly five times that of the corresponding all-India figure, and almost twice as much as the corresponding NER figure (Chart 5.2). 5.2 ATMs (per 1000 population) ATM density in the State is lower than the national average, though it has a better ATM penetration than the NER (Chart 5.3). ATM penetration in the State can be attributed to public sector banks, which account for around 80 per cent of the ATM network.
As per the usage of banking services, in terms of both number of deposit accounts and credit accounts per ‘000 persons, Mizoram significantly lags behind all-India average, though it is comparable with the NER average (Charts 5.4 and 5.5).
Mizoram lags behind both the NER and the all-India average in terms of deposit-GSDP and credit-GSDP ratio (Charts 5.6 and 5.7) with around 30 per cent of the all-India average. The C-D ratio of the State is much lower than that of all-India average (Chart 5.8). The prevalence of traditional, less capital-intensive and non-commercial agricultural practices and absence of large capital-intensive industries in the State possibly does not generate adequate demand for credit, which could be keeping the credit-GSDP ratio very low in the State. There has also been lower achievement of targeted annual credit in the State in the last couple of years (Chart 5.9). 5.3 Banking/ Financial Ecosystem in Mizoram There are 28 banks operating in the State, which includes 16 public sector banks, eight private banks, one payments bank, one regional rural bank and two co-operative banks. In all, there are 224 bank branches, of which, only 67 (33 per cent) cater to rural areas. Mizoram Rural Bank (MRB), a RRB, is the largest bank in terms of branch network but SBI has the largest share in deposits and advances. The bank branches are complemented by a network of 183 ATMs, of which, more than half (97 ATMs) belong to SBI. Banking business in the State constituted merely 4.1 per cent of the entire business of NER; as such, it remained the lowest amongst the NER States (Chart 5.10). In addition, public sector banks account for bulk of the banking business followed by RRBs, private sector banks, and the small finance banks (Chart 5.11). The banking services remains skewed, as it is mainly concentrated in Aizawl. Even though accounting for 37 per cent of the population and just 17 per cent of the geographical area of Mizoram; Aizawl accounts for 47 per cent of Mizoram’s bank branches, 46 per cent of its deposit accounts and 52 per cent of its credit accounts as on March 2018 (Chart 5.12). Bank-group wise branch presence and banking activities in State also remains lop-sided. Out of total 208 branches of different banks functioning in the State, at the end-June 2021, Mizoram Rural Bank (an RRB) has the largest number of bank branches network (42 per cent per cent) (Table 5.2). Among the bank groups, it has the widest reach in rural areas. Private Banks and nationalised banks are mainly located in Aizawl and have negligible presence in rural areas (Chart 5.13). It is pertinent to note here that the existing branch authorisation policy8 has rural (Tier 5 and Tier 6) banking outlet opening quotas set for individual banks at national level but not at the State level. Moreover, the opening of any banking outlet (part/full time) in Tier 3 to Tier 6 centres in NER and Left-Wing Extremist (LWE) affected districts also counts towards fulfilling this quota. The current policy consequently allows banks to ignore opening of banking outlets in the unbanked rural centres of relatively challenging States like Mizoram. In other words, at present, there is no regulatory compliance requirement compelling banks to extend coverage in banking deficient areas within States as long as they fulfil the national target. | Table 5.2: Bank-Group-wise Offices/Branches of banks in Mizoram (June 2021) | | Bank group | Total no. of Offices/ Branches | Percentage Share of Offices/Branches | | Rural | Semi-Urban | Urban | Total | | Nationalised Banks | 32 | 0.92 | 5.07 | 8.76 | 14.75 | | Private Sector Banks | 36 | 0.46 | 6.45 | 9.68 | 16.59 | | Regional Rural Banks | 92 | 24.42 | 8.29 | 9.68 | 42.4 | | SBI and its Associates | 47 | 6.91 | 5.53 | 9.22 | 21.66 | | Payments Bank | 6 | 0 | 2.3 | 0.46 | 2.76 | | Small Finance Bank | 4 | 0 | 1.38 | 0.46 | 1.84 | | Total | 217 | 32.72 | 29.03 | 38.25 | 100 | | Source: RBI. |
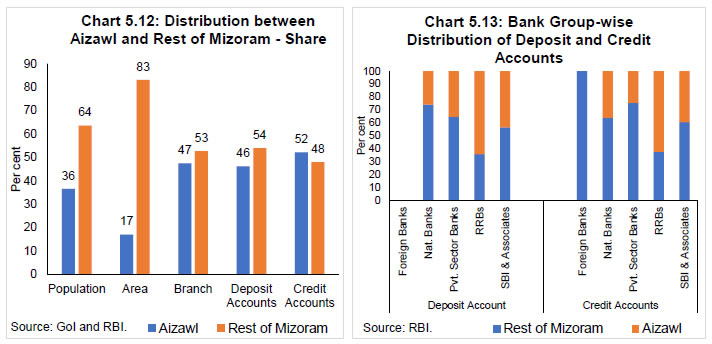 A unique and interesting feature of the banking ecosystem in Mizoram is the lead role played by the single RRB (with SBI as its sponsor bank) functioning in the State viz., Mizoram Rural Bank (MRB). MRB has been playing a pivotal role in promoting financial inclusion in the State. 40 out of the 44 brick and mortar branches of commercial banks present in the villages with population below 5,000 belongs to MRB. In addition, 37 of the 55 BCs present in villages with population below 2000 are also sponsored by MRB (Table 5.3). MRB accounts for 33 per cent of the deposits and 39 per cent of credit in the State as on March 2021 (Charts 5.14 and 5.15), while the corresponding all-India share of deposits and credit by RRBs is 3.4 per cent and 2.9 per cent, respectively. Only Tripura, among the other NER States has a comparable deposit share accounted for by RRBs. MRB also boasts of being a RRB in the entire NER States having highest level of deposit and credit accounts per lakh person (Charts 5.16 and 5.17). No other State/UT/region in India has such a prolific role being played within it by RRB(s). | Table 5.3: Banking Facilities in Villages in Mizoram (December 2019) | | Particulars | Total | RRB | SBI | Other CBs | Payments Banks | | Bank Branches in Villages with population below 5000 (703 villages) | 44 | 40 | 4 | 0 | 0 | | Business Correspondents/Access Points in Villages with population below 2000 (660 villages) | 196 | 37 | 7 | 11 | 141 | | Source: SLBC Mizoram. |
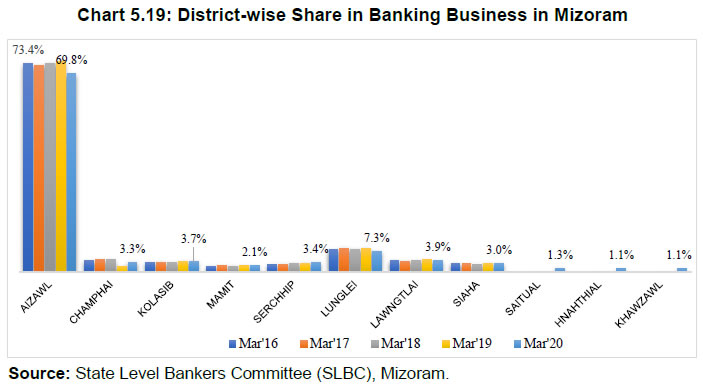
In many parts of the remote hinterlands of Mizoram, MRB branches are often supported by their business correspondents (BCs), which are the sole or primary banking service provider to the populace. Out of the 66 rural bank branches in the State, as on December 2019, 49 belong to MRB. This may offer an interesting opportunity for study as this unique level of dependence of a section of the populace on an RRB for their banking needs. This may have certain contrasts in terms of levels of engagement and trust, customer service and satisfaction, etc. when compared to areas served by multiple types of banks or traditional commercial banks. Unlike some of the RRBs of the region, the MRB remains well-capitalised and has been making profits in the last couple of years (Table 5.4). Given its wider outreach in rural areas, the MRB can potentially be a game changer in promoting financial inclusion in the State which can be further strengthened by infusion of fresh capital, strengthening governance, designing unique bouquets of product suites, training of staff and improvement in technical capability and infusing professionalism in management. | Table 5.4: Performance of Mizoram Rural Bank | | (Amount in Rs. lakhs) | | S. No. | Particulars | 2019 | 2018 | 2017 | | 1. | Capital | 3,103.82 | 3,103.82 | 3,103.82 | | 2. | Reserve and surplus | 12,301.66 | 11,459.47 | 9,249.57 | | 3. | Capital Adequacy Ratio (per cent) | 10.95 | 11.63 | 11.55 | | 4. | % of Gross NPA to total advances | 5.22 | 5.94 | 5.97 | | 5. | % of Net NPA to total advances | 2.05 | 3.94 | 3.97 | | 6. | Net loss (-)/Profit | 842.2 | 2,209.89 | 2,007.15 | | Source: Mizoram Rural Bank’s Website. | Mizoram has a two-tier Short-term Cooperative Credit structure with Mizoram Cooperative Apex Bank Ltd. as the apex bank (with 17 branches) and 135 Primary Agricultural Credit Societies (PACS). An Urban Co-operative Bank viz., Mizoram Urban Co-operative Bank, is also functioning in the State with a single branch located in Aizawl. The branches of co-operative banks are limited to urban/semi-urban centres whereas their network of PACS, though serving a wide swathe of rural areas, are limited in their capacity to cater to the requirements of the villages. Moreover, many of the primary agricultural credit societies (PACS) have also become unviable. There is a need to widen the reach of the branches of co-operative banks and strengthen the network of PACS operating under the State Co-operative bank. 5.4 District-wise C-D Ratio9 Analysis The C-D ratio in Mizoram has declined from 39.8 per cent in March 2016 to 36.1 per cent in March 2020 (Chart 5.18). The district with the highest share in banking business (deposit + credit) is Aizawl (ranging from 73.4 per cent – 69.8 per cent during 2016-20) (Chart 5.19). The C-D ratio in Aizawl is among the lowest, at below 30 per cent on an average during the last five years. The main reason cited for this during discussions in State-Level Bankers’ Committee (SLBC)/District Coordination Committee (DCC) forum is the concentration of government deposits in the State capital. In the two southern districts i.e., Lawngtlai and Saiha with relatively high C-D ratios historically, there was a significant decline in C-D ratio during this period. 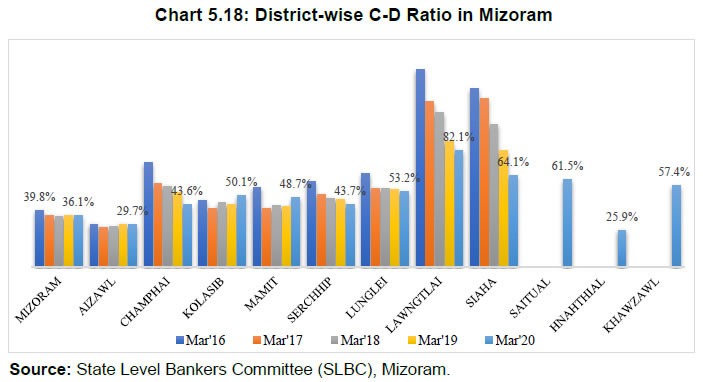
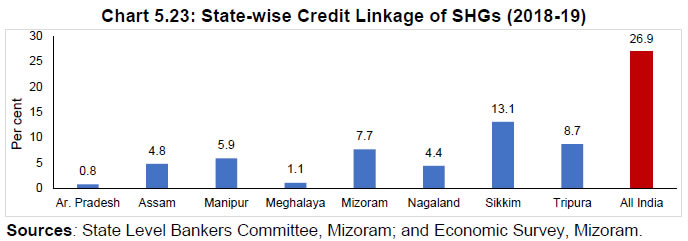
 Aizawl contributes the most as far as the share in banking business is concerned, but surprisingly has the second lowest Credit – Deposit Ratio. On contrary to this, southern-most district, viz., Lawngtlai, shares less than 4 per cent in the total banking business but enjoys more than 80 per cent C-D Ratio (Chart 5.20). 5.5 Strategy for Fostering Financial Inclusion in Mizoram The brick-and-mortar branches of commercial banks in varying degrees now cover urban and semi-urban areas, access to banking facilities continues to be an issue for the villages. Mizoram has 703 villages with population below 5000. In these villages, only 44 brick and mortar branches of commercial banks have been opened as on December 2019. The dispersed nature of villages with relatively small number of households in hilly terrains makes traditional branch banking unviable. Due to the limitations of branches of commercial banks, the solution to the problem of ensuring access to banking facilities will have to come from other modes. The business correspondents (BCs) have a greater role in fostering financial inclusion in Mizoram. Two major developments since 2018 have led to a marked improvement in coverage of unbanked areas with banking facilities. First, an increase in the number of BCs commissioned by the banks due to the continued push from the government and Reserve Bank. Secondly, the entry of differentiated banks in 2019, within which there is immense role of India Post Payments Bank, which has opened six branches in the State (Table 5.5). As at end-March 2019, there are 116 BCs appointed by seven banks and the majority of them belonged to MRB (65) and SBI (19). The entry of India Post Payments Banks with its access points has also provided a great boost to the access of banking facilities for villages in the State. | Table 5.5: BCs and Differentiated Banks in Mizoram | | S. No. | Particulars | Dec 2017 | Dec 2019 | | 1 | Business Correspondents | 46 | 95 | | 2 | Payments Banks – Branches/ Access Points | Nil | 6 / 225 | | 3 | Small Finance Banks – Branches | Nil | 2 | | Source: State Level Bankers Committee, Mizoram. | There is also a need for strengthening the self-help groups (SHG)-bank linkage programme (SBLP) programme in the State. In recent years, there has been a significant growth of SHGs with bank linkage (i.e., having savings accounts in banks) and their number per million population in the State is almost at par with NER and even higher than that of the corresponding all-India level (Chart 5.21). However, the number of SHGs which have been credit-linked continues to remain significantly low in comparison to NER and all-India level, despite significant growth (Chart 5.22). As opposed to the all-India trend, where commercial banks have been the major driver of SHGs, in NER and Mizoram, RRBs have been the game changers. The current performance of SHG-bank linkage programme in the State is attributed mainly to the Mizoram Rural Bank, which accounted for 87.7 per cent of savings-linked SHGs and 91.7 per cent of credit-linked SHGs (Chart 5.23). This share for an RRB is much higher compared to the comparable NER and all-India figures for RRBs. Tepid performance of SHGs in Mizoram and in NER may inter alia be attributed to poor banking penetration and absence of mentors. Both the State government and banks are making concerted efforts to step up SHG-Bank Linkage programme. Mizoram State Rural Livelihood Mission (MzSRLM) and North East Rural Livelihood Project (NERLP) are anchoring the SHG-Bank Linkage efforts in the State. Aizawl and Lunglei districts are covered under the World Bank funded NERLP while MzSRLM covers the remaining six districts. 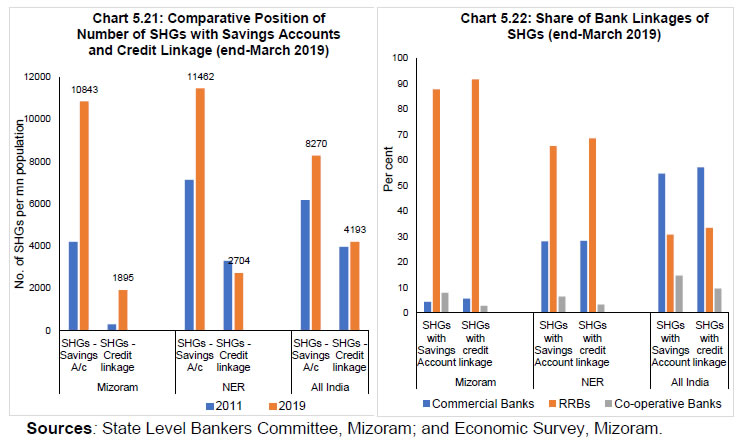
 An important factor influencing the delivery of credit to farmers in Mizoram is the non-acceptability of certain types of land holding in the State as equitable mortgage for bank loans. The land is collectively owned by the village council in north eastern States. The farmers do not have a legal title of their land. The village council gives the farmers Village Council (VC) passes, which are not always accepted by the banks. This makes it difficult for the banks to provide credit to the farmers. Hence, there is also a need for digitisation of land records and adoption of agricultural land leasing legislation. To sum up, banking business in Mizoram remains relatively low within the NER states. Public sector banks dominate the banking business in the State. However, the MRB, unlike other NER States plays a lead role. Bank-group wise branch presence and banking activities also remains lop-sided. The dispersed nature of villages with relatively small number of households in hilly terrains makes traditional branch banking unviable in many areas of the State. Due to the lesser number of branches of commercial banks, the solution to the problem of ensuring access to banking facilities will have to come from other modes. In view of poor banking outreach of banks in rural areas, there is a need to revisit the existing branch authorisation policy, which sets banking outlet opening quotas for individual banks at national level but not at the State level. There is also a need to expand the role of Mizoram Rural Bank in promoting financial inclusion in the State. The SHG-bank linkage programme also needs to be fostered as it can achieve desired outcome, especially in rural areas. While the limited banking outreach may not have been able to fully meet the credit demand of the State from the formal banking channel, poor industrial base and traditional farm practices and inadequate infrastructure facilities may be keeping the credit absorption tepid in the State. This also is duly reflected in lower C-D ratio and credit-GSDP ratio. Against this backdrop, there is a greater need for strengthening the infrastructure in the State, promote industrialisation, foster commercial cropping and food-processing industry and also develop sectoral forward and backward inter-linkages to allow the financial sector to play its due role in fostering growth. 6. Data and Empirical Estimates To assess the status of financial literacy and extent of financial inclusion in Mizoram, we used data from both secondary and primary sources. The primary data is collected through a structured questionnaire10 based on purposive sampling method. The secondary data is collected from various publications of the Reserve Bank, Census of India, Directorate of Economics and Statistics, Mizoram, Central Statistics Office (CSO), post offices, etc. Considering the impact of COVID-19 (working hours and maintenance of social distancing), it was not possible to cover whole of the State. Hence, eight blocks from four districts were covered. The selection of four districts was based on various socio-economic and demographic indicators in the State. The literacy rate is highest in Aizawl (97.9 per cent), while it is the lowest in Lawngtlai (65.9 per cent). Lawngtlai is the only district, which has literacy rate lower than national average. Mamit (17 per cent), Lawngtlai (18 per cent) and Champhai (39 per cent) are the three districts with the lowest urban population, while Aizawl (79 per cent) has the highest urban population. Density of population is lowest in Mamit and the highest in Aizawl. The per capita average deposit and credit accounts per 1000 population is the highest in Aizawl and lowest in Mamit and Lawngtlai. Aizawl has the highest population as well as density in the State, while Champhai, Lawngtlai and Mamit are placed 3rd, 4th and 5th as far as population is concerned. Out of total 196 bank branches functional in Mizoram, 97 (49.5 per cent) branches are in Aizawl. Remaining half are spread over rest of the State. Surprisingly, the State capital maintains the lowest C-D ratio of only 29.1 per cent, while Lawngtlai (83.10 per cent) enjoys second highest C-D ratio in the State. Mamit and Champhai maintain 52.8 per cent and 67.6 per cent C-D ratio, respectively (Table 6.1). These four districts cover nearly 60 per cent of the geographical area of the State. Moreover, Mamit district is also among the 117 Aspirational Districts identified by NITI Aayog. Champhai and Lawngtlai districts are located remotely on the east and south extremities and have extensive international borders with Myanmar and Bangladesh. Total 523 respondents spread across eight blocks11 were recorded (Table 6.2). | Table 6.1: Basis of Selection of Centres for Conducting Survey12 | | Banking Data as on March 2018/ Other data from Census 2011 | Aizawl | Mamit | Lawngtlai | Champhai | Kolasib | Lunglei | Saiha | Serchhip | | Area (Sq. km) | 3,575 | 3,025 | 2,556 | 3,185 | 1,382 | 4,537 | 1,399 | 1,421 | | Population-2011 census | 4,00,309 | 86,364 | 1,17,894 | 1,25,745 | 83,955 | 1,61,428 | 56,574 | 64,937 | | Population Density | 112 | 29 | 46 | 39 | 61 | 36 | 40 | 46 | | No. of RD Blocks | 5 | 3 | 4 | 4 | 2 | 4 | 2 | 2 | | No. of Villages | 94 | 86 | 159 | 83 | 34 | 161 | 52 | 35 | | Sex Ratio | 1009 | 927 | 945 | 984 | 956 | 947 | 979 | 977 | | Urban Population (%) | 79 | 17 | 18 | 39 | 56 | 43 | 44 | 49 | | Literacy (Per cent) | 97.89 | 87.03 | 65.88 | 95.15 | 77.96 | 88.86 | 90.43 | 97.91 | | No. of Bank Branches | 97 | 9 | 11 | 21 | 17 | 21 | 6 | 14 | | C-D Ratio (Utilisation) (%) | 29.1 | 52.8 | 83.1 | 67.6 | 29.7 | 78.9 | 140.8 | 48.6 | | Population per branch | 4,127 | 9,596 | 10,718 | 5,988 | 4,939 | 7,687 | 9,429 | 4,638 | | Area (sq.km.) per branch | 37 | 336 | 232 | 152 | 81 | 216 | 233 | 102 | | Deposit A/Cs per 1000 population - Number | 1,582 | 792 | 948 | 1,093 | 1,168 | 1,118 | 1,180 | 1,198 | | Credit A/Cs per 1000 population - Number | 179 | 61 | 64 | 101 | 80 | 120 | 137 | 104 | | Average deposits per population (Rs.) | 1,64,613 | 18,255 | 17,738 | 24,122 | 29,847 | 36,214 | 26,330 | 34,509 | | Average credit per population (Rs.) | 47,907 | 9,642 | 14,734 | 16,298 | 8,858 | 28,575 | 37,063 | 16,754 | | Sources: RBI; and the Census of India, Government of India. |
| Table 6.2: Distribution of Sample for the Study | | S. No. | Name of Block | Sample Size | Name of District | Sample Size | | 01 | Tlangnuam | 77 | Aizawl | 135 | | 02 | Thingsulthliah | 58 | | 03 | W. Phaileng | 60 | Mamit | 123 | | 04 | Zawlnuam | 63 | | 05 | Champhai | 61 | Champhai | 122 | | 06 | Ngopa | 61 | | 07 | Chawngte | 57 | Lawngtalai | 143 | | 08 | Sangau | 86 | | Total | 523 | | 523 | | Source: Field survey. | 6.1 Selected Variables for Analysis The present study is an attempt to investigate the variables that influence the status of financial inclusion and financial literacy in Mizoram. The study tries to identify various possible factors based on numerous studies, and reporting variables considered by earlier studies across the world. The factors selected for the present study are as under: Most of the studies on financial literacy and financial inclusion consider gender as one of the factors having influence on it. Bhushan and Medury (2013) in their study found that gender affects financial literacy. A study conducted by Murmu (2022) on the Mizos residing in Mizoram and outside, found insignificant difference between financial literacy of male and female respondents which is in contrast with the findings of Fonseca, et al. (2009), Ford and Kent (2010), Lusardi and Mitchell (2011), Olga and Kharchenko (2011, Jariwala (2012), G20 OECD (2017), NCFE (2019) and OECD (2020), where male respondents show a higher percentage of high financial literacy level. The study by Agarwalla et al. (2013) mentioned that the men are more financially knowledgeable than female, but financial behaviour and attitude of women are marginally better as compared to men. Age is another factor that is considered by majority of the studies on financial literacy and financial inclusion. A study conducted by Murmu (2022) on the Mizos residing in the State and outside, found that among the four age groups, the highest percentage of high financial literacy is possessed by the age group 31-40 years (i.e., 52.2 per cent), followed by 41-50 years (i.e., 51.9 per cent), above 50 years (i.e., 48.1 per cent) and up to 30 years (i.e., 39.0 per cent). The study is in congruent with the findings of Kamboj (2017), OECD (2020), Hogart and Hilgert (2002), Ali and Mbarire (2014) etc. Marital status has its association with financial literacy and financial inclusion. Hogart and Hilgert (2002) in their study of financial literacy among adults in US show that respondents who are unmarried possessed less financial knowledge than others. Educational achievement has its impact on most of our choices and status. A study conducted by Murmu (2022) on the Mizos residing in the State and outside, found a direct relationship between education and financial literacy. Similar results were observed in the findings of Lusardi and Mitchell (2006, 2008), Bhushan et al. (2013), Aggarwal et al. (2014), Hogart and Hilgert (2002), Sekar and Gowri (2015), Bhushan and Medury (2013), Kamboj (2017), Vidya (2017) and NCFE (2019). A common perception is that respondents who studied business-related courses are better financially literate, but findings of Mandell and Klein (2009) showed that those respondents who took financial management course did not possess better financial literacy than others. Bhanot, Bapat and Bera (2012) pointed that the financial inclusion level in north-eastern region of India remains very low. Bhushan and Medury (2013) in their study found that place of work affects financial literacy. Thus, place of residence (block of residence and district of residence) is considered to investigate the effect, if any. Another factor related with the location of residence is the group of people who migrate from their original place of dwelling to a new place in search of work as identified by some studies. Atkinson and Messy (2013) is one of such studies. Agarwalla et al. (2013) highlighted that there are few factors that are specific to India, such as joint family and consultative decision-making process that influence financial literacy significantly. Thus, nature of the family is considered for the study. Further, Murmu (2022) found that among select Mizos, the highest percentage of high financial literacy is possessed by family with 2-4 members, which is found inconsistent with the findings of Sekar and Gowri (2015) where the finding shows that financial literacy increases with the increase in the number of dependents. Thus, size of the family is selected as one of the variables for the study. Level of income is a major factor casting its impact on most of our decisions, be it financial literacy or financial inclusion. If income is high, it is assumed that the person is financially included and has greater opportunity for financial literacy as well. Hogart and Hilgert (2002), Bhushan et. al. (2013), Kamboj (2017), NCFE (2019) and Murmu (2022) etc. selected this as a variable for their study and shows that financial literacy increases with the increase in income level of the respondents. Bhanot, Bapat and Bera (2012) pointed out that awareness about self-help groups (SHGs) is one of the highly influential factors. Membership of Self-Help Groups makes it possible for poor people to access formal credit. If the SHG is having Credit linkage, then access become even easier. To check these hypotheses, these two factors have been considered for the study. Murmu (2022) conducted a study of Mizos, and found that the government employees possessed better financial literacy. The findings of Bhushan and Medury (2013), Kamboj (2017), Vidya (2017) and NCFE (2019) also found the same. Thus, type of employment is considered for the study as a variable for testing financial literacy and financial inclusion. There are many studies which found that distance is one the factors that decide the level of financial inclusion in rural areas, like Tuesta et al. (2015); Nandru, Byram and Rentala (2016), Bhuvana and Vasantha (2016), Zulfiqar, Chaudhary and Aslam (2016), and Abel, Mutandwa and Roux (2018). Considering these studies, distance from the nearest bank branch has been considered for the study as a factor. Singh (2019) considered ownership of mobile as one of the factors while studying financial inclusion. Abel, Mutandwa and Roux (2018) found that the internet connectivity and financial literacy are positively related to financial inclusion. Nandru, Byram and Rentala (2016) found that information and communication technology (ICT) play a significant role in usage of banking services. Thus, ownership of mobile and access to internet are considered for the present study. In addition to these two factors, number of mobiles in the family, ownership of personal computer, computer operation skills and ownership of vehicles are selected for the study. A good number of studies in Mizoram and other places have considered ownership of savings bank account while discussing financial inclusion. Vanlalmuana and Gupta (2015) highlighted that in Mizoram, school teachers did not go beyond a basic savings account despite the fact they are better educated and well equipped with financial resources. Another study by Sailo and Singh (2019) found that financial literacy is relatively low among college teachers in Aizawl. Nandru, Byram and Rentala (2016) found that income level is a key factor, which influence financial inclusion as measured by the ownership of bank account. Demirgiig-Kunt et al. (2015) studied ownership of savings account in formal and informal sector as a factor deciding financial inclusion. Thus, having savings bank account is considered as one of the factors in the present study. The present study has incorporated personal loan from formal and informal sources as one of the factors after taking into consideration studies like Danes and Hira (1987), which took personal loans as one of the factors determining financial knowledge of the respondents. Personal loan is directly associated with financial inclusion as well. Thus, three variables, viz., loan from formal sources, loan from informal sources and on-going loans are considered for the study. Murmu (2022) and Wagner (2019) found that people who received financial education are more likely to have higher financial literacy scores. Abel, Mutandwa and Roux (2018) found that financial literacy is positively related to financial inclusion. Considering this, experience of attending financial literacy programme, awareness about consumer rights and status of financial inclusion/ financial literacy have been considered for the study. 6.2 Calculation of Financial Inclusion and Financial Literacy Score The Financial Inclusion score and Financial Literacy score have been generated by using OECD/INFE Toolkit13 (May 2018 version) for measuring financial literacy and financial inclusion. This is an updated version of the toolkit welcomed by G20 leaders in September 2013 and used in OECD publications. The financial inclusion score for each of the respondents is calculated using a combination of questions as per the OECD toolkit. The respondents were awarded one point if he/she holds at least one payment product out of a range of products, one point if he/she holds at least one savings, investment or retirement product. Similarly, one point awarded if respondents hold an insurance product, one point for holding any one credit product. Further, one point was awarded if respondents were found aware about at least 05 products across the category mentioned above. If the respondents availed any financial product in recent past (last 2 years), another one point is awarded and one point is awarded if the respondents relying on family and friends in place of going for loan. Altogether, financial inclusion score ranges between 0 and 7. The financial literacy score of each of the respondents, as per OECD toolkit, is derived under three sub-heads, viz. financial knowledge (07 points), financial behaviour (09 points) and financial attitude (05 points). The financial knowledge score is computed as the number of correct responses to the seven questions asked to estimate financial knowledge. Total score for financial knowledge ranges between 0 and 7. The behaviour score is computed as a count of the number of “financially savvy” behaviour relating to budgeting (two questions for one point), active saving (one point), avoiding borrowing to make ends meet (two questions for one point) choosing products (various questions are used for creating two points on this score), keeping watch on financial affairs (one point), striving to achieve goals (one point), making considered purchases (one point), paying bills on time (one point). Total score for financial behaviour ranges between 0 and 9. The financial attitude score is computed as the average response across three attitude questions (recorded on 5 points Likert scale), i.e., the sum of the values for the three statements divided by three. The attitudes score, therefore, ranges between 1 and 5. The overall financial literacy score is obtained as the sum of the three previous scores, financial knowledge (07), financial behaviour (09) and financial attitudes (05). It can take any value between 1 and 21. As per the OECD toolkit, the score could be normalised to 100 by multiplying by 100/21. The questionnaire used for the primary data collection is appended separately as a google form (Annexure 3). 6.3 Reasons for Selecting Non-Parametric Statistical Tools for Analyses With regard to the test of Normality and selection of statistical tools, the data collected from 523 respondents was tested for normality. The Shapiro-Wilk’s test (W = 0.986; p = 0.000) showed that the financial literacy scores were not normally distributed. The test revealed that the data had skewness of -0.360 (SE = 0.107, z = -3.36) and a kurtosis of -0.167 (SE = 0.213, z = -0.78) for financial literacy. Further, the Shapiro-Wilk’s test (W = 0.945; p = 0.000) showed that the financial inclusion scores were also not normally distributed. The test revealed that the data have skewness of -0.053 (SE = 0.107, z = -0.50) and a kurtosis of -1.020 (SE = 0.213, z = -4.79) for the financial inclusion. Considering the Shapiro-Wilk’s test statistic and the test of skewness and kurtosis, it was concluded that the series, viz., financial literacy and financial inclusion scores, were not normally distributed. As the distribution was not normal, parametric tests could not be applied on the data. Thus, only non-parametric statistical tools have been used in the process of data analyses and interpretation. 6.4 Status of Financial Inclusion in Mizoram In order to estimate the level of financial inclusion regarding the status of awareness and actual holding of various savings, investments, payment, retirement, insurance, credit products, recent financial product choice and preference for relying on family and friends in the time of need, an index/ score for each of the respondents were created on a scale of 0 to 7 points. This scale was used to compare the differences on each of the selected variables. In case of two groups in the variable (e.g., Nuclear and Joint family under the variable Nature of Family), Mann-Whitney U Test is applied. On the other hand, if there were more than two groups in the variable (e.g., ‘Up to 30 years’, ‘Between 30 and 40 years’ and ‘More than 40 years’ under the variable Age group) Kruskal-Wallis H Test was applied. Kruskal-Wallis H Test used to compare more than two groups and was found to be significant. Pairwise test comparisons were made using the Dunn-Bonferroni approach, and as a number of variables were used simultaneously, significance values were adjusted by the SPSS Bonferroni correction for multiple tests. On other hand, if the Kruskal-Wallis H Test results were found to be insignificant, no further post-hoc test applied, as in this case all the individual pairs were found statistically not significant. Along with test statistic and the significance value, the effect size was reported for each of the tests. Table 6.3 represents the block and district-wise spread of sample across and score of the respondents in each of the 8 blocks. | Table 6.3: Spread of Sample of Respondents on Financial Inclusion Score | | Blocks and Districts (Residence) | Financial Inclusion Score (scale: 0-7) | Total | | 0 | 1 | 2 | 3 | 4 | 5 | 6 | 7 | | | Tlangnuam (Aizawl) | Count | 1 | 12 | 13 | 12 | 16 | 11 | 11 | 1 | 77 | | Block respondents (%) | 1.3 | 15.6 | 16.9 | 15.6 | 20.8 | 14.3 | 14.3 | 1.3 | 100 | | Thingsulthliah (Aizawl) | Count | 20 | 3 | 1 | 6 | 11 | 7 | 8 | 2 | 58 | | Block respondents (%) | 34.5 | 5.2 | 1.7 | 10.3 | 19.0 | 12.1 | 13.8 | 3.4 | 100 | | Sub- Total Aizawl | Count | 21 | 15 | 14 | 18 | 27 | 18 | 19 | 3 | 135 | | Block respondents (%) | 15.6 | 11.1 | 10.4 | 13.3 | 20.0 | 13.3 | 14.1 | 2.2 | 100 | | W. Phaileng (Mamit) | Count | 2 | 6 | 9 | 12 | 6 | 9 | 7 | 9 | 60 | | Block respondents (%) | 3.3 | 10.0 | 15.0 | 20.0 | 10.0 | 15.0 | 11.7 | 15.0 | 100 | | Zawlnuam (Mamit) | Count | 1 | 6 | 10 | 29 | 13 | 4 | 0 | 0 | 63 | | Block respondents (%) | 1.6 | 9.5 | 15.9 | 46.0 | 20.6 | 6.3 | 0.0 | 0.0 | 100 | | Sub- Total Mamit | Count | 3 | 12 | 19 | 41 | 19 | 13 | 7 | 9 | 123 | | Block respondents (%) | 2.4 | 9.8 | 15.4 | 33.3 | 15.4 | 10.6 | 5.7 | 7.3 | 100 | | Champhai (Champhai) | Count | 21 | 20 | 9 | 7 | 1 | 0 | 1 | 2 | 61 | | Block respondents (%) | 34.4 | 32.8 | 14.8 | 11.5 | 1.6 | 0.0 | 1.6 | 3.3 | 100 | | Ngopa (Champhai) | Count | 0 | 0 | 0 | 3 | 19 | 26 | 10 | 3 | 61 | | Block respondents (%) | 0.0 | 0.0 | 0.0 | 4.9 | 31.1 | 42.6 | 16.4 | 4.9 | 100 | | Sub- Total Champhai | Count | 21 | 20 | 9 | 10 | 20 | 26 | 11 | 5 | 122 | | Block respondents (%) | 17.2 | 16.4 | 7.4 | 8.2 | 16.4 | 21.3 | 9.0 | 4.1 | 100 | | Chawngte (Lawngtlai) | Count | 2 | 12 | 6 | 4 | 11 | 10 | 9 | 3 | 57 | | Block respondents (%) | 3.5 | 21.1 | 10.5 | 7.0 | 19.3 | 17.5 | 15.8 | 5.3 | 100 | | Sangau (Lawngtlai) | Count | 8 | 11 | 9 | 9 | 14 | 13 | 14 | 8 | 86 | | Block respondents (%) | 9.3 | 12.8 | 10.5 | 10.5 | 16.3 | 15.1 | 16.3 | 9.3 | 100 | | Sub- Total Lawngtlai | Count | 10 | 23 | 15 | 13 | 25 | 23 | 23 | 11 | 143 | | Block respondents (%) | 7.0 | 16.1 | 10.5 | 9.1 | 17.5 | 16.1 | 16.1 | 7.7 | 100 | | Grand Total | Count | 55 | 70 | 57 | 82 | 91 | 80 | 60 | 28 | 523 | | Block respondents (%) | 10.5 | 13.4 | 10.9 | 15.7 | 17.4 | 15.3 | 11.5 | 5.4 | 100 | | Sources: Field survey; and Authors’ estimates. | Regarding the awareness among the respondents about various savings and investment schemes, a low level of awareness was found for most of the schemes. Less than 15 per cent of the respondents were found using any of the select schemes, except savings bank account (Table 6.4). | Table 6.4: Awareness and Use of Select Savings/Investment Schemes | | Name of Scheme | Do not know | Know, but not used | Know and used | | Savings Account (SB A/c) | 82 (15.7) | 162 (31.0) | 279 (53.3) | | Fixed Deposit (FD) | 213 (40.7) | 233 (44.6) | 77 (14.7) | | National Savings Certificate | 354 (67.7) | 120 (22.9) | 49 (9.4) | | Kisan Vikas Patra (KVP) | 368 (70.4) | 98 (18.7) | 57 (10.9) | | Public Provident Fund (PPF) | 291 (55.6) | 184 (35.2) | 48 (9.2) | | Pension Funds | 281 (53.7) | 186 (35.6) | 56 (10.7) | | Mutual Funds (MF) | 293 (56.0) | 160 (30.6) | 70 (13.4) | | Stock and shares | 331 (63.3) | 134 (25.6) | 58 (11.1) | | Debentures or Bonds | 367 (70.2) | 111 (21.2) | 45 (8.6) | | Commodities Market | 358 (68.5) | 110 (21.0) | 55 (10.5) | | Forex Market | 359 (68.6) | 108 (20.7) | 56 (10.7) | | Sources: Field survey; and Authors’ estimates. | Regarding the method of payment used by the respondents, it was found that a sizeable fraction of the population was not aware about popular payment options available in the market. About 45 per cent were found using debit cards whereas 36 per cent were found using mobile payments. Other two modes were used by less than 20 per cent of the respondents (Table 6.5). | Table 6.5: Awareness about and Use of Select Payment Options | | Name of Scheme | Do not know | Know, but not used | Know and used | | Debit Card | 141 (27.0) | 148 (28.3) | 234 (44.7) | | Credit Card | 212 (40.5) | 215 (41.1) | 96 (18.4) | | Mobile Payments | 182 (34.8) | 151 (28.9) | 190 (36.3) | | Prepaid Card | 332 (63.5) | 122 (23.3) | 69 (13.2) | | Sources: Field survey; and Authors’ estimates. | An important aspect of financial inclusion was the use of insurance products. It was found that the respondents were less aware about the insurance and use of insurance was even lesser (see Table 6.6). | Table 6.6: Awareness about and Use of Life Insurance | | Name of Scheme | Do not know | Know, but not used | Know and used | | Life Insurance Policy | 199 (38.1) | 176 (33.7) | 148 (28.3) | | Sources: Field survey; and Authors’ estimates. | Table 6.7 presents an overview of awareness about different credit products. The survey result finds a low awareness about such products, which reflects low C-D ratio14 of Mizoram. | Table 6.7: Awareness about and Use of Credit products | | Name of Scheme | Do not know | Know, but not used | Know and used | | Home Loan | 183 (35.0) | 262 (50.1) | 78 (14.9) | | Vehicle Loan | 191 (36.5) | 252 (48.2) | 80 (15.3) | | Loan against property | 269 (51.4) | 196 (37.5) | 58 (11.1) | | Unsecured Loan | 328 (62.7) | 145 (27.7) | 50 (9.6) | | Loan from SHG | 223 (42.6) | 232 (44.4) | 68 (13.0) | | Sources: Field survey; and Authors’ estimates. | An attempt was made to assess the level of awareness and use of select popular government schemes related to financial inclusion. It was found that general awareness was less among the respondents and further there were significant proportion of people who were aware about the schemes but were not availing the same (Table 6.8). | Table 6.8: Awareness and Use of Select Government Schemes | | Name of Scheme | Do not know | Know, but not used | Know and used | | Prime Minister Jan Dhan Yojna | 237 (45.3) | 199 (38.0) | 87 (16.6) | | Atal Pension Scheme (APS) | 262 (50.1) | 200 (38.2) | 61 (11.7) | | PM Suraksha Bima Yojana | 284 (54.3) | 150 (28.7) | 89 (17.0) | | PM Jeevan Jyoti Bima Yojana | 280 (53.5) | 155 (29.6) | 88 (16.8) | | PM Jan Arogya Yojana | 332 (63.5) | 133 (25.4) | 58 (11.1) | | Pradhan Mantri Mudra Yojana | 310 (59.3) | 157 (30.0) | 56 (10.7) | | Direct Benefit Transfer (DBT) | 293 (56.0) | 173 (33.1) | 57 (10.9) | | Source: Field survey. | The level of knowledge about the existing financial institutions, such as NBFCs, MFIs and SFBs, was found to be low. Surprisingly, good awareness about payment banks was found among respondents. However, use of the facility was not very encouraging. Self-Help Groups had a similar status. Most of the people knew but were not part of any such groups (Table 6.9). | Table 6.9: Awareness about Financial Institutions | | Name of Institutions | Do not know | Know, but not used | Know and used | | Non-Banking Financial Corporations (NBFCs) | 295 (56.4) | 172 (32.9) | 56 (10.7) | | Microfinance institutions (MFIs) | 346 (66.2) | 109 (20.8) | 68 (13.0) | | Self Help Groups (SHGs) | 144 (27.5) | 307 (58.7) | 72 (13.8) | | Small Finance Banks (SFBs) | 289 (55.3) | 171 (32.7) | 63 (12.0) | | Payment Banks, viz., India Post, Airtel Bank, PayTM, etc. | 89 (17.0) | 237 (45.3) | 197 (37.7) | | Sources: Field survey; and Authors’ estimates. | 6.4.i Empirical Result: Financial Inclusion (Charts are given in Annexure I.a) To evaluate the impact of various factors that might decide the status of financial inclusion, empirical tests were conducted. There were 27 factors identified for the study, which have been discussed earlier in the report in the section 6.1. The impact of each of the factors is presented below. District-wise Financial Inclusion Score The distribution of Financial Inclusion Score was the same across all eight blocks spread over four districts of the State. Kruskal-Wallis H Test revealed insignificant differences (Table 6.10). The hypothesis that few districts enjoyed better financial inclusion was rejected as the difference between financial inclusion score of four district were not found to be significant. | Table 6.10: Kruskal-Wallis H Test result | | H(3) | 5.149 | | Asymp. Sig | 0.161 | | η2 | 0.004 (negligible effect) | | Number of districts studied in Aizawl | 135 | | Number of districts studied in Mamit | 123 | | Number of districts studied in Champhai | 122 | | Number of districts studied in Lawngtalai | 143 | Block-wise Financial Inclusion Score The Kruskal-Wallis H Test revealed significant differences (Table 6.11). As the significant difference is found in the Financial Inclusion Score across blocks, a further step in evaluating two blocks at a time was attempted to identify which two pair of blocks were showing significant difference. | Table 6.11: Table Kruskal-Wallis H Test result | | H(7) | 107.386 | | Asymp. Sig | .000 | | η2 | 0.195 (large effect) | | Block (Sihphir) n | 77 | | Thingsulthliah, n | 58 | | W.Phaileng, n | 60 | | Zawlnuam, n | 63 | | Ngopa, n | 61 | | Chawngte n | 57 | | Sangau, n | 86 | Gender and Financial Inclusion Mann-Whitney U Test was applied. The in-depth analysis led to the conclusion that in Mizoram, gender was not a significant factor deciding the status of financial inclusion (Table 6.12). | Table 6.12: Mann-Whitney U Test Result | | Males (Mean Rank) | 260.68 | | Η | 4254 | | Female (Mean Rank) | 263.25 | | Median | 3.0 | | n | 269 | | U | 33828.0 | | z | 0.196 | | p | 0.845 (insignificant) | | r | 0.01(negligible effect) | Age Group and Financial Inclusion Kruskal-Wallis H Test revealed insignificant differences in the level of financial literacy across age groups (Table 6.13). | Table 6.13: Kruskal-Wallis H Test | | H(2) | 2.907 | | Asymp. Sig | .234 | | η2 | 0.002 (negligible effect) | | up to 30 years n | 213 | | between 30 to 40 years n | 158 | | more than 40 years n | 152 | Nature of Family While evaluating the difference between nuclear family and joint family, Mann-Whitney U Test revealed significant difference in the scores of nuclear families. Possibly, the chances that individual members would benefit from the awareness and assistance from already financially included members of the family in getting access to and usage of financial services remained higher in case of joint family (Table 6.14). | Table 6.14: Mann-Whitney U Test | | Nuclear families Mean Rank | 248.10 | | nuclear families Median Rank | 3.0 | | η | 261 | | Joint families Mean Rank | 275.85 | | Joint families Median = | 4.0 | | n | 262 | | U | 30563.5 | | z | -2.120 | | p | 0.034 | | r | 0.09 (negligible effect) | Size of Family The Kruskal-Wallis H Test revealed statistically not very significant difference in the level of financial literacy by size of the family. As no significant difference was found, post-hoc test for pair-wise comparison was not performed (Table 6.15) | Table 6.15: Kruskal-Wallis H Test Result | | H(2) | 3.376 | | Asymp. Sig | .185 | | η2 | 0.003 (negligible effect) | Level of Income To evaluate if the distribution of Financial Inclusion Score was the same across all income levels, Kruskal-Wallis H test was applied. The test revealed significant differences (Table 6.16). Dunn’s pairwise tests were carried out for the six pairs of groups. There was very strong evidence (p = 0.003, adjusted using the Bonferroni correction) of a difference between the group ‘income up to Rs.60,000’ and ‘income more than Rs.4,80,000’. There was no evidence of a difference between the remaining five pairs. Thus, the hypothesis that respondents with higher income enjoyed better financial inclusion was supported. | Table 6.16: Kruskal-Wallis H Test Result | | H(3) | 13.249 | | Asymp. Sig. | .004 | | η2 | 0.02 (small effect) | | P | 0.004 | Marital Status The Kruskal-Wallis H Test revealed statistically not significant differences in the level of financial inclusion by marital status (Table 6.17). Thus, a post-hoc analysis of pairwise comparisons was not considered. The test results were not found to be significant, and the finding failed to reject the hypothesis that there was no statistically significant difference in financial inclusion score across all marital status of the respondents. | Table 6.17: Kruskal-Wallis H Test | | H(2) | 4.292 | | Asymp. Sig | 0.117 | | η2 | 0.004 (negligible effect) | Educational Qualification The test revealed significant differences in the level of financial inclusion for level of education (Table 6.18). Kruskal-Wallis test provided very strong evidence of a difference (p < 0.000) between the mean ranks of at least one pair of groups. Dunn’s pairwise tests were carried out for all the six pairs of groups. There was very strong evidence (p < 0.000, adjusted using the Bonferroni correction) of a difference between the group ‘education up to Class 10th’ and the group ‘Graduates’. | Table 6.18: Kruskal-Wallis Test Result | | H(3) | 28.581 | | Asymp. Sig | 000 | | η2 | 0.049 (small effect) | Further, there was a very strong evidence (p < 0.001, adjusted using the Bonferroni correction) of a difference between the group ‘education up to Class 10th’ and the group ‘Postgraduates’. Furthermore, there was evidence (p < 0.045, adjusted using the Bonferroni correction) of a difference between the group ‘education up to Class 10th’ and the group ‘education up to Class 12th’. Thus, the hypothesis that with education, financial inclusion increases is supported. There was no evidence of a difference between the remaining three pairs. The results underlined the fact that financial inclusion score of respondents can be improved by improving the educational qualification. Subjects Studied by Respondents To evaluate if the distribution of Financial Inclusion Score is the same across subject studies, Kruskal-Wallis H Test was applied. The test revealed significant differences in the level of financial inclusion based on the stream of studies (Table 6.19). Kruskal-Wallis test provided very strong evidence of a difference (p < 0.000) between the mean ranks of at least one pair of groups. Dunn’s pairwise tests were carried out for all the six pairs of groups. There was a very strong evidence (p < 0.000, adjusted using the Bonferroni correction) of a difference between the group ‘Arts stream’ and the group ‘other stream’. Further, there was evidence (p < 0.000, adjusted using the Bonferroni correction) of a difference between the group ‘Arts stream’ and the group ‘Science stream’. There was no evidence of a difference between the remaining four pairs. | Table 6.19: Kruskal-Wallis H Test Result | | H(3) | 38.721 | | Asymp. Sig | 000 | | η2 | 0.069 (medium effect) | Membership of Self-Help Groups To evaluate the difference between the respondents who were members of certain Self-Help Groups (SHGs) and those who were not a member of any SHGs for financial inclusion score was tested using Mann-Whitney U Test. The test result is presented in Table 6.20. | Table 6.20: Kruskal-Wallis H Test result | | not members of any SHG- Mean Rank | 256.31 | | not members of any SHG - Median | 3.0 | | n | 435 | | members of SHG Members - Mean Rank | 290.11 | | Median | 4.0 | | n | 88 | | U | 16666.5 | | z | -1.932 | | p | 0.053 | | r | 0.084 | Out of total 523 respondents of the study, only 88 reported to be a member of SHG. A further question was asked to such respondents that if their SHG was credit linked or not. 74 out of 88 reported that their SHG is credit linked. Mann-Whitney U Test was applied to see if there was any difference in the level of financial inclusion of these two groups, the test revealed that the difference was not statistically significant (U = 515.5, z = -0.029, p = 0.977, r= 0.003 (negligible effect). Out of 74 respondents, who reported to be a member of a credit-linked SHGs, a further question was asked that if they had availed credit from the SHG. In response to the query, 69 respondents reported that they have taken loan from the SHG. Mann-Whitney U Test was applied to see if there was any difference in the level of financial inclusion of these two groups (members who availed credit from SHG and those who had not availed credit). The test revealed that the difference was not statistically significant. The sample at this stage became very small (only 08 out of 74 did not took loan) to give conclusive evidence of significance. Employment Status To evaluate if the distribution of Financial Inclusion Score was the same across employment types, Kruskal-Wallis H Test was applied. The test revealed significant differences [H(3) = 13.522; Asymp. Sig. = .004; η2 = 0.02 (small effect)] in the level of financial inclusion for employment types. Kruskal-Wallis test provided very strong evidence of a difference (p = 0.004) between the mean ranks of at least one pair of groups. Dunn’s pairwise tests were carried out for all the six pairs of groups. There was very strong evidence (p = 0.003, adjusted using the Bonferroni correction) of a difference between the group ‘unemployed’ and the group ‘government employees’. Thus, the hypothesis that the government jobholders are better financially included as compared to unemployed was supported. There was no evidence of a difference between the remaining five pairs. People working in government sector have a regular source of income and are considered more financially bankable from the financial institutions’ point of view. Thus, they are financially better covered by various financial instruments. The finding is in the line with many other studies conducted throughout the globe. In many cases, unemployed youth is a group that is vulnerable in financial exclusion. Distance from Bank Branch To evaluate the difference between respondents residing within one (01) kilometre distance from the nearest bank branch and respondents residing more than one (01) kilometre distance from the nearest bank branch for financial Inclusion score was tested using Mann-Whitney U Test. The test revealed statistically not significant difference in the scores of people residing within one (01) kilometre (Mean Rank = 263.68; Median = 4.0; n = 362) and respondents residing more than one (01) kilometre from branch (Mean Rank = 258.23; Median = 3.0; n = 161), U = 28534, z = -0.384, p = 0.701, r = 0.02 (negligible effect). Contrary to this, Zulfiqar, Chaudhary and Aslam (2016), Abel, Mutandwa and Roux (2018) and Bhuvana and Vasantha (2016) reported that distance from bank branch is a barrier to financial inclusion. Status of Migration Out of total 523 respondents, 68 respondents reported to be a migrant. They all migrated from different places within Mizoram to their present place of livelihood. To identify difference, if any, between financial inclusion scores of respondents who had migrated (Mean Rank = 259.60; Median = 3.5; n= 68) and the respondents who had not migrated (Mean Rank = 262.36; Median = 3.0; n= 455), Mann-Whitney U Test was applied. The test found no significant difference between both the groups (U = 15306.50, z = -0.142, p =0.887, r = 0.006 (negligible effect). Ownership of Vehicles To evaluate if the distribution of Financial Inclusion Score is the same across the group of people who had personal vehicle, commercial vehicle or did not have any vehicle, Kruskal-Wallis H Test was applied. The test revealed significant differences [H(2) = 8.457; Asymp. Sig. = .015; η2 = 0.012 (small effect)] in the level of financial Inclusion for vehicle ownership. Kruskal-Wallis test provided evidence of a difference (p = 0.015) between the mean ranks of at least one pair of groups. Dunn’s pairwise tests were carried out for all the three pairs of groups. There was evidence (p = 0.022, adjusted using the Bonferroni correction) of a difference between the group ‘having no vehicle’ and the group ‘having personal vehicle. There was no evidence of a difference between the remaining two pairs. Ownership of personal vehicle was, in general, not possible for poor families. So, this difference may also be similar as difference between the income groups as discussed earlier. Ownership of Personal Computer To identify difference, if any, between financial inclusion scores of respondents having personal computer (Mean Rank = 287.76; Median = 4.0; n= 252) and respondents not having personal computer (Mean Rank = 238.04; Median = 3.0; n= 271) Mann-Whitney U Test was applied. The test found significant difference between both the groups (U = 27654.0, z = -3.796, p = 0.000, r = 0.17(small effect). Computer Skills To identify difference, if any, between financial inclusion scores of respondents having skill to run a computer (Mean Rank = 284.98; Median = 4.0; n= 290) and respondents not having skill to run a computer (Mean Rank = 233.39; Median = 3.0; n= 233), Mann-Whitney U Test was applied. The test found a significant difference between both the groups (U = 27120.0, z = -3.918, p = 0.000, r = 0.17 (small effect). A skill to run computer opens up a job prospect. In addition to this, it becomes easier for people with computer and internet to access better and more updated information about happenings in the field of personal finance. Although, this is not the only way to access such information, now-a-days mobile is being used more that computer to get such information. However, still computing skill helps to access information and opens up job opportunities / self-employment and it is found significant in the present study as well. The stakeholders may focus on imparting computing skills among the people of vulnerable groups which may help improving status of financial inclusion. Ownership of Mobiles Chart 18 in Annexure 1 presents the financial inclusion score of the respondents segregated on ownership of mobile. To identify difference, if any, between financial inclusion scores of respondents having mobile (Mean Rank = 263.78; Median = 4.0; n= 509) and respondents not having mobile (Mean Rank = 197.18; Median = 2.0; n= 14), Mann-Whitney U Test was applied. The test found no significant difference between both the groups (U = 2655.50, z = -1.643, p = 0.100, r = 0.07 (negligible effect). In the present study, the respondents not having mobile were comparatively very less (only 14 out of 523), as this survey was mainly conducted online. Access to Internet on Mobile To identify difference, if any, between financial inclusion scores of respondents having internet/ GPRS facility on mobile (Mean Rank = 265.08; Median = 4.0; n = 494) and respondents not having internet/ GPRS facility on mobile (Mean Rank = 209.59; Median = 2.0; n = 29), Mann-Whitney U Test was applied. The test found no significant difference between both the groups (U = 5643.0, z = -1.941, p = 0.052, r = 0.085 (negligible effect). The number of respondents without internet facility on mobile was very less in the present study and the effect size was found to be negligible. Number of Mobiles in Household To identify difference, if any, between financial inclusion scores of respondents having up to three mobiles in the household (Mean Rank = 253.24; Median = 3.0; n = 201) and respondents having more than three mobiles in the household (Mean Rank = 267.47; Median = 4.0; n = 322), Mann-Whitney U Test was applied. The test found no significant difference between both the groups (U = 30601.0, z = -1.057, p = 0.290, r = 0.05 (negligible effect). Ownership of Savings Account Chart 21 in Annexure 1 presents the financial inclusion score of the respondents segregated on ownership of saving bank account. To identify difference, if any, between financial inclusion scores of respondents having savings bank account in a Bank or Post Office (Mean Rank = 263.40; Median = 3.5; n = 510) and respondents not having savings bank account in a Bank or Post Office (Mean Rank = 207.12; Median = 2.0; n= 13), Mann-Whitney U Test was applied. The test found no significant difference between both the groups (U = 2601.50, z = -1.339, p = 0.181, r = 0.06 (negligible effect). Having a savings bank account is the first step towards financial inclusion, but it is not everything. Most of the respondents (510 out of 523, i.e., 97.5 per cent) found having a savings bank account, while average score in financial literacy was 3.35 out of 7 (i.e., 48 per cent approx.) with a median score of 3.0. A good number of accounts have been opened under PM Jan Dhan Yojna (PMJDY), which has helped improve the status of having bank account, but still a lot needs to be done in the way to reach the destination of satisfactory financial inclusion. Formal Credit To identify difference, if any, between financial inclusion scores of respondents who have availed formal credit, e.g., Bank Loan (Mean Rank = 276.37; Median = 4.0; n = 311) and respondents who had never availed formal credit (Mean Rank = 240.92; Median = 3.0; n = 212), Mann-Whitney U Test was applied. The test found a significant difference between both the groups (U = 28498.0, z = -2.659, p = 0.008, r = 0.02 (small effect). The hypothesis that the people with better financial inclusion score avail formal credit is supported. This is not surprising to find people with better financial inclusion score avoiding informal credit and resorting to formal sources like bank. Informal Credit To identify difference, if any, between financial inclusion scores of respondents who had availed informal credit (Mean Rank = 284.18; Median = 4.0; n = 65) and respondents who had not availed informal credit (Mean Rank = 258.85; Median = 3.0; n = 458), Mann-Whitney U Test was applied. The test found no significant difference between both the groups (U = 13443.5, z = -1.277, p = 0.202, r = 0.06 (negligible effect). Majority of the respondents did not avail (458 out of 523, i.e., 87.6 per cent) informal source of credit (e.g., moneylender, etc.). Only 65 out of 523 respondents reported taking loan from informal sources, and this group has performed better in financial inclusion score, although the difference is not significant. Ongoing Loan To identify difference, if any, between financial inclusion scores of respondents who were having a loan at the time of survey (Mean Rank = 296.0; Median = 4.0; n = 252) and respondents were not having any loan at the time of survey (Mean Rank = 230.38; Median = 3.0; n = 271), Mann-Whitney U Test was applied. The test found significant difference between both the groups (U = 25577, z = -5.011, p = 0.000, r = 0.22 (small effect). Thus, the hypothesis that ‘the people with ongoing loan are more financially included than those who are not having a loan at present’, was supported. Financial Literacy Programme To identify difference, if any, between financial inclusion scores of respondents who attended financial literacy programmes earlier (Mean Rank = 270.82; Median = 4.0; n=181) and respondents who had never attended financial literacy programs earlier (Mean Rank = 257.33; Median = 3.0; n= 342), Mann-Whitney U Test was applied. The test found no significant difference between both the groups (U = 29354.00, z = -0.981, p = 0.327, r = 0.04 (negligible effect). Attending financial literacy programme helps improving financial literacy, which, in turn, should improve the level of financial inclusion. However, this is not happening in the State. Although the financial literacy score of the people who had attended financial literacy workshops were found to be comparatively higher than the scores of those who had never attended such workshops, however, this difference was not significant. The stakeholders, especially the organisation funding such workshops should ascertain if such programmes were serving the needs of the local people. About 37 per cent of all male respondents and 32.3 per cent of female respondents attended financial literacy programmes. Only 12.3 per cent of respondents from Champhai attended financial literacy programme whereas more than 50 per cent respondents from Aizawl attended such workshops. More than 95 per cent respondents from Nagopa block of Champhai had never attended any programme on financial literacy while less than 14 per cent respondents from Thingsulthliah block of Aizawl had not attended such programme. It may be concluded from this finding that more such programmes were being conducted in State capital. Awareness of Consumer Rights All the respondents were asked eight questions15 to check their awareness about banking services. The respondents who gave at least five correct answers were considered aware and those knowing four or less correct answers were considered with low awareness about consumer rights. To identify difference, if any, between financial inclusion scores of respondents who were found aware about consumer rights (Mean Rank = 259.32; Median = 4.0; n = 249) and respondents who were found not well aware about consumer rights (Mean Rank = 264.43; Median = 3.0; n = 274), Mann-Whitney U Test was applied. The test found no significant difference between both the groups (U = 33446.0, z = -0.390, p = 0.696, r = 0.02 (negligible effect). Awareness about consumer rights has shown an impact on financial literacy (discussed earlier), but the awareness is not getting translated into financial inclusion. Financial Literacy Scores To identify differences, if any, between financial inclusion scores of respondents who were found having high financial literacy (Mean Rank = 261.53; Median = 4.0; n = 251) and respondents who were found having low financial literacy (Mean Rank = 262.44; Median = 3.0; n = 272), Mann-Whitney U Test was applied. The test found a significant difference between both the groups (U = 34017.0, z = -0.070, p = 0.945, r = 0.003 (negligible effect). Thus, the hypothesis that financial literacy is higher among those who are better financially included was rejected. 6.4.ii Logistic Model for Financial Inclusion A logistic regression analysis to investigate if there is a relationship between selected variables and the financial inclusion scores was conducted. For the purpose of the Binary Logistic Regression Analysis, all the scores of financial inclusion of the respondents were divided into two groups, viz, High and Low. In order to decide the cut-off level for the same, median point (i.e., 3.0) was used, i.e., everyone who scored above the median score were placed in High group and all respondents who scored up to the median score were considered in the Low group. Out of twenty-seven (27) variables considered (and discussed above) for the logistic regression analysis, only five (05) predictor variables (viz., Block of residence, Subjects studied, Educational level, Possession of vehicle and Availed formal credit) were found to be contributing to the model. The Logistic Regression Model was run multiple times with different combination of 27 factors identified for the study, starting with those variables that gave large or moderate effect size and going through each of the factors. After the multiple testing, five variables, viz., Block of residence, Subjects studied, Educational level, Possession of vehicle and Availed formal credit, were selected as these variables gave the best fit of the model. Few of the selected variables were not found significant at 0.05 level, but still were considered as they contributed towards the predictability of the overall model. The variable ‘Block of residence’ was represented by eight dummy variables, viz., Tlangnuam (Aizawl), Thingsulthliah (Aizawl), W. Phaileng (Mamit), Zawlnuam (Mamit), Chawngte (Lawngtlai), Sangau (Lawngtlai), Ngopa (Champhai) and Champhai (Champhai), with the last category (Champhai (Champhai)) designated as the reference group. The variable ‘Subjects studied’ was represented by four dummy variables, viz., Arts, Commerce/Economics, Science and Others, with the last category (Others) designated as the reference group. The variable educational level was represented by four dummy variables, viz., Postgraduate, Undergraduate, Up to Class 12th and Up to Class 10th, with the last category (viz., Up to Class 10th) designated as the reference group. The variable ‘Possession of vehicle’ was represented by three dummy variables, viz., Commercial Vehicle, Personal Vehicle and Do not have any vehicle with the last category (viz., Do not have any vehicle) designated as the reference group. The fifth variable ‘Formal Credit’ was a dichotomous variable, ‘YES’ representing those who have availed a loan from any formal source, e.g., Bank, and ‘NO’ representing those who have never availed any formal credit. The unstandardised Beta weight for Constant; β = -2.447, SE = 0.684, Wald = 12.786, p < 0.000. The unstandardised Beta weight for various predictor variables used in the Binary Logistic Model are as under (Table 6.21): | Table 6.21: Variables in the Logistic Model for Financial Inclusion | | Variables | Financial Inclusion
(figures within parentheses are percentages) | Wald | Sig. | Exp(β) Odds Ratio | 95 per cent C.I. for EXP(β) | | Low | High | Lower | Upper | | Champhai (Champhai) | 57 (21.6) | 4 (1.5) | 57.610 | .000 | | | | | Ngopa (Champhai) | 3 (1.1) | 58 (22.4) | 40.024 | .000 | 180.726 | 36.123 | 904.176 | | Tlangnuam (Aizawl) | 38 (14.4) | 39 (15.1) | 16.284 | .000 | 10.408 | 3.336 | 32.472 | | Thingsulthliah (Aizawl) | 30 (11.4) | 28 (10.8) | 14.071 | .000 | 11.094 | 3.155 | 39.009 | | W. Phaileng (Mamit) | 29 (11.0) | 31 (12.0) | 17.072 | .000 | 12.873 | 3.831 | 43.259 | | Zawlnuam (Mamit) | 46 (17.4) | 17 (6.6) | 3.944 | .047 | 3.589 | 1.017 | 12.669 | | Sangau (Lawngtlai) | 37 (14.0) | 49 (18.9) | 19.267 | .000 | 14.293 | 4.359 | 46.871 | | Chawngte (Lawngtlai) | 24 (9.1) | 33 (12.7) | 16.705 | .000 | 12.968 | 3.795 | 44.311 | | Subject studies (Others) | 63 (23.9) | 19 (7.3) | 4.303 | .231 | | | | | Arts | 132 (50.0) | 167(64.5) | .205 | .651 | 1.225 | .509 | 2.951 | | Commerce/Economics | 26 (9.8) | 23 (8.9) | .655 | .418 | .629 | .204 | 1.934 | | Science | 43 (16.3) | 50 (19.3) | .122 | .727 | .833 | .298 | 2.326 | | Up to 10th standard | 97 (36.7) | 50 (19.3) | 6.314 | .097 | | | | | 10+2/Diploma | 81 (30.7) | 70 (27.0) | 1.248 | .264 | .634 | .285 | 1.410 | | Bachelor’s degree | 46 (17.4) | 82 (31.7) | .938 | .333 | .733 | .391 | 1.374 | | Master’s Degree | 40 (15.2) | 57 (22.0) | 1.195 | .274 | 1.396 | .768 | 2.539 | | Do not have Vehicle | 139 (52.7) | 91 (35.1) | 3.690 | .158 | | | | | Personal Vehicle | 117(44.3) | 155 (59.8) | 2.813 | .093 | 1.439 | .941 | 2.200 | | Commercial Vehicle | 8 (3.0) | 13 (5.0) | 1.649 | .199 | 1.990 | .696 | 5.687 | | Formal Credit | 153 (58.0) | 158 (61.0) | .153 | .696 | .914 | .581 | 1.437 | | Constant | | | 12.786 | .000 | .087 | | | | Source: Calculations based on Field Survey. | Predicted Logit (Financial Inclusion) = [-2.447] + [5.197 * (Ngopa) + 2.343 * (Tlangnuam) + 2.406 * (Thingsulthliah) + 2.555 * (W. Phaileng) + 1.278 * (Zawlnuam) + 2.660 * (Sangau) + 2.562 * (Chawngte)] + [0.203 * (Arts) + (-0.464) * (Commerce/ Economics) + (-0.183) * (Science)] + [-0.455 * (10+2/Diploma) + (-0.310) * (Bachelor’s degree) + 0.334 * (Master’s Degree)] + [0.364 * (Personal Vehicle) + 0.688 * (Commercial Vehicle)] + [-0.090 * (Formal Credit)] Here: each of the variable in the equation assumes a value 01 (one) if found present or otherwise zero (00). | Table 6.22: Classification Table for the Basic Model (Constant in the model) | | Observed | Predicted* | | Financial Inclusion (Median 3.0) | Percentage | | Low | High | | | Financial Inclusion (Median 3.0) | Low | 264 | 0 | 100.0 | | High | 259 | 0 | .0 | | Overall Percentage | | | 50.5 | | * The cut value is .500 | The basic model, with only constant (Table 6.22) predicted 50.5 per cent cases correctly while, the estimated odds ratio favoured an increase of 21 per cent in Financial Inclusion (Table 6.23). | Table 6.23: Classification Table for the Model (with 05 variables in the Model) | | Observed | Predicted* | | Financial Inclusion (Median 3.0) | Percentage Correct | | Low | High | | Financial Inclusion (Median 3.0) | Low | 185 | 79 | 70.1 | | High | 70 | 189 | 73.0 | | Overall Percentage | | | 71.5 | | * The cut value is .500 | Table 6.23 compares the observed results (based on actual primary data) and the predicted results (estimated by using the model). 70.1 per cent cases were rightly classified as having ‘Low Financial Inclusion’, while 73 per cent cases were correctly classified as having ‘High Financial Inclusion’. Overall, 71.5 per cent cases were classified correctly by using the five (05) variables selected by the Model. 6.5 Status of Financial Literacy in Mizoram To study the status of Financial Literacy in the State, a total of 523 respondents were contacted for response. These respondents were selected from two blocks from each of the selected four districts of the State. In other words, the respondents are selected from eight blocks representing four districts. In order to estimate the level of financial literacy among the respondents, multiple questions were asked to identify: knowledge about principal, simple interest, compound interest, inflation, diversification, risk and return, time value of money, interest paid on loan, ability of division (numeracy), saving habit, long-term planning, making careful purchases, keeping track of cash flow and attitudes towards money and planning for the future. Based on the above questions, an index/ score for each of the respondents was created on a continuous scale of 0 to 21 points. This continuous scale was used to compare the differences on each of the selected variables. If there were only two groups in the variable (e.g., Male and Female under the variable Gender), Mann-Whitney U Test was applied. On the other hand, if there were more than two groups in the variable (e.g., Aizawl, Mamit, Champhai and Lawngtlai under the variable District), Kruskal-Wallis H Test is being applied. In case of Kruskal-Wallis H Test was used to compare more than two groups, and the test result came significant, a further step was taken to check which pair of two groups were significantly different by applying post-hoc Test pairwise comparisons using the Dunn-Bonferroni approach, and as a number of variables were used simultaneously, significance values were adjusted by the SPSS Bonferroni correction for multiple tests. On the other hand, if the Kruskal-Wallis H Test results were found insignificant, no further post-hoc tests were applied, as in this case all the individual pairs were found to be statistically not significant. While presenting the results, along with test statistic and the significance value, the effect size was also reported for each of the tests. | Table 6.24: Spread of Sample of Respondents on Financial Literacy Score | | Blocks and Districts (Residence) | Financial Literacy Score (on a scale on 0-21) | | Up to 9 | 9 to 13 | 13 to 17 | 17 to 21 | Total | | Tlangnuam (Aizawl) | Count | 02 | 11 | 51 | 13 | 77 | | % of Column | 5.56 | 6.88 | 18.89 | 22.81 | 14.72 | | % of Row | 2.60 | 14.29 | 66.23 | 16.88 | 100.00 | | Thingsulthliah (Aizawl) | Count | 03 | 14 | 36 | 05 | 58 | | % of Column | 8.33 | 8.75 | 13.33 | 8.77 | 11.09 | | % of Row | 5.17 | 24.14 | 62.07 | 8.62 | 100.00 | | Sub-Total Aizawl | Count | 05 | 25 | 87 | 18 | 135 | | % of Column | 13.89 | 15.63 | 54.38 | 31.58 | 25.81 | | % of Row | 3.70 | 18.52 | 64.44 | 13.33 | 100.00 | | W. Phaileng (Mamit) | Count | 08 | 26 | 23 | 03 | 60 | | % of Column | 22.22 | 16.25 | 8.52 | 5.26 | 11.47 | | % of Row | 13.33 | 43.33 | 38.33 | 5.00 | 100.00 | | Zawlnuam (Mamit) | Count | 09 | 36 | 17 | 01 | 63 | | % of Column | 25.00 | 22.50 | 6.30 | 1.75 | 12.05 | | % of Row | 14.29 | 57.14 | 26.98 | 1.59 | 100.00 | | Sub- Total Mamit | Count | 17 | 62 | 40 | 04 | 123 | | % of Column | 47.22 | 38.75 | 25.00 | 7.02 | 23.52 | | % of Row | 12.59 | 50.41 | 32.52 | 3.25 | 100.00 | | Champhai (Champhai) | Count | 00 | 12 | 39 | 10 | 61 | | % of Column | 0.00 | 7.50 | 14.44 | 17.54 | 11.66 | | % of Row | 0.00 | 19.67 | 63.93 | 16.39 | 100.00 | | Ngopa (Champhai) | Count | 01 | 15 | 42 | 03 | 61 | | % of Column | 2.78 | 9.38 | 15.56 | 5.26 | 11.66 | | % of Row | 1.64 | 24.59 | 68.85 | 4.92 | 100.00 | | Sub- Total Champhai | Count | 01 | 27 | 81 | 13 | 122 | | % of Column | 2.78 | 16.88 | 50.63 | 22.81 | 23.33 | | % of Row | 0.82 | 22.13 | 66.39 | 10.66 | 100.00 | | Chawngte (Lawngtlai) | Count | 06 | 22 | 27 | 02 | 57 | | % of Column | 16.67 | 13.75 | 10.00 | 3.51 | 10.90 | | % of Row | 10.53 | 38.60 | 47.37 | 3.51 | 100.00 | | Sangau (Lawngtlai) | Count | 07 | 24 | 35 | 20 | 86 | | % of Column | 19.44 | 15.00 | 12.96 | 35.09 | 16.44 | | % of Row | 8.14 | 27.91 | 40.70 | 23.26 | 100.00 | | Sub- Total Lawngtlai | Count | 13 | 46 | 62 | 22 | 143 | | % of Column | 36.11 | 28.75 | 38.75 | 38.60 | 27.34 | | % of Row | 9.09 | 32.17 | 43.36 | 15.38 | 100.00 | | Grand Total | Count | 36 | 160 | 270 | 57 | 523 | | % of Column | 100.00 | 100.00 | 100.00 | 100.00 | 100.00 | | % of Row | 6.88 | 30.59 | 51.63 | 10.90 | 100.00 | | Source: Field Survey. | Table 6.24 represents the spread of sample across each of the eight blocks. The table also presents the range of score of the respondents. 6.5.i Empirical Result: Financial Literacy16 District-wise Financial Literacy To evaluate if the distribution of Financial Literacy Score is the same across four districts selected for the study, Kruskal-Wallis H Test was applied. The test revealed significant differences in the level of financial literacy for four districts of Mizoram (Table 6.25). | Table 6.25: Kruskal-Wallis H Test | | H(3) | 64.726 | | Asymp. Sig. | .000 | | η2 | 0.119 (medium effect) | | Number of districts in Aizawl | 135 | | Number of districts in Mamit | 123 | | Number of districts in Champhai | 122 | | Number of districts in Lawngtalai | 143 | As the difference was found to be significant in the Financial Literacy Score across districts, Kruskal-Wallis post-hoc test pairwise comparisons using the Dunn-Bonferroni approach was applied with all six pairs, out of this only four pairs of districts were found having significant differences at 0.05 levels. As a number of variables were used simultaneously, significance values were adjusted by the SPSS Bonferroni correction* for multiple tests. The result of the test was as follows: 1. Mamit and Aizawl, Test Statistic = 126.405; SE = 18.824; Adj. Sig.* = 0.000. 2. Mamit and Lawngtlai, Test Statistic = -86.680; SE = 18.571; Adj. Sig.* = 0.000. 3. Mamit and Champhai, Test Statistic = -139.587; SE = 19.296; Adj. Sig.* = 0.000. 4. Lawngtlai and Champhai, Test Statistic = 52.907; SE = 18.612; Adj. Sig.*= 0.027 The above test highlights an urgent need to focus on the Mamit district, which is one of the aspirational districts as well. Different stakeholders should hold financial literacy workshops to check the low score of the district. Block-wise Financial Literacy Score To evaluate if the distribution of Financial Literacy Score is the same across all eight blocks spread over four districts, Kruskal-Wallis H Test was applied. The test revealed significant differences in the level of financial Literacy for eight blocks (Table 6.26). | Table 6.26: Kruskal-Wallis H Test | | H(7) | 86.331 | | Asymp. Sig. | .000 | | η2 | 0.154 (large effect) | | Tlangnuam | 77 | | Thingsulthliah | 58 | | W.Phaileng | 60 | | Zawlnuam | 63 | | Champhai | 61 | | Ngopa | 61 | | Chawngte | 57 | | Sangau | 86 | As the significant difference is found in the Financial Literacy Score across blocks, a further step in evaluating two blocks at a time was attempted to identify which two pair of blocks are showing significant difference. So, at next step, Kruskal-Wallis post-hoc Test pairwise comparisons using the Dunn-Bonferroni approach was applied with all 28 pairs, out of this only 11 pairs of blocks were found having significant differences at 0.05 level. Gender and Financial Literacy The difference between male and female financial literacy scores was evaluated using Mann-Whitney U Test. The test revealed insignificant difference in the scores of males (Table 6.27). Thus, the hypothesis that there is statistically significant difference between financial literacy level of males and females in Mizoram was rejected. The test of statistical significance of gender with respect to financial literacy concludes that difference was not significant, which was surprisingly contrary to various studies conducted the world over and found male as more financial literate as compared to their female counterparts. | Table 6.27: Mann-Whitney U Test | | Males | | Mean Rank | 275.03 | | Median | 14.0 | | n | 254 | | Females | | Mean Rank | 249.70 | | Median | 13.3 | | n | 269 | | U | 30854.0 | | z | -1.917 | | p | 0.055 | | r | 0.084 (negligible effect) | Age Group To evaluate if the distribution of Financial Literacy Score is the same across different age groups, Kruskal-Wallis Test was applied. The test revealed significant differences in the level of financial literacy across age groups (Table 6.28). Thus, the hypothesis that there is statistically significant difference in financial literacy level among young, middle aged and over 40 years people is accepted. Kruskal-Wallis test provided very strong evidence of a difference (p < 0.005) between the mean ranks of at least one pair of groups. Dunn’s pairwise tests were carried out for the three pairs of groups. There was very strong evidence (p = 0.011, adjusted using the Bonferroni correction) of a difference between the group ‘age up to 30 years’ and ‘age between 30 to 40 years. Similarly, there was very strong evidence (p = 0.008, adjusted using the Bonferroni correction) of a difference between the group ‘age up to 30 years’ and ‘age more than 40 years. There was no evidence of a difference between the third pair. | Table 6.28: Kruskal-Wallis Test | | H(2) | 12.338 | | Asymp. Sig. | .002 | | η2 | 0.02 (small effect) | | N up to 30 years | 213 | | N between 30 to 40 years | 158 | | N more than 40 years | 152 | A close observation on the above two outcomes of the post-hoc analyses, the age group of respondents up to the age of 30 years seems to be weak in financial literacy. This is the age when many have just completed their studies and joined a job or are searching for a job opportunity. The data gives evidence that financial literacy comes with experience in the State, especially after getting a job. In light of this, the stakeholders may think of implementing financial literacy related courses during the education at school and college levels. Nature of Family To evaluate the difference between nuclear family and joint family, the financial literacy score was tested using Mann-Whitney U Test. The test revealed significant difference in the scores of nuclear families and joint families. The respondents belonging to nuclear family scored higher on financial literacy as compared to respondents from joint family (Table 6.29). | Table 6.29: Mann-Whitney U Test | | Nuclear families | | Mean Rank | 292.02 | | Median | 14.3 | | N | 261 | | Joint families | | Mean Rank | 232.09 | | Median | 13.0 | | n | 262 | | U | 26355.0 | | Z | -4.538 | | p | .000 | | r | 0.20 (small effect) | Size of Family To evaluate if the distribution of Financial Literacy Score is the same across the size of the family, Kruskal-Wallis Test was applied. The test revealed insignificant differences in the level of financial literacy for size of the family (Table 6.30). Thus, the hypothesis that people with higher number of dependent family members were more financially literate was rejected. As no significant difference was found, post-hoc test for pair-wise comparison was not performed. | Table 6.30: Kruskal-Wallis Test | | H(2) | 5.115 | | Asymp. Sig. | .078 | | η2 | 0.006 (negligible effect) | Level of Income To evaluate if the distribution of Financial Literacy Score was the same across all- income levels, Kruskal-Wallis H Test was applied. The test revealed a significant difference in the level of financial Literacy for four income groups selected for the study (Table 6.31). Kruskal-Wallis test provided very strong evidence of a difference (p < 0.001) between the mean ranks of at least one pair of groups. Dunn’s pairwise tests were carried out for the six pairs of groups. There was very strong evidence (p = 0.001, adjusted using the Bonferroni correction) of a difference between the group ‘income up to Rs.60,000’ and ‘income more than Rs.4,80,000’. Similarly, there was very strong evidence (p = 0.004, adjusted using the Bonferroni correction) of a difference between the group ‘income between Rs.60,000 to Rs.2,40,000’ and ‘income more than Rs.4,80,000’. Further, there was another evidence (p = 0.012, adjusted using the Bonferroni correction) of a difference between the group ‘income between Rs.2,40,000 to Rs.4,80,000’ and ‘income more than Rs.4,80,000’. Thus, the hypothesis that people with comparatively higher annual income were more financially literate was accepted. There was no evidence of a difference between the remaining three pairs. | Table 6.31: Kruskal-Wallis H Test | | H(3) | 16.473 | | Asymp. Sig. | 0.001 | | η2 | 0.026 (small effect) | Marital Status To evaluate if the distribution of Financial Literacy Score is the same across marital status, Kruskal-Wallis Test was applied. The test revealed significant differences in the level of financial Literacy for Marital Status (Table 6.32). | Table 6.32: Kruskal-Wallis Test | | H(2) | 22.175 | | Asymp. Sig. | .000 | | η2 | 0.039 (small effect) | Kruskal-Wallis test provided very strong evidence of a difference (p < 0.004) between the mean ranks of at least one pair of groups. Dunn’s pairwise tests were carried out for all the three pairs of groups. There was very strong evidence (p < 0.000, adjusted using the Bonferroni correction) of a difference between the group ‘unmarried’ and the group ‘married’. Thus, the hypothesis that married people are significantly more financially literate is accepted. Further, there was very strong evidence (p = 0.006, adjusted using the Bonferroni correction) of a difference between the group ‘Widowed/Divorced’ and the group ‘married’. There was no evidence of a difference between the remaining five pairs. Educational Qualification To evaluate if the distribution of Financial Literacy Score was the same across the level of education, Kruskal-Wallis Test was applied. The test revealed significant differences in the level of financial Literacy for level of education among the respondents. Kruskal-Wallis test provided evidence of a difference (p < 0.05) between the mean ranks of at least one pair of groups (Table 6.33). Dunn’s pairwise tests were carried out for all the six pairs of groups. Out of six pairs, two were found significantly different. But after adjustments, results using the Bonferroni correction, it was found that there was no evidence of a difference between any of the pairs. The average scores of the groups gives an idea that higher the level of the education, higher the possibility of possessing better financial literacy, although the difference was statistically not significant. | Table 6.33: Kruskal-Wallis Test | | H(3) | 8.295 | | Asymp. Sig. | 0.040 | | η2 | 0.01 (small effect) | Subjects Studied To evaluate if the distribution of Financial Literacy Score was the same across the stream of education, Kruskal-Wallis Test was applied. The test revealed significant differences in the level of financial literacy for subject studied. Kruskal-Wallis test provided very strong evidence of a difference (p < 0.000) between the mean ranks of at least one pair of groups. Dunn’s pairwise tests were carried out for all the six pairs of groups (Table 6.34). There was a very strong evidence (p < 0.000, adjusted using the Bonferroni correction) of a difference between the group ‘Arts stream’ and the group ‘other stream’. Further, there was evidence (p = 0.022, adjusted using the Bonferroni correction) of a difference between the group ‘Arts stream’ and the group ‘Science stream’. There was no evidence of a difference between the remaining four pairs. | Table 6.34: Kruskal-Wallis Test | | H(3) | 33.974 | | Asymp. Sig. | .000 | | η2 | 0.06 (medium effect) | The group ‘others’ mainly includes those who studies upto class 10 or have not specified their specialisation. The low score of respondents from Arts stream suggested that special workshops on personal financial issues and numerical ability should be organised for students of arts and humanities background, as in many earlier studies it is found that numeric ability is an important determinant of financial literacy. Membership of Self-Help Groups Out of total 523 respondents of the study, only 88 reported to be a member of SHG; a further question was asked to such respondents that if their SHG is credit linked or not. 74 out of 88 reported that their SHG is credit-linked. Mann-Whitney U Test was applied to see if there was any difference in the level of financial literacy of these two groups, the test revealed that the difference was not statistically significant (Table 6.35). Thus, the hypothesis that respondents, who are members of SHG, are more financially literate was rejected. | Table 6.35: Mann-Whitney U Test | | U | 507.0 | | Z | -0.126 | | P | 0.900 | | r | 0.01 (negligible effect) | Out of 74 who reported to be a member of a credit-linked SHGs, a further question was asked that if they have availed credit from the SHG. In response to the query, 69 respondents reported that they had taken loan from the SHG. Mann-Whitney U Test was applied to see if there was any difference in the level of financial literacy of these two groups (members who availed credit from SHG and those who had not availed credit). The test result was not statistically significant. The sample at this stage became very small (only 08 out of 74 did not took loan) to give conclusive evidence of significance. A further investigation focusing on SHGs role in financial literacy may be conducted to explore the case. Employment Status To evaluate if the distribution of Financial Literacy Score was the same across all employment types, Kruskal-Wallis Test was applied. The test revealed insignificant differences in the level of financial Literacy based on employment types. Kruskal-Wallis test provided very strong evidence of a difference (p < 0.000) between the mean ranks of at least one pair of groups. Dunn’s pairwise tests were carried out for all the six pairs of groups (Table 6.36). There was very strong evidence (p < 0.000, adjusted using the Bonferroni correction) of a difference between the group ‘unemployed’ and the group ‘government employees’. Thus, the hypothesis that government servants were more financially literate was supported. Further, there was a very strong evidence (p < 0.000, adjusted using the Bonferroni correction) of a difference between the group ‘unemployed’ and the group ‘Self-employed’. | Table 6.36: Kruskal-Wallis Test | | H(3) | 40.758 | | Asymp. Sig. | .000 | | η2 | 0.073 (medium effect) | Furthermore, there was a very strong evidence (p < 0.000, adjusted using the Bonferroni correction) of a difference between the group ‘government employees’ and the ‘private sector employees’. There was no evidence of a difference between the remaining three pairs. Distance from Bank To evaluate the difference between respondents residing within one kilometre distance from the nearest bank branch and respondents residing more than one kilometre distance from the nearest bank branch for financial literacy score was tested using Mann-Whitney U Test. The test revealed significant difference in the scores of people residing within one kilometre and respondents residing more than one kilometre from branch (Table 6.37). The data surprisingly suggested that people residing far from a bank branch were financial literate. This needs further investigation as this finding is contrary to most of the studies conducted earlier. | Table 6.37: Mann-Whitney U Test | | Respondents residing within one (01) kilometre | | Mean Rank | 251.80 | | Median | 13.7 | | N | 362 | | Respondents residing more than one (01) kilometre | | Mean Rank | 284.94 | | Median | 14.0 | | N | 161 | | U | 25448 | | X | -2.317 | | P | .021 | | R | 0.10 (small effect) | Status of Migration Out of total 523 respondents, 68 respondents reported to be a migrant. They all migrated from different places within the State to their present place of livelihood. To identify difference, if any, between financial literacy scores of respondents who had migrated and the respondents who were not migrants, Mann-Whitney U Test was applied. The test found no significant difference between both the groups (Table 6.38). A further study may be conducted to compare the status of financial literacy between people migrated from other States to Mizoram and the native people of the place. | Table 6.38: Mann-Whitney U Test | | Respondents who have migrated | | Mean | 273.39 | | Median | 14.0 | | n | 68 | | Respondents who are not a migrant | | Mean Rank | 260.30 | | Median | 13.7 | | n | 455 | | U | 14695.50 | | z | -0.667 | | P | 0.505 | | R | 0.03 (negligible effect) | Ownership of Vehicles To evaluate if the distribution of Financial Literacy Score is the same across the group of people who have personal vehicle, commercial vehicle or do not have any vehicle, Kruskal-Wallis H Test was applied. The test revealed significant differences in the level of financial literacy for vehicle ownership. Kruskal-Wallis test provided very strong evidence of a difference (p = 0.002) between the mean ranks of at least one pair of groups (Table 6.39). Dunn’s pairwise tests were carried out for all the three pairs of groups. There was a very strong evidence (p = 0.004, adjusted using the Bonferroni correction) of a difference between the group ‘having no vehicle’ and the group ‘having personal vehicle’. There was no evidence of a difference between the remaining two pairs. | Table 6.39: Kruskal-Wallis H Test | | H(2) | 12.552 | | Asymp. Sig. | .002 | | η2 | 0.02 (small effect) | Ownership of Personal Computer To identify difference, if any, between financial literacy scores of respondents having personal computer and respondents not having personal computer, Mann-Whitney U Test was applied, the test found significant difference between both the groups. Ownership of a computer may not be possible for very poor people, thus having a computer overlaps the people with higher income (Table 6.40). | Table 6.40: Mann-Whitney U Test | | respondents having personal computer | | | Mean Rank | 288.31 | | Median | 14.0 | | N | 252 | | Respondents not having personal computer | | | Mean Rank | 237.54 | | Median | 13.3 | | N | 271 | | U | 27516.5 | | Z | -3.842 | | P | 0.000 | | R | 0.17(small effect) | Computer Skills To identify difference, if any, between financial literacy scores of respondents having skill to run a computer (Mean Rank = 277.81; Median = 14.0; n= 290) and respondents not having skill to run a computer (Mean Rank = 242.33; Median = 13.3; n= 233) Mann-Whitney U Test was applied. The test found a significant difference between both the groups (U = 29201.5, z = -2.670, p = 0.008, r = 0.12 (small effect). Computing skills provide an opportunity to access information about various products and services, thus the skill or ability of run a computer may be proved important in order to improve the level of financial literacy. Ownership of Mobiles To identify difference, if any, between financial literacy scores of respondents having mobile (Mean Rank = 261.93; Median = 13.7; n= 509) and respondents not having mobile (Mean Rank = 264.39; Median = 13.85; n= 14), Mann-Whitney U Test was applied. The test found no significant difference between both the groups (U = 3529.50, z = -0.060, p = 0.952, r = 0.003 (negligible effect). Certain studies, conducted by researchers in other places, found possession of mobile a significant factor in financial literacy, but the majority of the sample respondents (509 out of 523) in present study were found to have mobile. The present survey was conducted during the pandemic, and the survey was mainly done through online mode (Google form), which was being circulated over mobile. Thus, people not having mobile got a very small exposure in the survey. Access to Internet on Mobile To identify difference, if any, between financial literacy scores of respondents having internet/ GPRS facility on mobile (Mean Rank = 261.10; Median = 13.70; n= 494) and respondents not having internet/ GPRS facility on mobile or not having mobile (Mean Rank = 277.33; Median = 14.3; n= 29), Mann-Whitney U Test was applied. The test found no significant difference between both the groups (U = 6718.50, z = -0.562, p = 0.574, r = 0.03 (negligible effect). Mere possession of a mobile device may not help in improving financial literacy, unless the mobile has access to internet (3G/4G etc.), as it is difficult to get latest information about new financial products and services introduced in the market without internet. In the present survey, a very small sample of respondents did not have internet facility on their device (29 out of 523), thus conclusive evidence of difference is missing in the test. The effect size (r) also came negligible. Number of Mobile Connections in a Household To identify difference, if any, between financial literacy scores of respondents having up to three mobile connections in the household (Mean Rank = 258.11; Median = 13.7; n = 201) and others (Mean Rank = 264.43; Median = 13.7; n = 322), Mann-Whitney U Test was applied. The test found no significant difference between both the groups (U = 31580.0, z = -0.465, p = 0.642, r = 0.02 (negligible effect). Few studies conducted at different places found a difference based on number of mobiles in the family/ household. The present study also observed slightly higher financial literacy score among the respondents who were having more than three mobiles in their household, but the difference between the average score of both the groups were found to be statistically not significant. Ownership of Savings Account To identify difference, if any, between financial literacy scores of respondents having savings bank account in a Bank or Post Office (Mean Rank = 263.55; Median = 13.7; n= 510) and respondents not having savings bank account in a Bank or Post Office (Mean Rank = 201.31; Median = 13.0; n= 13), Mann-Whitney U Test was applied. The test found no significant difference between both the groups (U = 2526.00, z = -1.467, p = 0.142, r = 0.06 (negligible effect). A very small size of respondents (13 out of 523) were found having no savings account. The people having savings account possess higher financial literacy score as compared to people not having an account, but this difference was not statistically significant. Formal Credit To identify difference, if any, between financial literacy scores of respondents who have availed formal credit, e.g., Bank Loan (Mean Rank = 250.86; Median = 13.7; n = 311) and respondents who had never availed formal credit (Mean Rank = 278.34; Median = 14.0; n = 212), Mann-Whitney U Test was applied. The test found a significant difference between both the groups (U = 29501.0, z = -2.044, p = 0.041, r = 0.09 (negligible effect). It is surprising to see higher financial literacy score among the respondents who have never taken any formal credit (bank loan etc.), as compared to those who have taken formal credit. This requires a further dedicated investigation to trace if people with higher financial literacy tend to avoid taking any kind of loan, and they prefer to live with their own means. If it is so, it is worth focusing on financial literacy workshops. Informal Credit To identify difference, if any, between financial literacy scores of respondents who have availed informal credit (Mean Rank = 256.59; Median = 13.3; n = 65) and respondents who had not availed informal credit (Mean Rank = 262.77; Median = 13.7; n = 458), Mann-Whitney U Test was applied. The test found no significant difference between both the groups (U = 14533.0, z = -0.309, p = 0.758, r = 0.01 (negligible effect). Majority of the respondents (458 out of 523) had never taken any loan from informal sources (e.g., moneylender, etc.), and their financial literacy score was found higher than those who had taken loan from informal sources. This is a good sign, but the difference was not significant, and the effect size was also negligible in this case. Further study may be conducted to trace the facts behind this finding. Ongoing Loan To identify difference, if any, between financial literacy scores of respondents who were having a loan at the time of survey (Mean Rank = 266.27; Median = 13.7; n = 252) and the respondents who were not having any loan at the time of survey (Mean Rank = 258.03; Median = 13.7; n = 271), Mann-Whitney U Test was applied. The test found a significant difference between both the groups (U = 33070.5, z = -0.623, p = 0.533, r = 0.03 (negligible effect). The respondents having a loan at the time of survey are found having better financial literacy score, but the difference was not significantly significant. Financial Literacy Programme To identify difference, if any, between financial literacy scores of respondents who attended financial literacy programmes earlier (Mean Rank = 279.24; Median = 14.0; n= 181) and respondents who had never attended financial literacy programmes earlier (Mean Rank = 252.88; Median = 13.7; n= 342), Mann-Whitney U Test was applied. The test found no significant difference between both the groups (U = 27830.5, z = -1.899, p = 0.058, r = 0.08 (negligible effect). The respondents who had earlier attended workshops on financial literacy were found possessing better financial literacy score, but surprisingly, this difference was not statistically significant, and the effect size was also found negligible. There is a need to conduct a series of financial literacy workshops and ascertain their effectiveness. The effectiveness of workshops is more important than conducting the workshops. Further, how much information people are able to retain over the period should also be evaluated by conducting longitudinal study on financial literacy of same group of respondents over the period. A further deeper evaluation should be done to identify which kind of information people are able to retain and which kind of information they fail to retain. This may help shape future workshops in a better way. Awareness of Consumer Rights Chart 53 from Annexure 2 presents the financial literacy score of the respondents with normal and low awareness of consumer rights. To identify difference, if any, between financial literacy scores of respondents who were found aware about consumer rights (Mean Rank = 294.76; Median = 14.7; n = 249) and respondents who were found not well aware about consumer rights (Mean Rank = 232.23; Median = 13.0; n = 274), Mann-Whitney U Test was applied. The test found a significant difference between both the groups (U = 25956.5, z = -4.729, p = 0.000, r = 0.21 (small effect). The respondents were asked eight simple questions and were considered with normal awareness if they could answer any five questions correctly, but still more than half of the respondents could not give five correct answers. Out of 523 respondents, only 249 respondents could give five right answers and remaining 274 failed to correctly attempt the questions. It is not surprising to see higher financial literacy score among those who are having at least normal awareness, as compared to respondents with low awareness level. This advocates to conduct as many workshops as possible and as frequent as possible to improve both status of financial literacy and consumer awareness. Financial Inclusion Score To identify difference, if any, between financial literacy scores of respondents who are found having high financial inclusion (Mean Rank = 269.19; Median = 14.0; n = 259) and respondents who are found having low financial inclusion (Mean Rank = 254.95; Median = 13.7; n = 264), Mann-Whitney U Test was applied. The test found a significant difference between both the groups (U = 32325.5, z = -1.079, p = 0.281, r = 0.05 (negligible effect)). Thus, the hypothesis that financial literacy is higher among those who are better financially included is rejected. 6.5.ii Logistic Model for Financial Literacy To investigate if there is a relationship between selected variables and the Financial Literacy, a logistic regression analysis was conducted. For the purpose of the Binary Logistic Regression Analysis, all the scores of Financial Literacy of the respondents were divided into two groups, viz., High and Low. In order to decide the cut-off level for the same, median point (i.e., 13.67) has been used, i.e., everyone who scored above the median score were placed in High group and all respondents who scored up to the median score were considered in the Low group. Out of all the variables considered and discussed above, only five predictor variables, viz., Block of residence, Subjects studied, Employment type, Possession of vehicle and Nature of family, in the logistic regression analysis was found to be contributing to the model. District of residence has shown a medium effect in the discussion above, but as Block has already been considered in the model, district has not been considered, as otherwise, it could have caused duplication of data and Logistic Model may not fit. The variable ‘Block of residence’ was represented by eight dummy variables, viz., Tlangnuam (Aizawl), Thingsulthliah (Aizawl), W. Phaileng (Mamit), Zawlnuam (Mamit), Chawngte (Lawngtlai), Sangau (Lawngtlai), Ngopa (Champhai) and Champhai (Champhai), with the last category (Champhai (Champhai)) designated as the reference group. The variable Employment level was represented by four dummy variables, viz. government job, non-government, self-employed and unemployed with the last category (viz., unemployed) designated as the reference group. The variable ‘Subjects studied’ was represented by four dummy variables, viz., Arts, Commerce/Economics, Science and Others, with the last category (Others) designated as the reference group. The variable ‘Possession of vehicle’ was represented by three dummy variables, viz., Commercial Vehicle, Personal Vehicle and Do not have any vehicle with the last category (viz., Do not have any vehicle) designated as the reference group. The fifth variable ‘Nature of family’ was a dichotomous variable ‘Nuclear family’, and ‘Joint family’. The Logistic Regression Model was run multiple times with different combinations of more than 25 factors identified for the study, starting with those variables that gave large or moderate effect size and then going through each of the factors. After the multiple testing five variables, viz., Block of residence, Subjects studied, Employment type, Possession of vehicle and Nature of family, were selected as these variables gave the best fit of the model. The unstandardised Beta weight for Constant; β = -2.292, SE = 0.388, Wald = 34.980, p < 0.000. The unstandardised Beta weight for various predictor variables used in the Binary Logistic Model are as given in Table 6.41. | Table 6.41: Variables in the Logistic Model for Financial Literacy | | Variables | Financial Literacy
(figures within parentheses are percentages) | Wald | Sig. | Exp (β) Odds Ratio | 95% C.I. for EXP (β) | | Low | High | Lower | Upper | | Zawlnuam (Mamit) | 50 (18.4) | 13 (5.2) | 24.224 | .001 | | | | | W. Phaileng (Mamit) | 43 (15.8) | 17 (6.8) | .029 | .865 | .922 | .363 | 2.346 | | Ngopa (Champhai) | 27 (9.9) | 34 (13.5) | 1.132 | .287 | 1.666 | .650 | 4.268 | | Champhai(Champhai) | 21 (7.7) | 40 (15.9) | 8.710 | .003 | 4.349 | 1.638 | 11.544 | | Sangau (Lawngtlai) | 36 (13.2) | 50 (19.9) | 5.654 | .017 | 2.824 | 1.200 | 6.646 | | Chawngte (Lawngtlai) | 35 (12.9) | 22 (8.8) | .223 | .637 | 1.248 | .497 | 3.132 | | Tlangnuam (Aizawl) | 28 (10.3) | 49 (19.5) | 7.647 | .006 | 3.414 | 1.430 | 8.150 | | Thingsulthliah (Aizawl) | 32 (11.8) | 26 (10.4) | .677 | .411 | 1.472 | .586 | 3.695 | | Unemployed | 98 (36.0) | 48 (19.1) | 18.593 | .000 | | | | | Government Job | 39 (14.3) | 76 (30.3) | 18.499 | .000 | 4.196 | 2.183 | 8.066 | | Non-Government Job | 43 (15.8) | 34 (13.5) | 3.148 | .076 | 1.784 | .941 | 3.380 | | Self Employed | 92 (33.8) | 93 (37.1) | 6.780 | .009 | 2.081 | 1.199 | 3.612 | | Arts | 181 (66.5) | 118 (47.0) | 10.053 | .018 | | | | | Commerce/ Economics | 24 (8.8) | 25 (10.0) | .329 | .567 | 1.224 | .613 | 2.446 | | Science | 38 (14.0) | 55 (21.9) | 6.732 | .009 | 2.128 | 1.203 | 3.764 | | Other | 29 (10.7) | 53 (21.1) | 5.091 | .024 | 2.167 | 1.107 | 4.244 | | Do not have Vehicle | 140 (51.5) | 90 (35.9) | 9.304 | .010 | | | | | Personal Vehicle | 123 (45.2) | 149 (59.4) | 8.627 | .003 | 1.920 | 1.242 | 2.968 | | Commercial Vehicle | 9 (3.3) | 12 (4.8) | 2.476 | .116 | 2.210 | .823 | 5.933 | | Nuclear Family | 111 (40.8) | 150 (59.8) | 4.954 | .026 | 1.590 | 1.057 | 2.393 | | Constant | | | 34.980 | .000 | .101 | | | | Source: Calculations based on field Survey data. | Predicted Logit (Financial Literacy) = [-2.292] + [- 0.081 * (W. Phaileng) + 0.511 * (Ngopa) + 1.470 * (Champhai) + 1.038 * (Sangau) + 0.222 * (Chawngte)] + 1.228 * (Tlangnuam) + 0.386 * (Thingsulthliah)] + [1.434 * (Govt Job) + 0.579 * (Non-Govt Job) + 0.733 * (Self Employed)] + [0.202 * (Commerce/ Economics) + 0.755 * (Science) 0.773 * (Other)] + [0.652 * (Personal Vehicle) + 0.793 * (Commercial Vehicle)] + [0.464 * (Nuclear family)] Each of the variable in the equation assumes a value one (01) if found present or otherwise zero (0). The basic model with only constant (Table 6.42) predicted 52 per cent of the cases correctly, while the estimated odds ratio favoured an increase of 17.6 per cent in financial literacy. | Table 6.42: Classification Table Basic Model (Constant included in the model) | | Observed | Predicted* | | Financial Literacy (Median 13.67) | Percentage Correct | | Low | High | | Financial Literacy (Median 13.67) | Low | 272 | 0 | 100.0 | | High | 251 | 0 | .0 | | Overall Percentage | | | 52.0 | | * The cut-off value is .500 |
| Table 6.43: Classification Table for the Model (with 05 variables in the Model) | | Observed | Predicted* | | Financial Literacy (Median 13.67) | Percentage Correct | | Low | High | | Financial Literacy (Median 13.67) | Low | 188 | 84 | 69.1 | | High | 75 | 176 | 70.1 | | Overall Percentage | | | 69.6 | | * The cut-off value is .500 | Table 6.43 compares the observed results (based on actual primary data) and the predicted results (estimated by using the model). 69.1 per cent cases were rightly classified as having ‘Low Financial Inclusion’, while 70.1 per cent cases were correctly classified as having ‘High Financial Inclusion’. Overall, 69.6 per cent cases were classified correctly by using the five (05) variables selected by the Model. 7. Concluding Observations The present study analyses various factors that affect financial literacy and financial inclusion in Mizoram (southern-most State in the North-Eastern Region of India). After an intensive review of literature, about 30 factors were identified which might be having direct or indirect impact on the level of financial literacy and financial inclusion in the State. Banking business in Mizoram remains comparatively low amongst the NER States. Also, public sector banks dominate the banking business in the State. But Mizoram Rural Bank (MRB), unlike in other NER States, plays a lead role. Bank group-wise branch presence and banking activities also remains lop-sided. The dispersed nature of villages with relatively small number of households in hilly terrains makes traditional branch banking unviable in many areas. Due to the lesser number of branches of commercial banks, the solution to the problem of ensuring access to banking facilities will have to come from other modes. In view of poor banking outreach of banks in rural areas, there is a need to revisit the existing branch authorisation policy, which sets banking outlet opening quotas for individual banks at national level but not at the State level. There is also a need to expand the role of Mizoram Rural Bank in promoting financial inclusion in the State. The SHG-bank linkage programme also needs to be fostered as it can achieve desired outcome, especially in rural areas. While the limited banking outreach may not have been able to fully meet the credit demand of the State from the formal banking channel, poor industrial base and traditional farm practices and inadequate infrastructure facilities may be keeping the credit absorption tepid in the State. This also gets reflected in lower C-D ratio and credit-GSDP ratio. Against this backdrop, there is a greater need for strengthening the infrastructure in the State, promote industrialisation, foster commercial cropping and food-processing industry and also develop forward and backward sectoral inter-linkages to allow the financial sector to play its due role in fostering growth. It was observed during the study that general awareness about different savings/ investment schemes was low (except a savings bank account). The actual users of the select schemes were even lower, which was found to be as low as 15 per cent (except savings bank account). Less than 25 per cent respondents were aware of all 11 products selected for the study, while about 32 per cent respondents were aware of either none or only one scheme (i.e., savings account). There were another 16 per cent of respondents who were aware about only two schemes (out of these two, one is savings bank account). This indicated a very low level of awareness towards the available opportunities of investment. In fact, it points towards a lack of interest in long-term investments. Out of 523 respondents, only 181 (i.e., 34.6 per cent) were found to be aware about all four payment options considered for the study, viz., debit cards, credit cards, prepaid cards and mobile payments. On the other hand, about 20 per cent (i.e., 101 out of 523) of the respondents reported that they did not know any of the four payment options. In the light of these findings, stakeholders need to take remedial action to make people aware about these options. An attempt was made to enquire about how many respondents were actually using payment options. It was found that 299 respondents (i.e., 57.2 per cent) were using at least one option, and remaining about 43 per cent respondents were not using any of these options. It was found that use of life insurance is quite low. In light of this, it is advisable to run extensive awareness campaign to popularise insurance, both life and general, among the common people. The Credit Deposit (C-D) ratio in Mizoram is quite low as compared to national average. There is a need to create awareness about availability of credit-related products in the State and to make them more accessible and affordable so that common people may avail the same. An attempt was made to assess the level of awareness and use of select popular government schemes to address the problem of financial inclusion. It was found that general awareness was low among the respondents about the schemes. Responses were collected for seven such schemes and it was found that for most of the schemes, awareness was less than 50 per cent. On the other hand, among those who were aware, majority did not avail the schemes. The actual number of respondents who were availing the schemes was less than 20 per cent in each of the cases. In the light of this, remedial steps need to be taken to make such schemes known to the people. With the passage of time and advancement in technology, the mode of delivery of financial services has also evolved. Financial services are no more an exclusive domain of banks. A good number of alternative financial institutions have come forward to make available select financial services to the common people. An attempt was made to investigate the level of awareness of select financial institutions, viz., NBFCs, MFIs, SHG, SFBs and payment banks among the respondents in the eight blocks of the State. More than half of the respondents did not know about NBFCs, MFIs and SFBs. Around 80 per cent of respondents were found having basic awareness about SHGs and payment banks and a very small number of them availed services of these financial institutions. Measures are required to make these financial institutions known to the people. The present study is based on a sample survey. Only four districts of the State and only two blocks each from each of the selected four blocks have been sampled. Due to outbreak of pandemic, it was not possible to move within the State. Considering this, purposive sampling method has been used for the study, thus the data may not be representative of the State population. A similar study may be conducted selecting two blocks from each of the eleven districts of the State, to identify the impact of various factors on level of financial inclusion and financial literacy. Due to pandemic, the present study adopted online data collection technique to get responses mostly from the respondents having access to mobiles and Internet facility. Similar survey may be conducted in off-line mode (pen and paper mode) to tap responses from those who do not have mobile or Internet facilities. Many respondents were found having awareness about financial products and financial institutions but were still not using the same. A study may be conducted focusing on the reasons that deter them from using the same. Many respondents reported that they have attended financial literacy workshops earlier, but their financial literacy was not found to be higher than those who have never attended such workshops. A longitudinal study should be conducted to evaluate the effectiveness of the financial literacy workshops. During the period of data collection, it was identified that the awareness about various schemes for financial inclusion was, in general, very low. Thus, a series of awareness programmes needs to be organised to spread awareness about such schemes. Further, it was also identified during the course of the study that people who attended financial literacy workshops still had poor/ low financial literacy score. Thus, the outcome of every such workshop needs to be assessed and a follow-up workshop may be organised to refresh the newly created knowledge. Mizoram is one of the most literate States. Still, the level of financial literacy is low because there is no content about personal finance in school curriculum. It is necessary to incorporate practical aspects of personal finance (e.g., budgeting, savings, investment products, payments services, formal credit, goal planning, need and importance of insurance, retirement planning, etc.) in the school curriculum.
References Abel, S., Mutandwa, L., & Roux, P.L. (2018). ‘A Review of Determinants of Financial Inclusion’. International Journal of Economics and Financial Issues, 8(3), pp. 1-8 (ISSN: 2146-4138). About Mizoram (2020). Retrieved from http://mizoram.nic.in/about/people.htm, accessed on June 25, 2020. Agarwalla, S.K., Barua, S.K., Jacob, J., & Varma, J.R. (2012). A Survey of Financial Literacy among Students’, Young Employees and the Retied in India. Indian Institute of Management, Ahmedabad, India and Citi Foundation. Agarwalla, S.K., Barua, S.K., Jacob, J., & Varma, J.R. (2013). Financial Literacy among Working Young in Urban India, W.P. No. 2013-10-02, Indian Institute of Management, Ahmedabad, India Aggarwal, N., Gupta, M., & Singh, S. (2014). Financial Literacy among farmers: Empirical evidence from Punjab. Pacific Business Review International, 6(7), pp. 36-42. Almenberg, J., & Söderberg, J.S. (2011). Financial Literacy and Retirement Planning in Sweden. CeRP Working Paper, No.112, Turin (Italy). Al-Tamimi, H.A.H., & Kalli, A.A.B. (2009). Financial literacy and investment decisions of UAE investors. Journal of Risk Finance, 10(5), pp.500 – 516 Atkinson, A., & Messy, F.A. (2012). Measuring Financial Literacy: Results of the OECD / International Network on Financial Education (INFE) Pilot Study. OECD Working Papers on Finance, Insurance and Private Pensions, No. 15, OECD Publishing. Atkinson, A., & Messy, F. (2013). Promoting Financial Inclusion through Financial Education: OECD/INFE Evidence, Policies and Practice. OECD Working Papers on Finance, Insurance and Private Pensions, No. 34, OECD Publishing. Bashir, T., Arshad, A., Nazir, A., & Afzal, N. (2013). Financial Literacy and Influence of Psychosocial Factors. European Scientific Journal, 9(28) pp. 384-404 (ISSN: 1857 – 7881). Beal, D., & Sarath, D. (2003). Financial Literacy among Australian University Students. Economic Papers, 22(January), pp. 65-78. Bernheim, B.D., Garrett D.M., & Maki D.M. (1997). Education and Saving: The long-term effects of High School financial curriculum mandates. National Bureau of Economic Research (NBER) Working Paper 6085, July. Available at www.nber.org. Bhanot, D, Bapat, V., & Bera, S. (2012). Studying financial inclusion in north-east India. The International Journal of Bank Marketing, Emerald, 30(6), pp. 465-84. Bhushan, P. (2014). An Empirical Study of Financial and Tax Literacy of Salaried Individuals (Unpublished doctoral dissertation). Jaypee University of Information Waknaghat, Solan (H.P), India Bhushan, P., & Medury, Y. (2013). Financial Literacy and its Determinants. International Journal of Engineering, Business and Enterprise Applications, 4(2), pp. 155-160. Bhuvana, M., & Vasantha, S. (2016). Drivers of Financial Inclusion to Reach Out Poor. Arabian Journal of Business and Management Review, 6(4), pp. 1-6 (ISSN: 2223-5833) Boon, T.H., Yee, H.S., & Ting, H.W. (2011). Financial literacy and personal financial planning in Klang Valley, Malaysia. International Journal of Economics and Management, 5(1), pp. 149-68 (ISSN 1823 - 836X). Bora, N.M. (2020). Financial Inclusion in India: A Case Study of the North-Eastern States. International Journal of Scientific and Technology Research, 9(2), pp.1319-23 (ISSN 2277-8616). Boro, K. (2015). Prospects and Challenges of Technological Innovation in Banking Industry of North East India. Journal of Internet Banking & Commerce, 20(3), 1-18 Bose, P.R. (2015). The reality behind Mizoram's trade hotspot, The Hindu Business Line, available at https://www.thehindubusinessline.com/economy/the-reality-behind-mizorams-trade-hotspot/article7375439.ece, accessed on August 03, 2020. Bruhn, M., de Souza Leão, L., Legovini, A., Marchetti, R., & Zia, B. (2016). The impact of high school financial education: Evidence from a large-scale evaluation in Brazil. American Economic Journal: Applied Economics, 8(4), 256-295. Central Electricity Authority, Government of India. Chakraborty, A., & Barman, S.R. (2013). Financial Inclusion in Tripura: Challenges and Opportunities. Journal of Commerce & Management Thought, 4(4), 870-879. Cohen, M., & Nelson, C. (2011). Financial Literacy: A Step for Clients towards Financial Inclusion, Global Microcredit Summit Commissioned Workshop Paper, Nov. 14-17, Valladolid, Spain, available at http://citeseerx.ist.psu.edu/viewdoc/download?doi=10.1.1.466.2029andrep=rep1andtype=pdf, accessed on June 01, 2020. Cole, S., Thomas, S., & Bilal, Z. (2008). Money or knowledge? What drives the demand for financial services in developing countries?, Harvard Business School Working Paper, No. 09-117. Coolican, H. (2009). Research methods and statistics in psychology. USA: Hodder Arnold Publishers. CRISIL. (2018). CRISIL Inclusix: Financial inclusion surges, driven by Jan-Dhan Yojana (Vol.4). https://www.crisil.com/content/dam/crisil/our-analysis/reports/Research/documents/2018/march/crisil-inclusix-financial-inclusion-surges-driven-by-Jan-Dhan-yojana.pdf Danes, S.M., & Hira, T.K. (1987). Money management knowledge of college students, The Journal of Student Financial Aid, 17(1), pp. 4–16. Das, S., & Mahapatra, S.K. (2019). Financial Literacy and Its Dimensions: An Empirical Study in Assam, Orissa Journal of Commerce, 40(3), pp 51-60. Das, S.K. (2011). An empirical analysis on preferred investment avenues among rural and semi-urban households. Journal of Frontline Research in Arts and Science, 1(2), pp. 26-36. Deccan Chronicle, (2019). Loin loom is the main source of income for the native of Mizoram. available at https://www.deccanchronicle.com, March 21. Demirgiiÿ-Kunt, A., Klapper, L., Singer, D., & Oudheusden, P.V. (2015). The Global Findex Database 2014, Measuring Financial Inclusion around the World (Policy Research Working Paper No. 7255), The World Bank, Washington, DC. Evans, O., & Alenoghena, R.O. (2017). Financial Inclusion and GDP Per Capita in Africa: A Bayesian VAR Model. Journal of Economics and Sustainable Development, 8(18). Fanai, L., & Singh, B. (2015). Inclusive Banking Initiatives of Mizoram Rural Bank. International Journal of Advanced Research in Management and Social Sciences, 4(8), pp. 105-127. Firli, A. (2017). Factors that Influence Financial Literacy: A Conceptual Framework. IOP Conference Series: Materials Science and Engineering, 180. 012254.10.1088/1757-899X/180/1/012254. Food and Agriculture Organization, UN. Frisancho, V. (2020). Is school based financial education effective? Short- and long-term impacts on students, parents, and teachers, Mimeo, Inter-American Development Bank. Garg, N., & Singh, S. (2018). Financial literacy among youth. International Journal of Social Economics, 45(1), pp. 173-186. https://doi.org/10.1108/IJSE-11-2016-0303. Ghosh, S. (2019). Financial Literacy and Financial Inclusion: Unbundling the Nexus. Economic and Political Weekly, 54(13), pp. 75-82. Government of India, 6th Economic Census. Government of India, Ministry of Statistics and Programme Implementation. Government of India, NSSO 70th Round Report, January-December 2013. Government of Mizoram, Economic Survey, 2019-20. Goyal, C. (2008). Financial Inclusion in the Northeastern Region of India with Special Reference to Assam. The Icfai Journal of Applied Finance, 14(12), 54-64. Grohmann, A., & Menkhoff, L. (2020). The Relationship between Financial Literacy and Financial Inclusion, DIW Berlin Discussion Paper No. 1914, Available at SSRN: https://ssrn.com/abstract=3735809 or http://dx.doi.org/10.2139/ssrn.3735809 Grohmann, A., Klühs, T., & Menkhoff, L. (2018). Does financial literacy improve financial inclusion? Cross country evidence. World Development, 111, pp. 84-96 Gupta, K., & Kaur, J. (2014). A study of Financial Literacy among micro entrepreneurs in Kangra district. International Journal of Research in Business Management, 2(2) pp. 63-70. Gupte, R., Venkataramani, B., & Gupta, D. (2012). Computation of Financial Inclusion Index for India. Procedia - Social and Behavioural Sciences, 37 pp 133–149. Hogarth, J.M. (2002). Financial literacy and family and consumer sciences. Journal of Family and Consumer Sciences, 94, pp. 15-28. Horn, S., Jamison, J., Karlan, D., & Zinman, J. (2020). Does lasting behavior change require knowledge change? Evidence from savings interventions for young adults. NBER Working Paper 28011. https://www.datanovia.com/en/lessons/kruskal-wallis-test-in-r/ Jamieson, J.C., Karlan, D., & Zinman, J. (2014). Financial education and savings accounts: Complements or substitutes: Evidence from Ugandan youth clubs. NBER Working Paper 20135. Kamboj, S. (2017). A study of Financial Literacy and its Impact of Investment Behaviour (Unpublished doctoral dissertation). Chaudhary Devi Lal University, Sirsa (Haryana), India. Klapper, L., & Panos, G.A. (2011). Financial Literacy and Retirement Planning in View of a Growing Youth Demographic: The Russian Case, CeRP Working Paper, No. 114/11. Kodan, A.S., Garg, N.K., & Kaidan, S. (2011). Financial Inclusion: Status, Issues, Challenges and Policy in Northeastern Region. The IUP Journal of Financial Economics, 9(2), 27-40. Lalhmingsangi, K.A. (2019). ‘A study on Financial Literacy among self-employed individuals in Aizawl, Mizoram’. IOSR Journal of Humanities and Social Science, 24(2), pp. 01-04. Lalremruati, P., & Fanai, L. (2018). Financial inclusion with reference to food and grocery shop owner in Aizawl. International Journal of Management Studies, 5(4), 37-44. Lalrinmawii, C. (2019). Financial Inclusion: A Case Study of Aizawl District, International Journal of Humanities and Social Science Invention. 08(11), pp. 11-21. Laskar, B.I. 2009, Small Scale and Cottage Industries in Mizoram- Problems and Employment Prospects. unpublished PhD thesis submitted to Mizoram University. Lenhard, W., & Lenhard, A. (2016). Calculation of Effect Sizes. Retrieved from: https://www.psychometrica.de/effect_size.html. Dettelbach (Germany): Psychometrica. DOI: 10.13140/RG.2.2.17823.92329 Lusardi A. (2003). Saving and the Effectiveness of Financial Education, Wharton Pension Research Council Working Papers, 430 https://repository.upenn.edu/prc_papers/430/?utm_source=repository.upenn.edu%2Fprc_papers%2F430&utm_medium=PDF&utm_campaign=PDFCoverPages Lusardi, A. (2006). Financial literacy and financial education: Review and policy implications. NFI Policy Brief, (2006-PB), pp. 11. Lusardi, A., & Mitchell, O.S. (2006). Financial Literacy and Planning: Implications for Retirement Wellbeing, Working Paper n. 1, Pension Research Council, Wharton School, University of Pennsylvania. Lusardi, A., & Mitchell, O.S. (2008). Planning and financial literacy: How do women fare? American Economic Review, 98(2), pp. 413-17. Maity, S., & Sahu, T.N. (2022). Financial inclusion in north-eastern region: an investigation in the State of Assam. Vilakshan - XIMB Journal of Management, 19(2), pp. 206-221. https://doi.org/10.1108/XJM-09-2020-0118. Mandel, L. (2006). Financial Literacy: If it’s so important, why isn’t it improving? Policy Brief 2006-PB-08 published by Networks Financial Institute at Indiana State University, April 2006, Available at www.networksfinancialinstitute.org. Markovich, C.A., & DeVaney, S.A. (1997). College seniors’ personal finance knowledge and practices. Journal of Family and Consumer Sciences, 89, pp. 61–65. Mbarire, T.T., & Ali, A.I. (2014). Determinants of financial literacy levels among employees of Kenya Ports Authority in Kenya. Research Journal of Finance and Accounting, 5(16), pp. 44-52. Mohapatra, N.P. (2014). Financial Inclusion. Economic and Political Weekly, 49(33), p. 4. Nandru, P., Byram, A., & Rentala, A. (2016). Determinants of Financial Inclusion: Evidence from Account Ownership and Use of Banking Services. International Journal of Entrepreneurship and Development Studies, 4(2), pp 141-155 Nath, V., Pal R.S., & Banerjee, S.K. (2008). Bamboo: Its distribution, production, habitat and agroforestry potential. Indian Forester, 134(3), pp. 387-396 National Bank for Agricultural and Rural Development Website. Nayak, U. (2012). Financial inclusion can make little headway without efforts to further financial literacy. Business Line, 19(229):8. NCFE (2019). Final Report: Financial Literacy and Inclusion in India, National Centre for Financial Education, available at https://www.ncfe.org.in/survey, accessed on July 24, 2021. Northeast Window (2017). Mizoram: Bamboo Represents a Vast Untapped Major Resource, accessed on October 7, available at http://www.thenortheastwindow.com, accessed on August 01, 2020. O’connell, A. (2008). Evaluating the Effectiveness of Financial Education Programmes, OECD Journal: General Papers, Volume 2008/3 available at https://read.oecdilibrary.org/economics/evaluating-the-effectiveness-of-financial-educationprogrammes_gen_papers-v2008-art17-en#page11). OECD (2013). Financial literacy and inclusion: Results of OECD/INFE survey across countries and by gender, available at https://www.oecd.org/daf/fin/financial-education/TrustFund2013_OECD_INFE_Fin_Lit_and_Incl_SurveyResults_by_Country_and_Gender.pdf, accessed on June 05, 2020. OECD (2018). OECD/INFE Toolkit for Measuring Financial Literacy and Financial Inclusion OECD (2020). OECD/INFE 2020 International Survey of Adult Financial Literacy. Oyelami, L.O., & Ogundipe, A.A. (2020). An empirical investigation of remittances and financial inclusion nexus in Sub-Saharan Africa, Cogent Business and Management 7(1), 1712126. https://doi.org/10.1080/23311975.2020.1712126. Reserve Bank of India Website (www.rbi.org.in). Sailo, L., & Singh, B. (2019). Financial Literacy among College Teachers in Aizawl: A Case Study of Pachhunga University College. Management Convergence, 10(2), pp. 1-10. Sarma, M. (2008). Index of Financial Inclusion, Indian Council for Research on International Economic Relations working paper no. 215, pp. 1-26. Available at https://www.icrier.org/pdf/Working_Paper_215.pdf, accessed on April 25, 2020. Savant, P.V., & Patnaik, S.S. (1998). Forests and Forestry in Mizoram – A Profile. Indian Forster, 124(6), pp 433-439. Sekar, M., & Gowri, M, (2015). A study of Financial Literacy and its Determinants among Gen Y Employees in Coimbatore City. Great Lakes Herald, 9(1), pp. 35-45. Singh, B. (2011). Financial Inclusion of North East India: A Study of Banking Network, Proceedings of National Seminar on Financial Inclusion: Issues and Challenges, organized by Department of Economics, Mizoram University, Aizawl on Nov. 22-23, pp. 42-52 Singh, B. (2011). Inclusive Growth vs. Regional Disparity: A Case Study of Banking Services in NE India, in AK Agarwal and B Singh (eds.) Understanding India’s North East, DVS Publishers, Guwahati, pp. 128-143 (ISBN 978-81-86307-42-7) Singh, J.B. (2019). From Mobile Access to Use: Evidence of Feature-level Digital Divides in India. Economic and Political Weekly, 52 (32) pp. 60-67. Songate, P.S. (2010). Indo-Myanmar border trade the study of socio-cultural and political dynamics in Mizoram, unpublished Ph.D. thesis submitted to Mizoram University. State Level Bankers’ Committee, Mizoram Website. Subbarao, D. (2009). Financial Inclusion: Challenges and Opportunities, Remarks by Governor, Reserve Bank of India at the Bankers’ Club in Kolkata on Dec. 9, 2009, available at https://rbidocs.rbi.org.in/rdocs/Speeches/PDFs/IFFG091209.pdf, accessed on June 10, 2020. Sundarasen, S.D.D., Rahman, M.S., Othman & Danaraj, J. (2016). Impact of Financial Literacy, Financial Socialization Agents and Parental Norms on Money Management. Journal of Business Studies Quarterly, 8(1), pp. 140-56 (ISSN 2152-1034). Tomczak, M.T., & Tomczak, Ewa (2014). The Need to Report Effect Size Estimates Revisited. an Overview of Some Recommended Measures of Effect Size., Trends in Sport Sciences. Tuesta, D., Sorensen G., Haring, A., & Cámara, N. (2015). Financial inclusion and its determinants: The Argentine case, Working Paper No 15/03, BBVA Research, Madrid, Spain, available at https://www.bbvaresearch.com/wp-content/uploads/2015/01/WP_15-03_Financial-Inclusion-in-Argentina.pdf, accessed on April 18, 2020. Vanlalmuana & Gupta, H. (2015). Financial Inclusion among Private School Teachers in Aizawl. International Journal of Management and Social Sciences, 4(6), pp. 43-53. Varcoe K., Go C.G. Eng T., Pho W., & Choi L. (2012). Money savvy youth: Evaluating the effectiveness of financial education for fourth and fifth graders, Community Development Working Paper No. 2012, Federal Reserve Bank of San Francisco (http://citeseerx.ist.psu.edu/viewdoc/download?doi=10.1.1.296.3252&rep=rep1&type=pdf) Volpe, R. P., Chen, H., & Pavlicko, J. J. (1996). Personal investment literacy among college students: A survey. Financial Practice and Education, 6(2), 86-94. Volpe, R.P., Joseph E.K., & Haiyang C. (2002). A Survey of Investment Literacy among Online Investors. Financial Counselling & Planning, 13(1), pp. 1–13 Wagner, J. (2019). Financial education and financial literacy by income and education groups. Journal of Financial Counselling and Planning, 30(1), 132–141. https://doi.org/10.1891/1052-3073.30.1.132 Worthington, A.C. (2006). Predicting financial literacy in Australia. Financial Services Review, 15(1), pp. 59-79. Zinsa, A., & Weill, L. (2016). The determinants of financial inclusion in Africa. Review of Development Finance, 6, pp. 46-57.
|