|
L. Lakshmanan, S. Chinngaihlian and Raj Rajesh* This
paper provides an analytical abstract of various parameters of manufacturing competitiveness
of the Indian economy. India's manufacturing exports have risen impressively in
the past decade or so and found to be directly linked to the world GDP and inversely
related to real effective exchange rate (REER). Indian manufacturing industries
have certain inherent strengths and advantages in having a relatively inexpensive,
adequate and skilled labour force, cost-effective and competitive prices of goods
produced, large manufacturing base and proximity to fast growing Asian markets.
India is one of the leading producers and exporters in a number of commodities
and enjoys significant advantages in terms of lower labour costs as compared to
other economies. Nevertheless, India's competitiveness is lost on account of lower
labour productivity and higher input and material costs. To improve the competitiveness
of the Indian manufacturing goods, issues like further diversification of export
basket, upgradation of export quality, improvement in productivity, increased
technology intensity in production, enhanced R&D activity, encouraging business
environment, less cumbersome regulatory environment, flexible labour laws, removal
of infrastructural bottlenecks and SME related issues need attention of all concerned. JEL
Classification : F 230, L 150, L 600, O 570 Keywords : Manufacturing
sector, Competitiveness Introduction Sustained
increase in competitiveness of an economy is a hallmark of economic strength and
stability of that economy. Worldwide, there has been an increasing awareness,
especially among emerging market economies (EMEs), about the need to strive for
improved competitiveness to face the realities of the globalised trading environment.
In the case of India, such recognition is reflected during the recent years, particularly
in the constitution of National Manufacturing Competitiveness Council. At
the current juncture, the Indian economy is at the threshold of entering the big
league through a crucial turnaround in its performance. Such a turnaround has
been reshaping India's image as one of the emerging economic powers in the world.
India has recognised the opportunities stemming from globalisation and accordingly
revamped its policies to promote industry and services sectors. India's ability
to compete on the global stage is amply demonstrated by the boom in information
technology and software services. India has emerged as a destination for outsourcing
of not only information technology enabled services (ITES) but also a host of
other services including certain manufacturing activities such as automotive components,
pharmaceuticals, textiles, etc. India is fast establishing its image as
a competitive economy the world over, which assures low-cost and high-quality
products. In the recent years, it has achieved certain landmarks in the manufacturing
sector. Amongst them, the most important has been the rise of Indian MNCs, which
have been on expanding mode and acquiring companies abroad and developing their
production base in other countries. In addition, Indian firms are exporting services
ranging from call centres to medical diagnostics and tutoring American high school
students. In this backdrop, Indian economy could be larger than all the countries
in the world other than the US and China in another 30 years and India's growth
will remain above 5 per cent through the period (Goldman Sachs, 2003). Against
this setting, this paper makes a modest attempt to assess the competitiveness
of India's manufacturing sector, its relative position among the countries of
comparable economic size, its strengths and vulnerabilities, the issues to be
addressed to strengthen India's competitiveness and to suggest some policy preferences.
The scheme of the paper is as follows. Concept and benchmark indicators of competitiveness
based on some literature survey is presented in Section
I. Section II analyses the dynamics of India's manufacturing sector exports. Section
III critically evaluates India's manufacturing sector competitiveness based on
specific factors like openness, unit labour cost, labour productivity and national
innovative capacity. A micro-level analysis on the competitiveness of select manufacturing
commodities of export importance for India has been set out in Section IV. Section
V identifies the critical issues faced by the Indian manufacturing sector while
competing in the global market and suggests some measures to improve India's competitiveness.
Concluding observations are drawn in Section VI. Section I Concepts
and Benchmark Indicators of Competitiveness At micro
level, it is relatively easy to define competitiveness of a firm, which is the
ability to do better than comparable firms in sales, market share or profitability;
but competitiveness of a country is interpreted broadly on development or growth
strategy. However, a narrower, more tractable, definition is to take the country's
ability to compete in international trade. Thus, a country may be termed competitive
if it is able to sell its products at a lower (or same) price and earn the same
(or higher) return as its competitors. Variables such as remuneration of factors
of production, exchange rate and productivity through the use of better technical
skills and human resource development as also economies of scale are having greater
influence in deciding the extent of competitiveness of export products in the
globalised setting. OECD defines competitiveness as the
degree to which a nation can, under free trade and fair market conditions, produce
goods and services, which meet the test of international markets, while simultaneously
maintaining and expanding the real incomes of its people over the long-term. The
World Economic Forum (WEF) defines competitiveness as the ability of a country
to achieve sustained high rates of growth in GDP per capita. According to National
Competitiveness Council (in USA), competitiveness is the ability to achieve success
in markets leading to better standards of living for all. According to it, competitiveness
is a concept that is important at a range of levels, from the level of an individual
firm to the level of an industry, from the level of a small local region to the
level of an association of nation states. The concept of
competitiveness, thus, can contribute to an understanding of the distribution
of wealth, both nationally and internationally, if it is recognised that it can
be applied at both the enterprise and the country level; when applied at the enterprise
level, it relates to profits or market shares; when applied at the country level,
it relates to both national income and international trade performance, particularly
in relation to specific industrial sectors that are important in terms of employment
or productivity and growth potential (UNCTAD, 2004a). Benchmark Indicators
and Competitiveness of the Indian Economy There are
two leading surveys on competitiveness at global level that document competitiveness
of economies on a regular basis, viz., Global Competitiveness Report [by
the World Economic Forum (WEF), Switzerland] and World Competitiveness Yearbook
[by International Institute for Management Development (IMD) of Lausanne, Switzerland].
The WEF first introduced Global Competitiveness Report 2001-2002 in 2002, which
has since then become an annual publication. The report uses two concepts of competitiveness:
Global Competitiveness Index (GCI) and Business Competitiveness Index (BCI). The
GCI aims specifically at gauging the world's economies in achieving sustained
economic growth over the medium to long-term. Three indices are used for computing
GCI, viz., the macroeconomic environment index, the public institutions
index, and the technology index. BCI complements the GCI, with its special emphasis
on the underlying microeconomic conditions defining the current sustainable level
of productivity in each of the countries covered. The underlying concept being
that, while macroeconomic and institutional factors are critical for national
competitiveness, these are necessary but not sufficient factors for creating wealth.
Wealth is actually created at microeconomic level by the companies operating in
the economy. The BCI evaluates two specific areas, which are critical to the business
environment in each country - the sophistication of the operating practices and
strategies of companies, and the quality of the microeconomic business environment
in which a nation's companies compete. In terms of global
benchmarking parameters, Global Competitiveness Report 2006-2007 has ranked India
at the 43rd position among 125 economies in terms of the GCI (Table
1). Thus, India has moved two steps higher than the ranking received during 2005.
The Indian economy has been progressively integrating with the global market since
the initiation of economic reforms in the early 1990s. This has facilitated substantial
improvement in the competitiveness of the economy. According to GCI, Singapore,
Korea, Malaysia and Thailand are more growth competitive than India. India received
significantly higher rankings with regard to Business Competitiveness Index at
27th amongst 121 economies, recording an improvement by 4 positions.
India's business competitiveness as in 2006 was better than some of the EMEs such
| Table
1: Competitiveness Index - Ranking of Select Economies | |
Country |
Global Competitiveness Index |
Business Competitiveness Index |
| |
2004 |
2005 |
2006 |
2001 |
2005 |
2006 | |
1 |
2 |
3 |
4 |
5 |
6 |
7 | |
Singapore |
7 |
5 |
5 |
9 |
5 |
11 | |
Korea |
29 |
19 |
24 |
26 |
24 |
25 | |
Malaysia |
31 |
25 |
26 |
37 |
23 |
20 | |
Thailand |
34 |
33 |
35 |
38 |
37 |
37 | |
India |
55 |
45 |
43 |
36 |
31 |
27 | |
South Africa |
41 |
40 |
45 |
25 |
28 |
33 | |
Indonesia |
69 |
69 |
50 |
55 |
59 |
35 | |
China |
46 |
48 |
54 |
43 |
57 |
64 | |
Mexico |
48 |
59 |
58 |
52 |
60 |
57 | |
Russia |
70 |
53 |
62 |
56 |
74 |
79 | |
Brazil |
57 |
57 |
66 |
30 |
49 |
55 | |
Philippines |
76 |
73 |
71 |
53 |
69 |
72 | |
Note : GCI
Ranking among 104 Countries for 2004.
Source : Global Competitiveness
Report, 2005, 2006-07, WEF. |
as China, Mexico, Indonesia, Philippines and Russia, though
it lagged behind other economies such as Singapore, Korea and Malaysia. According
to the World Competitiveness Yearbook 2006, India ranked 29th among
60 major countries and regions in the world. This is 10 notches up from the 39th
rank India achieved in the previous year (Table 2). As per the rankings, Singapore,
Malaysia and China are more competitive than India. In addition
to the overall competitiveness of economies assessed by the WEF and IMD, United
Nations Industrial Development Organisation (UNIDO) also published in its annual
report, the competitiveness of the industrial sector of a number of economies
and their ranking. The UNIDO's Competitive Industrial Performance (CIP) ranking
is a benchmark for industrial activity comprising four variables, viz.,
manufacturing value added per capita, manufactured exports per capita, industrialisation
intensity and export quality. Industrial competitiveness ranking of a majority
of the South East Asian countries are higher than India. India's rank has slipped
down from 36 in 1990 to 40 in 2000 among the list of 93 countries (Table 3).
| Table
2: World Competitiveness Ranking by IMD – | |
Select Countries |
| Country |
2006 |
2005 |
2004 |
2003 | |
1 |
2 |
3 |
4 |
5 | |
Singapore |
3 |
3 |
2 |
4 | |
China |
19 |
31 |
24 |
29 | |
Malaysia |
23 |
28 |
16 |
21 | |
India |
29 |
39 |
34 |
50 | |
Thailand |
32 |
27 |
29 |
30 | |
Korea |
38 |
29 |
35 |
37 | |
South Africa |
44 |
46 |
49 |
47 | |
Philippines |
49 |
49 |
52 |
49 | |
Brazil |
52 |
51 |
53 |
52 | |
Mexico |
53 |
56 |
56 |
53 | |
Russia |
54 |
54 |
50 |
54 | |
Indonesia |
60 |
59 |
58 |
57 | |
Source :
IMD World Competitiveness Yearbook, Various issues. |
| Table
3: Competitive Industrial Performance of
Select Countries - Rank |
| Economy |
1980 |
1990 |
2000 | |
1 |
2 |
3 |
4 | |
Singapore |
2 |
1 |
1 | |
Japan |
5 |
4 |
6 | |
Korea |
23 |
18 |
10 | |
United States |
13 |
14 |
11 | |
Malaysia |
40 |
23 |
15 | |
United Kingdom |
12 |
13 |
17 | |
Thailand |
47 |
32 |
23 | |
China |
39 |
26 |
24 | |
Philippines |
42 |
43 |
25 | |
Mexico |
31 |
29 |
26 | |
Brazil |
24 |
27 |
31 | |
South Africa |
36 |
44 |
35 | |
Indonesia |
75 |
54 |
38 | |
India |
38 |
36 |
40 | |
Note : Ranking
among 93 countries for all the years.
Source : UNIDO Annual Report
2004. |
Section II The
Dynamics of India's Manufacturing Sector Exports Before
analysing the parameters that determine the competitiveness of the Indian manufacturing
sector, it would be useful to understand the dynamics of growing export performance
of the Indian manufacturing sector. Manufacturing exports dominate the export
basket of the Indian economy and account for nearly 70 per cent of the total merchandise
exports. The Indian manufacturing exports have risen faster since the Indian economy
started opening up in the 1980s. The manufactured exports as a percentage of India's
GDP has increased from 2.5 per cent in 1983-84 to 9.1 per cent in 2006-07 (Chart
1). The depreciation of Indian Rupee since the 1980s, along with liberalisation
measures in the trade and exchange rate regimes have contributed to the growth
of manufacturing exports of the country. Furthermore, growing integration with
the world economy has also aided the expansion of the manufactured exports. It
would be worthwhile to revisit the factors that have contributed to the growing
exports of the economy. 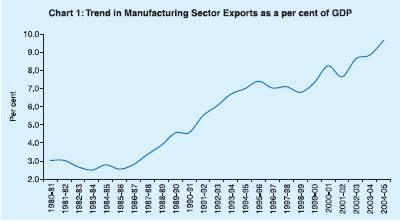
Several
studies have established a significant relationship between export performance
and the real exchange rate in India. Joshi and Little (1994) attributed a considerable
part of the success in export expansion during the second half of the 1980s to
the real exchange rate depreciation. They argue that the depreciation of the real
exchange rate by about 30 per cent between 1985-86 to 1989-90 was a critical factor
in driving India's exports. Srinivasan (1998) analysed India's exports over 1963-94
and found that real exchange rate appreciation negatively affects export performance.
Besides exchange rate, global GDP has also been found to have a positive association
with increasing exports of India. In the light of these studies, we would assess
the role of these variables in driving India's manufacturing exports. To
begin with, the role of Real Effective Exchange Rate (REER) in driving India's
manufacturing sector exports is assessed. For analysing this relationship, we
take inverted-REER, which is the reciprocal of REER. The inverted-REER eases the
visual introspection so that an increase in REER reflects depreciation, while
a decrease appreciation. The near co-movement of manufacturing sector exports
and inverted-REER for most of the period (during 1980-81 to 2003-04), validates
that REER has been one of the factors in determining our exports (Chart 2). The
correlation between the manufacturing 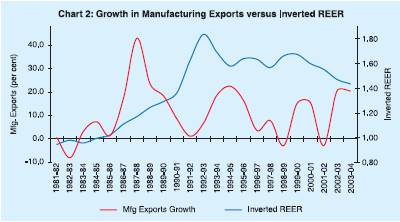
exports
and inverted REER is found to be high at 0.66. This indicates that change in REER
significantly affects the manufactured exports. The years 2002-03 and 2003-04,
however, appear to be aberrations, wherein the exports have increased despite
the appreciation of the Rupee. This perhaps suggests that India's manufacturing
sector exports are becoming more competitive in the global economy. Apart
from REER, global GDP has also been found to be affecting the India's manufacturing
sector exports. It is observed that for most of the period since 1980s, there
has been a co-movement of growth in manufacturing exports and global GDP growth
(Chart 3). During 1999-2000 to 2004-05, a significant correlation of 0.56 was
observed between India's manufacturing sector exports and the global GDP growth,
which suggests that the former has started depending upon the latter. We
tried to estimate an empirical relationship among manufacturing exports, REER,
and world GDP for the period 1980-81 to 2003-04 through a regression analysis
using ordinary least squares (OLS). In the estimate, we found a relationship wherein
the manufactured exports (dependent variable) depend positively on world GDP,
and negatively on the real effective exchange rate. In the estimation exercise,
the variables were log-transformed. A dummy 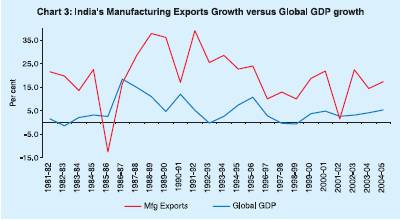
variable
(DUM) was also introduced to capture the effects of devaluation of Indian Rupee
(in 1991) on manufacturing exports. DUM assumes a value equal to 1 in 1991 and
is 0 for the rest of the years. The estimated relationship is as follows:
LMFGXt = 0.45 LWGDPt - 0.37 LREERt + 0.71 LMFGXt-1- 0.15
DUM
(2.73) (-2.61) (6.26) (-2.05) Adj. R2 = 0.988,
DW-Statistics= 1.33 where, figures in parentheses indicate the t-statistics. LMFGX
= Log of Export Volume (expressed in US dollars)
LWGDP = Log of World GDP
LREER
= Log of Real Effective Exchange Rate
DUM = Dummy to capture the devaluation
of Indian Rupee in 1991. The results are on expected
lines. Manufacturing exports were found to be positively associated with global
GDP. The elasticity estimate suggests that a 10 per cent rise in global GDP enhances
India's manufacturing exports by 4.5 per cent. The negative elasticity of export
demand with respect to REER during the period implies that the real appreciation
of the rupee adversely affects India's manufactured exports. Section
III Measuring the Competitiveness of Indian Manufacturing Sector At
a micro level, several studies have been made to assess the competitiveness of
India's manufacturing sector. The CII and the World Bank jointly carried out a
study in 2002 using various parameters such as investment climate (Government
effectiveness, rule of law, graft, and political instability and violence); labour
costs; regulatory regime; interest costs; energy costs; delays at custom houses,
etc., to measure the competitiveness of the Indian manufacturing sector.
For the present study, we have used the following parameters to make a comparative
analysis of India's competitiveness vis-à-vis other economies of
comparable economic size, particularly the Asian countries. A. Openness
of the Indian Economy Openness of an economy can be
related to its permissiveness towards cross border movement of goods, services
and other factors of production. An increased openness implies higher trade flows
and availability of wider range of goods and services to choose from, often at
more competitive prices. Also, international trade and investment flows will increase
the access to newer and more innovative technologies, which can, in turn, lead
to productivity improvements. Trade openness of an economy
has two distinct dimensions - ex-post openness and ex-ante openness.
Ex-post openness of an economy refers to the actual inflow of imports and
outflow of exports. Ex-ante openness of trade of an economy, on the other
hand, relates to the permissiveness of its policy towards exports and imports
like levels of tariff and non-tariff measures applied by the country on cross-border
trade flows. We first begin with ex-post openness
analysis, which is simply based on the actual trade flows such as the share of
trade in GDP or the growth rates of imports and exports. Trade openness measured
as the ratio of sum of exports and imports to GDP reveals a continuous increasing
trend in India's trade openness since 1987-88. India's openness increased sharply
from 15.7 per cent in 1990 to 31.8 per cent in 2003 in the aftermath of economic
reforms in the country. However, when compared to other EMEs in Asia such as China,
Korea, Malaysia, Thailand, Vietnam, etc., India was not found to be a highly
open economy as its trade-GDP ratio is much lower. Even the average tariff rate
in India is much higher than these economies. Nevertheless, in terms of economic
freedom, when compared with other EMEs in Asia, India is found to be at par with
these economies. In terms of investment flows as well, India has lagged behind
many of these EMEs (Table 4). The ex-ante openness is measured by
trade barriers. The direct measure of trade barriers includes inter alia
average tariff rates or
| Table
4: Comparative Openness Indicators | |
(Per cent) | |
Indicator |
China |
India |
Korea |
Malaysia |
Thailand |
Vietnam | |
1 |
2 |
3 |
4 |
5 |
6 |
7 | |
Trade | | | | | | |
| (Exports+Imports)/GDP,
1990 | 31.9 |
15.7 |
59.4 |
147.0 |
75.8 |
81.3 | |
(Exports+Imports)/GDP, 2003 (%)a |
65.0 |
31.8 |
73.8 |
204.8 |
122.3 |
115.0 | |
Export growth, 1990–2003b |
18.0 |
11.2 |
9.3 |
11.3 |
10.3 |
13.2 | |
Average tariff rate, 2002c |
12.4 |
28.0 |
4.9 |
5.2 |
10.5 |
15.0 | |
Index of Economic Freedom (2005)d |
3.5 |
3.5 |
2.6 |
3.0 |
3.0 |
3.8 | |
Investment | | | | | | |
| FDI
as % of total capital inflows, | | | | | | |
| 1990–1996e |
90.0 |
15.0 |
7.0 |
147.0 |
16.0 |
81.0 | |
FDI as % of total capital inflows, | | | | | | |
| 1997–2001f |
92.0 |
22.0 |
34.0 |
32.0 |
-57.0 |
82.0 | |
Total FDI stock as % of GDP, 1990 |
7.0 |
0.5 |
2.3 |
23.4 |
9.6 |
4.0 | |
Total FDI stock as % of GDP, 2000 |
32.3 |
4.1 |
13.7 |
58.8 |
20.0 |
46.7 | |
FDI as % of GDP, 1990–00 | | | | | | |
| (annual
average) | 4.1 |
0.4 |
0.8 |
6.4 |
2.2 |
6.6 | |
Notes : a
Data for Vietnam are for the year 2002.
b Data for Vietnam are for the period
1997-2002.
c Average import tariff (MNF) for manufactured goods, ores, and
metals.
d Index of Economic Freedom ranges from 0 (mostly free) to 5 (highly
restricted).
e Data for India refer to the period 1991–1996; for Vietnam 1996.
f Data for India refer to the period 1997–2000; for Korea and Thailand 1997–2002;
for Malaysia 1999 and 2000 are not available.
Source : Asian Development
Report 2004 and Asian Development Outlook 2005, ADB. |
coverage ratios for non-tariff barriers. India's customs tariff
rates have been declining since 1991. The peak rate has come down from 150 per
cent in 1991-92 to 40 per cent in 1997-98. In compliance with the WTO requirements,
the basic customs duty has further been reduced to make it at world competitive
level. The Union Budget 2007-08 has reduced the basic customs duty to 10.0 per
cent. Average customs tariff rates, however, remain among the highest in the world.
As per the World Development Indicator 2007, out of a set of 132 countries for
which data on (simple) average customs tariffs were available, India had one of
the highest average tariff rates (Table 5). In terms of weighted mean tariffs
also (weighted by the country's trade with each of its trading partner), India
has the highest tariff in terms of all products including manufactured products.
| Table
5: Tariff Barriers - Cross-Country Comparison | |
(Per cent) | |
Countries |
Year |
All Products |
Primary
Products |
Manufactured Products |
| | |
Simple |
Weighted |
Share of |
Share |
Simple |
Weighted |
Simple |
Weighted | | | |
Mean |
Mean |
lines with |
of lines |
Mean |
Mean |
Mean |
Mean | | | |
Tariff |
Tariff |
internat- ional peaks |
with specific tariff |
Tariff |
Tariff |
Tariff |
Tariff | |
1 |
2 |
3 |
4 |
5 |
6 |
7 |
8 |
9 |
10 | |
Argentina |
1992 |
14.2 |
12.7 |
31 |
0 |
8.1 |
5.8 |
14.7 |
13.6 | | |
2005b |
10.6 |
5.2 |
22.6 |
0.0 |
8.0 |
1.8 |
10.8 |
5.7 | |
Brazil |
1989 |
43.0 |
31.0 |
92.2 |
0.5 |
31.5 |
18.6 |
44.0 |
37.1 | | |
2005b |
12.3 |
7.1 |
27.7 |
0.0 |
7.9 |
1.5 |
12.6 |
9.2 | |
China |
1992 |
40.4 |
32.1 |
77.6 |
0.0 |
36.1 |
14.1 |
40.6 |
35.6 | | |
2005b |
9.2 |
4.9 |
19.1 |
0.0 |
8.8 |
3.4 |
9.2 |
5.3 | |
Indonesia |
1989 |
19.2 |
13.0 |
50.3 |
0.3 |
18.2 |
5.9 |
19.2 |
15.1 | | |
2005b |
6.5 |
6.0 |
8.7 |
0.0 |
7.2 |
3.5 |
6.4 |
6.7 | |
Korea |
1988 |
18.6 |
14.0 |
72.8 |
10.3 |
19.3 |
8.3 |
18.6 |
17.0 | | |
2004b |
9.0 |
9.3 |
5.6 |
0.0 |
20.3 |
17.7 |
7.2 |
4.5 | |
Malaysia |
1988b |
14.5 |
9.7 |
46.1 |
7.2 |
10.9 |
4.6 |
14.9 |
10.8 | | |
2005b |
7.5 |
4.4 |
22.4 |
0.0 |
3.4 |
2.3 |
8.2 |
4.8 | |
Thailand |
1989 |
38.5 |
33.0 |
72.8 |
22.0 |
30.0 |
24.3 |
39.0 |
35.0 | | |
2005b |
10.6 |
4.9 |
22.1 |
0.9 |
13.1 |
2.3 |
10.0 |
5.7 | |
India |
1990b |
79.0 |
56.1 |
97.0 |
0.9 |
69.8 |
34.1 |
79.9 |
70.8 | | |
2005b |
17.0 |
14.5 |
15.5 |
3.5 |
24.4 |
16.5 |
15.9 |
12.8 | |
b : Rates are either partially or fully recorded
applied rates. All other simple and weighted tariff rates are most favored nation
rates.
Source: World Development Indicators, 2007, World Bank. |
The collection rate
indicates the incidence of customs duty and also levies/duties other than customs
tariffs, which are not in the protective tariffs, viz., special additional
duty on imports levied to offset the incidence of domestic trade taxes other than
union excise duty borne by domestic producers, countervailing duty on import of
goods meant to offset incidence of excise duty on similarly produced indigenous
goods. It not only captures the element of protection due to customs duties but
also the incidence of other duties/levies, which are in the nature of offsets
to mitigate the impact of host of domestic levies for which producers cannot avail
of any credit. Collection rates since the 1990s have declined substantially across
all commodity groups in India. The most significant reduction in collection rates
was observed in 'chemicals', 'man-made fibre' and 'metals' (Table 6).
| Table
6: Collection Rates for Selected Import Groups* | |
(Per cent) | |
Commodity |
1990- |
1995- |
2000- |
2001- |
2002- |
2003- |
2004- |
2005- | |
Groups |
91 |
96 |
01 |
02 |
03 |
04 |
05 |
06 | |
(Prov.) | |
1 | |
2 |
3 |
4 |
5 |
6 |
7 |
8 |
9 | |
1. |
Food Products |
47 |
23 |
31 |
40 |
30 |
19 |
22 |
32 | |
2. |
POL |
34 |
30 |
16 |
10 |
11 |
11 |
10 |
6 | |
3. |
Chemicals |
92 |
44 |
38 |
29 |
28 |
24 |
22 |
20 | |
4. |
Man-made fibres |
83 |
36 |
49 |
31 |
31 |
46 |
39 |
34 | |
5. |
Paper & newsprint |
24 |
8 |
8 |
6 |
7 |
7 |
7 |
9 | |
6. |
Natural fibres |
20 |
12 |
18 |
8 |
10 |
13 |
11 |
12 | |
7. |
Metals |
95 |
52 |
48 |
36 |
36 |
32 |
26 |
25 | |
8. |
Capital goods |
60 |
33 |
36 |
28 |
23 |
19 |
16 |
12 | |
9. |
Others |
20 |
13 |
12 |
9 |
9 |
8 |
6 |
5 | |
10. |
Non POL |
51 |
28 |
23 |
19 |
17 |
14 |
12 |
11 | |
11. |
Total |
47 |
29 |
21 |
16 |
15 |
14 |
11 |
10 | |
* Collection rate is defined as the ratio of realised
import revenue (including additional customs duty/countervailing duty
(CVD),
and special additional duty) to the value of imports of a commodity.
S.No.1
includes cereals, pulses, tea, milk and cream, fruits, vegetables, animal fats
and sugar.
S.No. 3 includes chemical elements, compounds, pharmaceuticals,
dyeing and colouring materials, plastic and rubber.
S.No. 5 includes pulp
and waste paper, newsprint, paperboards and manufactures and printed books.
S.No. 6 includes raw wool and silk.
S.No. 7 includes iron and steel and non-ferrous
metals.
S.No. 8 includes non-electronic machinery and project imports, electrical
machinery.
Source: Economic Survey 2006-07, Government of India. |
Import duty collection
rates in India remain one of the highest in the world. According to the World
Trade Report 2003, (WTO), the ratio of duties collected to imports in India, even
during the post 1990s, has been far higher than those levied by other comparable
countries. The average import duties collection ratio was much lower at around
3 - 5 per cent in China, Malaysia, Indonesia, Korea and Thailand whereas in India,
it was about 24.5 per cent in 1995-2000 (Table 7). As regards
non-tariff barriers (NTBs), any levy other than customs duty or charges may be
categorised as non-tariff barriers, which is generally grouped into: (i) import
policy barriers; (ii) standards, testing, labelling and certification requirements;
(iii) anti-dumping and countervailing measures; (iv) export subsidies and domestic
support; (v) Government procurement; (vi) service barriers; (vii) lack of adequate
protection to intellectual property rights; (viii) other barriers. Over the years,
the NTBs applied by India have been drastically pruned. NTBs in the form of prohibited,
restricted, canalised imports and imports requiring special import
| Table
7: Import Duty Collected by Developing Countries | |
1985-2000 |
| Country |
Import |
Ratio of Duties Collected |
| |
Value |
to Imports |
| |
(US $ bn) |
(Period Averages) |
| |
2000 |
1985-89 |
1990-94 |
1995-2000 |
| 1 |
2 |
3 |
4 |
5 | |
Mexico |
183 |
5.2 |
5.7 |
2.0 | |
Malaysia |
82 |
6.4 |
4.0 |
2.3 | |
Indonesia* |
34 |
5.2 |
5.0 |
2.4 | |
China |
225 |
10.3 |
4.7 |
3.2 | |
Korea |
160 |
8.0 |
5.3 |
3.6 | |
Thailand |
62 |
11.3 |
9.0 |
5.0 | |
Brazil |
59 |
8.2 |
8.1 |
8.0 | |
India* |
51 |
54.8 |
38.4 |
24.5 |
| *
: Data pertains to fiscal year.
Source : World Trade Report, 2003. |
| Table
8: Different Types of NTBs on India’s Imports, | |
1996-97 - 2000-01# |
| Type
of NTBs | 1996 |
1997 |
1998 |
1999 |
2000 |
2001 | |
1 |
2 |
3 |
4 |
5 |
6 |
7 | |
Prohibited |
59 |
59 |
59 |
59 |
59 |
59 | |
Restricted |
2984 |
2322 |
2314 |
1183 |
968 |
479 | |
Canalised |
127 |
129 |
129 |
37 |
34 |
– | |
SIL |
765 |
1043 |
919 |
886 |
226 |
– | |
Free |
6161 |
6649 |
6781 |
8055 |
8854 |
9611 ** | |
** : Including 29 tariff lines shifted to State Trading.
# : As on April 1.
Note : Number of tariff lines, 10 digit level -
As per Harmonised System of India’s Trade Classification, HS-ITC classification
of export & import. SIL : Special Import Licence
Source : DGFT,
Ministry of Commerce. |
license have been cut down and an increase in number of items have been put
in the list of freely importable items (Table 8). Notwithstanding
this cut in NTBs, India has one of the highest levels of NTBs among the EMEs.
As per the WDI 2005, India had the highest ad valorem equivalent of NTBs
at 3.2 per cent followed by Brazil at 2.4 per cent (Table 9). Taking
into account various measures of openness, it is inferred that though India is
increasingly becoming an open economy, it lags behind some of the EMEs owing to
its higher tariff, import duty, and collection ratio and high level of NTBs.
| Table
9: Level of Non-Tariff Barriers in Select Countries | |
(Per cent) | |
Country |
All Products -
Ad valorem equivalent
of NTBsa | |
1 |
2 | |
Brazil |
2.4 | |
China |
1.5 | |
India |
3.2 | |
Indonesia |
0.5 | |
Malaysia |
1.7 | |
South Africa |
0.5 | |
Thailand |
0.3 | |
a: Ad valorem equivalents of non-tariff barriers
are calculated for 2000 only.
Source: World Development Indicators,
2005, World Bank. | |
B. Unit Labour Cost and Labour Productivity Another
important indicator of competitiveness is the unit labor cost in manufacturing,
since labour represents the most important non-traded input in manufacturing activity.
Labour costs are also the most easily quantifiable, compared to the cost of capital.
Unit labour cost (ULC) is defined as total compensation, C, per hour employed,
H, divided by productivity, where the latter is measured as total output (O) per
hour employed (Hooper and Larin, 1989). It could be represented as ULC = (C/H)
/ (O/H). A rise in a country's ULC relative to other countries
leads to a decline in its competitiveness, which would translate into lower global
market share. However, empirical evidence suggests that over the long-term, market
share for exports and relative unit costs or prices tend to move together (Kaldor
paradox). The central problem concerning inter-country comparisons of labour costs
is how to translate the costs calculated for individual countries into comparable
or common currency units. For the present analysis, the wage rate and ULC, as
published in a research article by the Asian Development Bank, has been used.
In terms of ULC, as in 2000, India had a competitive edge over Singapore and Korea
(Table 10).
| Table
10: Unit Labour Cost in Manufacturing Industry in | | |
Select Asian Economies | |
| Country |
1980 |
1990 |
2000 | |
1 |
2 |
3 |
4 | |
Singapore |
0.244 |
0.300 |
0.225 | |
Korea |
0.157 |
0.183 |
0.107 | |
Malaysia |
0.211 |
0.139 |
na | |
Thailand |
na |
0.063 |
na | |
India |
0.203 |
0.106 |
0.046 |
| China |
0.100 |
na |
na | |
Indonesia |
0.128 |
0.043 |
0.036 | |
Philippines |
0.060 |
0.051 |
na | |
na : Not Available.
Source : ADB Economic
and Research Department Working Paper Series No. 53, June 2004. |
On comparing the unit
labour cost of few commodities in some EMEs, it is found that except clothing,
unit labour cost in India is higher in commodities like food products, textiles,
electrical machinery and transport equipments (Table 11). In the case of food
products, though unit labour cost in India has declined from 1.74 in 1980 to 1.29
in 2000, it is still higher as compared to other competitors. In textiles, unit
labour cost in India not only increased during 1980-2000 but also remained high
among some of the EMEs. The unit labour cost in case of electrical machinery though
decreased during 1980-2000, it remained higher than Brazil, Indonesia, Philippines,
Korea and Thailand. In transport equipment as well, unit labour cost has not only
increased in India during the period but also remained the highest amongst these
economies.
| Table
11: Unit Labour Costs in Select EMEs, 1980 and 2000 | |
(Ratios to the United States level) |
| Country |
Food products |
Textiles |
Clothing |
Electrical machinery |
Transport equipment |
| Economy |
1980 |
2000 |
1980 |
2000 |
1980 |
2000 |
1980 |
2000 |
1980 |
2000 | |
1 |
2 |
3 |
4 |
5 |
6 |
7 |
8 |
9 |
10 |
11 | |
Brazil |
0.53a |
0.74b |
0.42c |
0.65b |
0.39c |
0.47b |
0.52c |
0.81b |
0.60c |
0.53b | |
China |
0.68 |
.. |
0.26 |
.. |
0.08 |
.. |
0.59 |
.. |
0.42 |
.. | |
India |
1.74 |
1.29 |
1.25 |
1.57 |
0.96 |
0.47 |
1.01 |
0.98 |
1.24 |
1.43 |
| Indonesia |
0.97 |
0.71 |
0.61 |
0.42 |
0.95 |
0.45 |
0.49 |
0.62 |
0.4 |
0.26 | |
Malaysia |
0.60 |
1.08 |
0.75 |
0.59 |
0.82 |
0.84 |
0.71 |
1.01 |
0.67 |
0.69 | |
Mexico |
1.00 |
0.90 |
0.85 |
0.88 |
0.69h |
0.64 |
0.73 |
1.06 |
0.49 |
0.43 | |
Philippines |
0.63 |
0.65d |
0.60 |
0.67d |
0.80 |
0.59d |
0.6 |
0.80d |
0.47 |
0.40d | |
Korea |
0.81 |
0.73 |
0.74 |
0.63 |
0.71 |
0.62 |
0.82 |
0.56 |
0.78 |
0.71 | |
Thailand |
0.46i |
0.92j |
0.46i |
0.87j |
0.67i |
1.07j |
0.35k |
0.65j |
0.48k |
0.41j | |
Note :
a
: 1984. b : 1995. c : 1985. d : 1997. e : 1999. f : 1996. g : 1998. h : 1984.
i : 1979. j 1994. k 1982.
Unit labour costs calculated as wages (in current
dollars) divided by value added (in current dollars).
Source : UNCTAD
Secretariat calculations, based on UNIDO, Industrial Statistics Database, 2002. |
A comparison of annual
wage rates in India with other EMEs reveals that it is much lower than that of
Thailand, Singapore, Philippines, Malaysia and Korea (Table 12). However, as in
2000 annual wage rate in Indonesia was found to be much lower than that of India.
Labour productivity in Indian industry is also found to be lower. The Investment
Climate Survey data (Chart 4 & 5), show that the manufacturing value added
per worker and
| Table
12: Annual Wage Rates in Select Asian Countries | |
(US $) | |
Year |
Thailand |
Singapore |
Philippines |
Malaysia |
Korea |
Indonesia |
India |
| 1 |
2 |
3 |
4 |
5 |
6 |
7 |
8 | |
1980 |
na |
4,141 |
1,127 |
2,075 |
2,837 |
743 |
976 |
| 1981 |
na |
4,942 |
1,241 |
2,204 |
3,019 |
897 |
973 |
| 1982 |
2,230 |
5,550 |
1,301 |
2,496 |
3,153 |
1,066 |
1,023 |
| 1983 |
na |
6,338 |
1,350 |
2,796 |
3,256 |
905 |
1,143 |
| 1984 |
2,362 |
6,920 |
1,180 |
3,025 |
3,499 |
879 |
1,170 |
| 1985 |
na |
7,235 |
1,258 |
3,087 |
3,476 |
921 |
1,155 |
| 1986 |
na |
7,005 |
1,285 |
2,959 |
3,629 |
877 |
1,255 |
| 1987 |
na |
7,162 |
1,482 |
2,985 |
4,545 |
746 |
1,331 |
| 1988 |
1,885 |
7,749 |
1,704 |
2,836 |
6,120 |
817 |
1,367 |
| 1989 |
2,288 |
9,093 |
1,900 |
2,858 |
8,286 |
865 |
1,308 |
| 1990 |
2,503 |
10,803 |
1,803 |
2,976 |
9,353 |
674 |
1,355 |
| 1991 |
2,904 |
12,352 |
1,913 |
3,169 |
10,947 |
736 |
1,131 |
| 1992 |
na |
14,357 |
2,534 |
3,769 |
11,824 |
875 |
1,148 |
| 1993 |
2,995 |
15,633 |
2,471 |
3,989 |
12,811 |
929 |
1,059 |
| 1994 |
3,344 |
17,665 |
2,848 |
4,286 |
14,328 |
945 |
1,161 |
| 1995 |
na |
20,313 |
3,105 |
4,811 |
17,129 |
1,458 |
1,306 |
| 1996 |
na |
21,703 |
3,120 |
5,383 |
18,660 |
1,503 |
1,281 |
| 1997 |
na |
22,002 |
2,966 |
5,470 |
16,615 |
n.a. |
1,347 |
| 1998 |
na |
20,026 |
na |
na |
10,964 |
543 |
1,169 |
| 1999 |
na |
19,621 |
na |
4,189 |
13,489 |
849 |
1,299 |
| 2000 |
na |
21,042 |
na |
na |
15,134 |
925 |
1,322 |
| Source
: ADB Economic and Research Department Working
Paper Series No. 53, June 2004. | 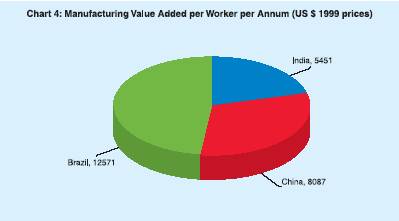
manufacturing
wages per worker were lower when compared to China and Brazil. Nevertheless, India
is fast catching-up with other economies as there have been impressive gains in
labour productivity growth in the country. Labour productivity growth in India
during 1995 to 2001 has all along been better than some countries like Korea,
Philippines, China, Japan, Malaysia and Singapore, thus, indicating an increasing
level of competitiveness vis-à-vis these economies (Table 13). 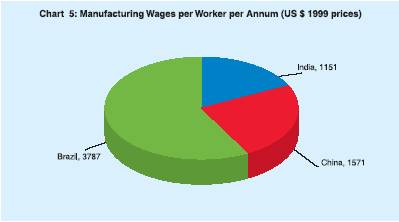
| Table
13: Labour Productivity Growth | |
(Per cent) | |
Country / year |
1995 |
1996 |
1997 |
1998 |
1999 |
2000 |
2001 | |
1 |
2 |
3 |
4 |
5 |
6 |
7 |
8 | |
India |
6.42 |
6.84 |
3.74 |
5.37 |
4.90 |
3.12 |
4.21 |
| Korea |
6.55 |
4.70 |
4.43 |
1.15 |
9.07 |
2.80 |
3.39 | |
Philippines |
2.05 |
0.42 |
2.72 |
-1.29 |
-0.49 |
10.28 |
2.80 | |
China |
2.74 |
7.49 |
5.64 |
4.40 |
5.35 |
4.57 |
1.97 | |
Japan |
1.79 |
3.00 |
0.79 |
-0.47 |
0.95 |
2.93 |
0.89 | |
Malaysia |
6.62 |
5.70 |
5.60 |
-1.79 |
3.86 |
6.10 |
0.29 | |
Singapore |
4.69 |
5.30 |
3.63 |
-2.94 |
5.51 |
-1.51 |
-0.08 | | | | | | | | | |
| Note
: Growth in real GDP per person employed.
Source : APO Asia Pacific Productivity data & Analysis 2003, Tokyo,
Japan. |
C. National
Innovative Capacity International
competitiveness increasingly depends on innovation. Local companies’ ability to
acquire and deploy technology from around the world cannot sustain competitiveness
over a longer period. With the erosion of traditional barriers to entry, competitiveness
flows from the ability of companies in a nation to create and then globally commercialise
novel products and processes and shift higher-up the innovation frontier as fast
as rivals catch up. According to WEF, national innovative capacity is composed
of four broad elements, viz., common innovative infrastructure, cluster-specific
conditions, quality of linkages and company innovative orientation that define
how location shapes the ability of a company to innovate at the global frontier.
Overall, it is observed that there exists a strong co-relation between Innovative
Capacity Index (ICI) and Business Competitiveness Index (BCI), with some exception.
India’s ICI as in 2003 lagged behind Korea, Malaysia, and China. However, in terms
of innovation in policy, linkages and strategy, India is ahead of China. In terms
of innovative capacity, India also has a competitive edge over Thailand and Indonesia.
On the whole, India’s weakness in innovative capacity highlights the fact that
it has to put in strenuous efforts to transform from a low technology producer
to a high technology cost effective producer (Table 14).
| Table
14: National Innovative Capacity Index and Sub-indices | |
Country |
Innovative |
Proportion of |
Innovation |
Cluster |
Innovative Operations & |
ICI |
BCI |
GDP | | |
Capacity |
Scientists & |
Policy |
Index |
Innovation |
Linkages |
Strategy |
2002 |
2003 |
per | | |
Index 2003 |
Engineers Index | | |
Environment Index |
Index |
Index | | |
capita2002 |
| |
Rank |
Index |
Rank |
Index |
Rank |
Index |
Rank |
Index |
Rank |
Index Rank |
Index |
Rank |
Rank |
Rank | |
1 |
2 |
3 |
4 |
5 |
6 |
7 |
8 |
9 |
10 |
11 |
12 |
13 |
14 |
15 |
16 | |
Korea |
20 |
31.13 |
20 |
7.75 |
24 |
4.74 |
16 |
6.67 |
18 |
5.79 |
21 |
6.19 |
22 |
23 |
27 | |
Malaysia |
35 |
26.85 |
59 |
5.07 |
16 |
5.04 |
18 |
6.47 |
37 |
4.78 |
31 |
5.48 |
39 |
26 |
42 | |
China |
40 |
25.86 |
43 |
6.3 |
45 |
3.99 |
26 |
6.2 |
40 |
4.65 |
56 |
4.71 |
36 |
46 |
65 | |
India |
44 |
25.5 |
60 |
5.06 |
38 |
4.13 |
28 |
6.12 |
28 |
5.32 |
50 |
4.89 |
43 |
37 |
74 | |
Thailand |
47 |
24.74 |
69 |
4.3 |
34 |
4.37 |
30 |
5.98 |
45 |
4.53 |
28 |
5.56 |
46 |
31 |
53 | |
Indonesia |
50 |
24.04 |
48 |
5.89 |
42 |
4.3 |
50 |
5.11 |
62 |
4.18 |
52 |
4.83 |
59 |
60 |
73 | |
ICI : Innovative Capacity Index.
BCI : Business
Competitiveness Index.
Note : Represents the ranking of 95 countries.
Source : The Global Competitiveness Report 2003-2004, WEF. |
Section IV Commodity-wise Competitiveness
of India’s Manufacturing Products India is one of the
leading producers of a number of commodities in the world. India has been a leading
producer of textiles, non-metallic mineral products, chemical and chemical products
and basic metals amongst the developing countries. It is placed among the top-15
producers in the world in textiles, apparel, leather products, wood products,
paper, chemicals, petroleum products, rubber products, non-metallic mineral products,
basic metals, metal products, and transport equipments (Table 15). However, the
country is facing close and stiff competition from a host of countries, including
China, Korea, Singapore, Thailand, Malaysia, Brazil, Mexico, etc., for
these commodities (Table 16). When we look at the commodity-wise
labour productivity, it is observed that India has the lowest labour productivity
among the select countries in the case of food products (Table 17).
It is also observed that input and material cost remained the highest accounting
for more than 88 per cent of total value of the output in India. The operating
surplus remained the lowest – even less than 10 per cent of the total value of
output. On the other hand, except Singapore, the operating surplus in case of
other countries had been in excess of
| Table
15: India’s Share and Rank in the Production of Select | |
Commodities in World and Developing
Countries | |
Commodities |
World |
Developing Countries |
| |
1995 |
2003 |
1995 |
2003 | |
1 |
2 |
3 |
4 |
5 | |
Textiles |
3.2 (8) * |
4.8 (4) |
9.4 (2) |
11.8 (1) | |
Wearing apparel, leather, footwear |
.. |
.. |
3.0 (10) |
2.0 (14) | |
Leather, Leather Products and footwear |
1.5 (15) |
2.9 (11) |
4.6 (7) |
7.6 (5) | |
Coke, Refined Petroleum, nuclear fuel |
1.6 (15) |
2.4 (8) |
4.5 (8) |
6.3 (4) | |
Chemicals and Chemical Products |
2.1 (9) |
2.9 (7) |
12.4 (3) |
15.3 (2) | |
Non-metallic mineral products |
1.3 (15) |
2.2 (11) |
5.8 (5) |
8.8 (3) | |
Basic metals |
2.2 (11) |
2.9 (8) |
12.9 (2) |
14.1 (2) | |
Machinery and Equipment |
.. |
1.3 (13) |
8.9 (3) |
10.8 (3) | |
Office, Accounting and Computing | | | | |
| Machinery |
.. |
0.2 (15) |
3.6 (8) |
2.5 (7) | |
Electrical Machinery and Apparatus |
0.9 (10) |
1.8 (5) |
12.7 (3) |
21.8 (1) | |
Other Transport Equipment |
1.8 (11) |
3.3 (9) |
12.1 (3) |
16.3 (3) | |
Motor Vehicles, Trailers, Semi-Trailers |
.. |
1.2 (12) |
7.3 (5) |
9.2 (3) | |
* : Figures in parentheses indicate the ranks.
.. : Not in Top 15 Rankings.
Source: International Yearbook of Industrial
Statistics, 2005, UNIDO. |
one-fifth of the value of output. The higher input cost and
lower operating surplus deter firms from exploiting economies of scale, which
explains why India has not been able to emerge as one of the leading producers
of food products. In the case of textiles, labour
productivity in India remains low, while the input costs remains abnormally high,
which, in turn, has eaten away the operating surplus margin. This again leaves
India at a competitive disadvantageous position vis-à-vis Argentina,
Malaysia, Mexico, Korea, Singapore, etc (Table 18). The
Indian iron and steel industry is highly matured. Though, India is one
of the leading producers of iron and steel, it has to improve its performance
from its lower labour productivity and higher input cost (Table 19).
| Table
16: India’s Main Competitors in Exports of Select | |
Manufactured Goods – 2001-02 |
| Commodity
at the SITC Revision
2 group (3-digit) level |
India's Share in World Exports |
India's Main Competitors Among
Developing Economies | |
1 |
2 |
3 | |
322 |
Coal, Lignite and Peat |
0.27 |
China, Indonesia, South Africa, Colombia, Venezuela,
and Vietnam. | |
334 |
Petroleum Products, Refined |
1.58 |
Singapore, Republic of Korea, Saudi Arabia, Kuwait,
United Arab Emirates, Bahrain, Venezuela, Algeria, and China. |
| 541 |
Medicinal, Pharmaceutical Products |
1.04 |
China, Mexico and Singapore | |
582 |
Product of Condensation, etc. |
0.51 |
China, Singapore, Thailand, Malaysia, Indonesia and
Mexico. | | 611 |
Leather |
2.82 |
China, Korea, Brazil, Argentina, Thailand, Pakistan
and Bangladesh. | |
651 |
Textile Yarn |
5.29 |
China, Korea, Indonesia and Pakistan. |
| 652 |
Cotton Fabrics, Woven |
4.25 |
China, Pakistan, Korea, Turkey, Indonesia, Thailand
and Mexico. | | 653 |
Woven Man-Made Fib Fabric |
2.40 |
China, Korea, Indonesia, UAE, Turkey, Thailand and
Pakistan. | | 658 |
Textile Articles NES |
6.46 |
China, Pakistan, Turkey, Korea, Mexico, Brazil, and
Indonesia. | | 667 |
Pearl, Precious, semi-Precious Stones |
12.46 |
South Africa, China, Botswana and Thailand. |
| 672 |
Iron, Steel Primary Forms |
1.27 |
Brazil, Korea, Turkey, China, South Africa and Mexico. |
| 674 |
Iron, Steel Plate, Sheet |
1.44 |
Korea, China, Brazil and Mexico. |
| 728 |
Other Machinery for |
0.28 |
Korea, China, Singapore, Mexico, Malaysia, |
| |
Specified Industry | |
Brazil and South Africa. | |
749 |
Non-electrical Machinery Parts, Accessories |
0.34 |
China, Mexico, Singapore, Korea, Brazil, Thailand
and Malaysia. | |
785 |
Cycles, etc, Motorised or not |
1.58 |
China, Thailand, Singapore, Indonesia and Korea. |
| 793 |
Ships, Boats, etc. |
0.17 |
Korea, China, Trinidad and Tobago, Singapore, Turkey,
UAE and Malaysia. | |
843 |
Women’s Outwear Non-knit |
3.82 |
China, Mexico, Turkey, Indonesia, Philippines, Morocco,
Bangladesh and Sri Lanka. | |
844 |
Under Garments Non-knit |
6.93 |
China, Bangladesh, Indonesia, Korea, Turkey, Sri
Lanka and Philippines. | |
846 |
Under Garments Knitted |
4.18 |
China, Turkey, Mexico, Indonesia, Thailand, Bangladesh,
Korea and Pakistan. | |
848 |
Headgear, Non-Textile Clothing |
2.59 |
China, Malaysia, Thailand, Pakistan, Turkey, Korea
and Indonesia. | |
851 |
Footwear |
0.98 |
China, Viet Nam, Brazil, Indonesia, Thailand, Korea,
Mexico and Tunisia. | |
897 |
Gold, Silver ware, Jewellery |
5.34 |
China, Thailand, Korea, Turkey, Malaysia, Mexico,
Singapore and UAE. | |
898 |
Musical Instruments and Parts |
0.74 |
China, Korea, Mexico, Malaysia, Indonesia, and Thailand. |
| Source
: UNCTAD Handbook of Statistics, 2004. |
| Table
17: Labour Productivity and Cost Component of | |
Food Products in Select Economies |
| Country |
Latest Year
(LY) |
Labour Productivity
(Current
1000 dollars) |
Percentage in Output |
| Inputs
and Materials Cost |
Cost of Labour |
Operating Surplus |
| | |
1995 |
LY |
1995 |
LY |
1995 |
LY |
1995 |
LY | |
1 |
2 |
3 |
4 |
5 |
6 |
7 |
8 |
9 |
10 | |
Argentina |
1999 |
37.3 |
29.2 |
55.6 |
60.3 |
12.1 |
16.5 |
32.2 |
23.2 | |
Brazil |
2002 |
.. |
12.2 |
.. |
59.1 |
.. |
9.6 |
.. |
31.3 | |
India |
2001 |
.. |
2.8 |
.. |
79.9 |
.. |
6.3 |
.. |
13.8 |
| Indonesia |
2002 |
.. |
4.2 |
.. |
62.5 |
.. |
7.0 |
.. |
30.4 | |
Malaysia |
2001 |
.. |
13.5 |
.. |
68.3 |
.. |
9.0 |
.. |
22.7 | |
Mexico |
2000 |
23.3 |
38.6 |
60.8 |
58.1 |
8.0 |
9.1 |
31.2 |
32.7 | |
Korea |
2001 |
55.1 |
62.9 |
52.4 |
52.5 |
11.3 |
8.8 |
36.3 |
38.7 | |
Singapore |
2002 |
45.3 |
29.0 |
65.3 |
73.0 |
14.1 |
14.2 |
20.6 |
12.8 | |
Source : International
Yearbook of Industrial Statistics 2005, UNCTAD. |
India compares favourably vis-à-vis other EMEs
in the case of industrial chemicals (Table 20). Since the 1990s,
labour productivity in chemical industry in India has improved, while the input
and material cost has come down, leading to generation of higher operating surplus.
| Table
18: Labour Productivity and Cost Component | |
of Textiles Industry in Select
Economies | |
Country |
Latest |
Labour |
Percentage in Output |
| |
Year
(LY) |
Productivity
(Current 1000
dollars) |
Inputs and Materials Cost |
Cost of Labour |
Operating Surplus |
| | |
1995 |
LY |
1995 |
LY |
1995 |
LY |
1995 |
LY | |
1 |
2 |
3 |
4 |
5 |
6 |
7 |
8 |
9 |
10 | |
Argentina |
1999 |
20.3 |
21.0 |
60.7 |
63.3 |
18.9 |
18.1 |
20.4 |
18.6 | |
Brazil |
2002 |
.. |
10.0 |
.. |
55.3 |
.. |
13.1 |
.. |
31.6 | |
India |
2001 |
.. |
3.3 |
.. |
77.3 |
.. |
6.1 |
.. |
16.5 |
| Indonesia |
2002 |
.. |
1.7 |
.. |
69.3 |
.. |
14.3 |
.. |
16.4 | |
Malaysia |
2001 |
.. |
8.4 |
.. |
53.3 |
.. |
15.5 |
.. |
21.2 | |
Mexico |
2000 |
9.2 |
14.3 |
68.3 |
66.5 |
11.5 |
12.2 |
20.2 |
21.3 | |
Korea |
2001 |
41.1 |
37.5 |
56.7 |
59.5 |
14.4 |
12.3 |
28.8 |
28.2 | |
Singapore |
2002 |
31.9 |
15.4 |
53.4 |
68.1 |
24.2 |
25.1 |
22.5 |
6.9 | |
Source :
International Yearbook of Industrial Statistics 2005, UNCTAD. |
| Table
19: Labour Productivity and Cost Component of Basic | |
Iron and Steel Industry in Select
Economies | |
Country |
Latest Year
(LY) |
Labour Productivity
(Current
1000 dollars) |
Percentage in Output |
| Inputs
and Material Cost
|
Cost
of Labour | Operating
Surplus | | | |
1995 |
LY |
1995 |
LY |
1995 |
LY |
1995 |
LY | |
1 |
2 |
3 |
4 |
5 |
6 |
7 |
8 |
9 |
10 | |
Argentina |
1999 |
52.6 |
45.0 |
71.5 |
69.7 |
10.2 |
15.4 |
18.3 |
14.9 | |
Brazil |
2002 |
.. |
55.6 |
.. |
56.3 |
.. |
6.7 |
.. |
36.9 | |
Turkey |
2000 |
39.1 |
41.1 |
74.4 |
72.6 |
5.9 |
8.7 |
19.7 |
18.7 | |
Philip | | | | | | | | | |
| pines |
1999 |
.. |
14.9 |
.. |
67.5 |
.. |
5.4 |
.. |
27.1 | |
India |
2001 |
.. |
6.8 |
.. |
83.5 |
.. |
5.9 |
.. |
10.7 |
| Indonesia |
2002 |
.. |
25.0 |
.. |
72.6 |
.. |
3.1 |
.. |
24.3 | |
Malaysia |
2001 |
.. |
15.4 |
.. |
85.8 |
.. |
5.5 |
.. |
8.7 | |
Mexico |
2000 |
63.6 |
83.7 |
69.2 |
70.3 |
3.0 |
3.9 |
27.8 |
25.8 | |
Source : International
Yearbook of Industrial Statistics 2005, UNCTAD. |
In the case of electrical machinery and transport equipments,
India enjoys the advantage of lower labour cost. However, the competitive advantage
is lost on account of higher input and material cost and lower operating surplus
(Table 21).
| Table
20: Labour Productivity and Cost Component of Basic | |
Chemicals in Select Economies |
| Country |
Latest Year
(LY) |
Labour Productivity
(Current
1000 dollars) |
Percentage in Output |
| Inputs
and Materials Cost |
Cost of Labour |
Operating Surplus |
| | |
1995 |
LY |
1995 |
LY |
1995 |
LY |
1995 |
LY | |
1 |
2 |
3 |
4 |
5 |
6 |
7 |
8 |
9 |
10 | |
Brazil |
2002 |
.. |
64.4 |
.. |
69.0 |
.. |
4.7 |
.. |
26.3 | |
India |
2001 |
.. |
15.4 |
.. |
79.0 |
.. |
3.6 |
.. |
17.4 |
| Indonesia |
2002 |
.. |
24.7 |
.. |
74.5 |
.. |
3.2 |
.. |
22.3 | |
Korea |
2001 |
171.3 |
149 |
60.1 |
71.5 |
5.6 |
4.2 |
34.3 |
24.3 | |
Philip | | | | | | | | | |
| pines |
1999 |
.. |
12.9 |
.. |
70.7 |
.. |
6.9 |
.. |
22.4 | |
Malaysia |
2001 |
.. |
78.6 |
.. |
65.5 |
.. |
3.9 |
.. |
30.5 | |
Mexico |
2000 |
63.2 |
61.3 |
63.8 |
70.9 |
4.4 |
6.4 |
31.8 |
22.8 | |
Singapore |
2002 |
138.2 |
122 |
64.9 |
76.7 |
8.8 |
7.1 |
26.4 |
16.2 | |
Source : International
Yearbook of Industrial Statistics 2005, UNCTAD. | |
| Table
21: Labour Productivity and Cost Component of Electric | |
Motors, Generators and Transformers
in Select Economies | |
Country |
Latest Year
(LY) |
Labour Productivity |
Percentage in Output |
| Inputs
and Materials Cost |
Cost of Labour |
Operating Surplus |
| | |
1995 |
LY |
1995 |
LY |
1995 |
LY |
1995 |
LY | |
1 |
2 |
3 |
4 |
5 |
6 |
7 |
8 |
9 |
10 | |
Brazil |
2002 |
.. |
20.0 |
.. |
53.7 |
.. |
13.8 |
.. |
32.5 | |
India |
2001 |
.. |
7.0 |
.. |
75.9 |
.. |
8.6 |
.. |
15.5 |
| Indonesia |
2002 |
.. |
12.6 |
.. |
44.0 |
.. |
9.4 |
.. |
46.6 | |
Korea |
2001 |
45.0 |
41.3 |
59.7 |
63.0 |
13.5 |
12.1 |
26.8 |
24.9 | |
Malaysia |
2001 |
.. |
7.0 |
.. |
73.6 |
.. |
12.3 |
.. |
14.1 | |
Mexico |
2000 |
14.6 |
21.4 |
63.8 |
63.8 |
13.3 |
14.4 |
22.8 |
21.8 | |
Singapore |
2002 |
34.5 |
33.3 |
70.1 |
83.2 |
14.9 |
11.4 |
15.0 |
5.5 | |
Turkey |
2000 |
42.8 |
31.1 |
55.8 |
56.4 |
9.0 |
14.4 |
35.2 |
29.2 | |
Source :
International Yearbook of Industrial Statistics 2005, UNCTAD. |
India is having the
advantage of low cost labour in respect of automobile parts and accessories. However,
the labour productivity in India relating to automobiles is low while its input
and material cost are high (Table 22).
| Table
22: Labour Productivity and Cost Component of Parts/ | |
Accessories for Automobiles in
Select Economies | |
Country |
Latest |
Labour |
Percentage in Output |
| |
Year
(LY) |
Productivity
(Current 1000
dollars) |
Inputs and Materials Cost |
Cost of Labour |
Operating Surplus |
| | |
1995 |
LY |
1995 |
LY |
1995 |
LY |
1995 |
LY | |
1 |
2 |
3 |
4 |
5 |
6 |
7 |
8 |
9 |
10 | |
Argentina |
1999 |
23.1 |
21.2 |
66.4 |
67.9 |
18.9 |
21.9 |
14.7 |
10.1 | |
Brazil |
2002 |
.. |
19.5 |
.. |
56.7 |
.. |
13.0 |
.. |
30.3 | |
India |
2001 |
.. |
5.9 |
.. |
73.4 |
.. |
8.2 |
.. |
18.4 |
| Indonesia |
2001 |
.. |
8.1 |
.. |
69.7 |
.. |
5.7 |
.. |
24.5 | |
Malaysia |
2001 |
.. |
15.5 |
.. |
65.6 |
.. |
10.0 |
.. |
24.4 | |
Mexico |
2000 |
19.0 |
28.5 |
64.4 |
68.9 |
8.8 |
9.0 |
26.0 |
22.1 | |
Korea |
2001 |
54.3 |
49.2 |
57.7 |
63.9 |
13.8 |
10.8 |
28.5 |
25.4 | |
Singapore |
2002 |
54.0 |
34.9 |
59.1 |
56.1 |
18.4 |
26.5 |
22.5 |
17.5 | |
Source : International
Yearbook of Industrial Statistics 2005, UNCTAD. |
In the last decade or so, merchandise trade in office machines
and telecom equipments has expanded significantly. With the growing opportunity
in trade in these equipments, some EMEs have taken advantage of this opportunity
to expand their exports. In countries like Malaysia, Philippines and Singapore,
such exports comprise about half of the merchandise exports. However, in India
such exports accounted for only 1.1 per cent of total merchandise exports in 2006
(Table 23). The global trade in automotive components has
also expanded very fast since the 1990s. India has made progress in the trade
of automotive components as its share in total global exports of automotive products
has increased from 0.06 per cent in 1990 to 0.32 per cent in 2006 (Table 24).
Nevertheless, India’s share in global
| Table
23: Exports of Office and Telecom Equipments | |
of Select Economies |
| Country |
Value (Million dollars) |
Share in Economy’s Merchandise
Exports (%) | | |
1990 |
1995 |
2000 |
2004 |
2005 |
2006 |
2000 |
2006a |
| 1 |
2 |
3 |
4 |
5 |
6 |
7 |
8 |
9 | |
Brazil |
692 |
749 |
2,376 |
2,030 |
3,722 |
3,979 |
4.3 |
2.9 | |
Chinab |
3,126 |
14,506 |
43,498 |
171,782 |
225,964 |
287,331 |
17.5 |
29.7 | |
Indiac,d |
182 |
465 |
480 |
850 |
985 |
1,373 |
1.1 |
1.1 |
| Indonesia |
124 |
2,281 |
7,280 |
6,454 |
6,810 |
6,178 |
11.1 |
6.0 | |
Korea |
14,339 |
33,217 |
58,686 |
82,584 |
82,991 |
83,671 |
34.1 |
25.7 | |
Malaysiab |
8,207 |
32,721 |
52,382 |
56,172 |
60,091 |
67,874 |
53.3 |
42.2 | |
Mexicob |
4,535 |
11,616 |
34,042 |
36,232 |
38,044 |
46,625 |
20.5 |
18.6 | |
Philippinesb,d |
1,835 |
7,564 |
25,138 |
23,990 |
23,792 |
26,057 |
63.2 |
55.4 | |
Singapore |
19,235 |
60,322 |
73,820 |
92,465 |
101,683 |
118,023 |
53.6 |
43.4 | |
South Africa | |
211 |
409 |
598 |
607 |
764 |
1.4 |
1.3 | |
Thailand |
3,520 |
11,660 |
18,653 |
21,215 |
23,910 |
29,390 |
27.0 |
22.5 | |
World’s | | | | | | | | |
| Total |
298,550 |
604,730 |
966,828 |
1,150,790 |
1,279,262 |
1,451,376 |
15.4 |
12.3 | |
a Or nearest year.
b Includes significant exports
from processing zones.
c Figures refer to fiscal year.
d Includes Secretariat
estimates.
Source : International Trade Statistics (2007), WTO. |
| Table
24: Exports of Automotive Products of Select Economies | |
Country |
Value (Million dollars) |
Share in Economy’s Merchandise
Exports (%) | | |
1990 |
1995 |
2000 |
2004 |
2005 |
2006 |
2000 |
2006a |
| 1 |
2 |
3 |
4 |
5 |
6 |
7 |
8 |
9 | |
Argentina |
200 |
1,374 |
2,108 |
2,185 |
3,047 |
4,178 |
8.0 |
9.0 | |
Brazil |
2,034 |
2,955 |
4,682 |
8,699 |
11,983 |
13,038 |
8.5 |
9.5 | |
Chinab |
258 |
621 |
1,581 |
6,272 |
9,957 |
14,411 |
0.6 |
1.5 | |
Indiac,d |
198 |
568 |
640 |
1,863 |
2,732 |
3,242 |
1.4 |
2.6 |
| Indonesia |
22 |
130 |
369 |
875 |
1,340 |
1,724 |
0.6 |
1.7 | |
Korea |
2,301 |
9,166 |
15,194 |
32,320 |
37,748 |
43,059 |
8.8 |
13.2 | |
Malaysiab |
121 |
279 |
307 |
554 |
725 |
920 |
0.3 |
0.6 | |
Mexicob |
4,708 |
14,258 |
30,655 |
31,906 |
35,424 |
42,632 |
18.4 |
17.0 | |
Philippinesb,d |
23 |
218 |
583 |
1,351 |
1,538 |
1,506 |
1.5 |
3.2 | |
Singapore |
348 |
886 |
678 |
1,951 |
2,310 |
2,396 |
0.5 |
0.9 | |
South Africa |
249 |
730 |
1,708 |
3,702 |
4,352 |
4,970 |
5.7 |
8.5 | |
Thailand |
108 |
486 |
2,417 |
5,548 |
7,983 |
9,901 |
3.5 |
7.6 | |
World’s | | | | | | | | |
| Total |
318,960 |
459,190 |
577,113 |
860,287 |
920,408 |
1,015,941 |
9.2 |
8.6 | |
a Or nearest year.
b Includes significant exports
from processing zones.
c Figures refer to fiscal year.
d Includes Secretariat
estimates.
Source : International Trade Statistics (2007), WTO. |
exports of automotive products is very
less as compared to Brazil, China, Mexico, Korea and Thailand. Against
this backdrop, it is observed that across a variety of commodities, as compared
to other economies, mainly Asian countries, Indian manufactured products suffer
from lower labour productivity, higher inputs and materials cost, lower operating
surplus, despite having one of the lowest labour cost. Higher input cost in India
is attributable to cascading effect of indirect taxes on selling prices of commodities;
higher cost of utilities like power, transport and high transactions costs. Multiplicity
and high level of taxes, high cost of capital and poor quality and excessive user
charges of support infrastructure services impose additional costs to the tune
of 12.2 per cent of the cost of production (FICCI, 2005). Higher input and material
costs account for a major part of the value added thereby rendering the lower
labour cost advantage of the economy ineffective. Lower operating surplus leaves
little incentive for industrialists to expand their capacity and grow big. At
the same time, it is found that India’s share in trade of those commodities, which
are traded the most in the world such as office machines and telecom equipments,
automotive components, and other machinery and transport equipments, is very low.
Nevertheless, there exists substantial opportunities for India to expand its global
share in exports of these commodities. Section V Issues to be
Addressed in Boosting up India’s Manufacturing Sector Competitiveness Indian
manufacturing industries have certain inherent strengths and advantages in having
a relatively inexpensive, adequate and skilled labour force, cost-effective and
competitive prices of goods produced, large manufacturing base and proximity to
fast growing Asian markets. In general, India has one of the largest pool of scientists
and engineers, thereby giving the country a competitive edge in pursuing R&D
activities. Furthermore, the presence of a number of high quality R&D institutions
also imparts a competitive edge. Some of the manufacturing industries have their
own sector specific inherent strengths when compared to other economies. With
its cheap and skilled labour force and impressive design expertise, India stands
a better chance in expanding its textile exports. Abundant supply of quality raw
material will enable the Indian textile industry to produce quality consumer products
at a competitive rate. In pharmaceuticals, the success stories of Indian companies
combining two very unique Indian characteristics: a large pool of talented chemists
and good entrepreneurial ability augur well for its growth. A sizeable export
business of US $ 350 million has already been built in active ingredients for
generic drugs and formulations. With the rise of the Indian
firms at the international level, it is argued that Indian companies have some
key fundamental strength that will help them dominate not just their domestic
markets, but parts of the global market as well. India is no longer seen as a
laggard and the country is now well on the road to become the world’s favourite
destination for outsourcing for R&D, engineering design, telecommunications,
super-specialty healthcare and a manufacturing hub for high technology products.
India is among the world leaders in the production of textiles, non-metallic mineral
products, basic metals, etc., and steadily capturing the world export markets
in the services like software exports, BPO, ITES, in addition to pharmaceuticals.
Certain generic issues that affected the competitiveness of the Indian manufacturing
sector such as a dynamic competitive environment supported by market institutions
and law have been addressed by the Government in the recent years. The Government
enacted a new modern competition law in the form of Competition Act, 2002 to uphold
competition in the Indian market. The Central Government established the Competition
Commission of India on October 14, 2003 to carry out the objectives of the Act.
The limitations in the MRTP Act have been adequately covered in the new Competition
Act, 2002. Furthermore, the National Manufacturing Competitiveness
Council (NMCC) was set up in September 2004 to provide a continuing forum for
policy dialogue to energise and sustain the growth of manufacturing industries.
As a first step towards developing a strategy for manufacturing growth, a Strategy
Paper on ';National Strategy for Manufacturing'; was prepared by the NMCC,
which attempted to identify the key policy initiatives to make the Indian manufacturing
become competitive to realise higher level of growth and employment in the country.
The NMCC has identified certain deficient areas, which require immediate attention
and policy initiation not only from the Government side but also from other stake
holders like firms, industrial associations, trade bodies, etc., to attain
the required growth in the manufacturing sector. The Investment Commission
has been constituted to find out ways and means of attracting certain level of
secure investments. The Commission will make recommendations
both on policies and procedures to facilitate greater FDI flows into India. A
High Level Committee on Manufacturing was constituted in April 2006 with the Prime
Minister as the Chairman. The Committee would address macroeconomic issues impinging
on the growth and competitiveness of the manufacturing sector in India, and create
a policy framework for necessary reforms covering all the aspects of manufacturing
competitiveness. The Committee would also ensure coordination among the various
Ministries which deal with manufacturing sub-sectors and review the implementation
of time-bound action plans to achieve the objective of 12 per cent growth in manufacturing
sector. The Committee would initiate steps to make India a manufacturing hub for
areas having potential for global competitiveness such as textiles, automobiles,
leather, food processing, steel, metals, chemicals and petroleum products. This
is a positive step towards encouraging manufacturing sector growth, which would
improve the competitiveness of the Indian manufactures. Despite
these institutional developments to boost the India’s manufacturing competitiveness,
India’s comparative performance vis-à-vis some of the EMEs is low
due to various reasons as seen in the earlier sections. There is a need to address
the following important issues appropriately to improve the competitiveness of
the Indian manufacturing sector. Further Diversification of Manufacturing
Export Basket It has been found that
the manufacturing exports accounted for about 70 per cent of the total exports
of the country. Of which, five sectors, viz., gems and jewellery, textiles
and garments, engineering goods, chemicals, leather and leather goods alone accounted
for over 68.0 per cent of India’s exports (Table 25). While India’s manufacturing
sector exports have shifted from leather and textiles to chemicals and engineering
goods over the years, there appears to be considerable scope for further diversification
of manufacturing sector exports and concentrate on high value manufactured goods
to further improve its competitiveness.
| Table
25: Changing Composition of India’s Export - Share | |
(Per cent) | |
Commodity |
1990-91 |
1995-96 |
2000-01 |
2001-02 |
2002-03 |
2003-04 |
2004-05 |
2005-06 P |
| 1 |
2 |
3 |
4 |
5 |
6 |
7 |
8 |
9 | |
Primary products |
23.8 |
22.8 |
16.0 |
16.3 |
16.5 |
15.5 |
16.2 |
16.0 | |
Agriculture and allied | | | | | | | | |
| products |
18.5 |
19.1 |
13.4 |
13.5 |
12.7 |
11.8 |
10.1 |
9.9 | |
Ores and minerals |
5.3 |
3.7 |
2.6 |
2.9 |
3.8 |
3.7 |
6.1 |
6.0 | |
Manufactured goods |
71.6 |
74.7 |
77.1 |
76.1 |
76.3 |
76.0 |
72.7 |
69.9 | |
Leather and | | | | | | | | |
| manufactures |
8.0 |
5.5 |
4.4 |
4.4 |
3.5 |
3.4 |
2.9 |
2.6 | |
Chemicals and Related | | | | | | | | |
| products |
9.5 |
11.3 |
13.2 |
13.8 |
14.1 |
14.8 |
14.9 |
14.1 | |
Engineering goods |
12.4 |
13.8 |
15.3 |
15.9 |
17.1 |
19.4 |
20.8 |
21.0 | |
Textile and Textile | | | | | | | | |
| Products |
23.9 |
25.3 |
25.3 |
23.3 |
22.0 |
20.0 |
16.2 |
15.6 | |
Gems and jewellery |
16.1 |
16.6 |
16.6 |
16.7 |
17.1 |
16.6 |
16.5 |
15.1 | |
Handicrafts * |
1.2 |
1.4 |
1.5 |
1.3 |
1.5 |
0.8 |
0.5 |
0.4 | |
Other Manufactured | | | | | | | | |
| Goods |
0.4 |
0.8 |
0.8 |
0.9 |
0.9 |
1.0 |
1.0 |
1.1 | |
Petroleum products |
2.9 |
1.4 |
4.2 |
4.8 |
4.9 |
5.6 |
8.4 |
11.2 | |
Others |
1.7 |
1.1 |
2.8 |
2.7 |
2.3 |
2.9 |
2.7 |
2.9 | |
Total exports |
100.0 |
100.0 |
100.0 |
100.0 |
100.0 |
100.0 |
100.0 |
100.0 | |
P : Provisional.
* : Excluding handmade carpets.
Source : Directorate General of Commercial Intelligence and Statistics,
Government of India. |
Improvement
in Export Quality Poor quality of products plays a crucial
role in determining export competitiveness of an economy. In terms of export
quality indices provided by the UNIDO2 , India does not fare well
and significantly lags behind many of the EMEs such as China, Thailand, Philippines,
Malaysia and Singapore (Table 26). Improvement in Productivity As
observed earlier, labour productivity in respect of many of the manufacturing
goods in India is very low when compared to other EMEs. The need of the hour is
to identify fast-track industries on the basis of comparative advantage or raw
material availability or process capabilities or local product development capability
or specific skills
| Table
26: Export Quality Indices of Some Economies | |
| Country |
1980 |
1990 |
2000 | |
1 |
2 |
3 |
4 | |
Philippines |
0.341 |
0.446 |
0.960 | |
Singapore |
0.614 |
0.843 |
0.943 | |
Malaysia |
0.392 |
0.696 |
0.896 | |
Mexico |
0.572 |
0.638 |
0.878 | |
Thailand |
0.413 |
0.606 |
0.781 | |
China |
0.254 |
0.590 |
0.727 | |
Brazil |
0.476 |
0.618 |
0.672 | |
South Africa |
0.265 |
0.302 |
0.596 | |
Indonesia |
0.162 |
0.359 |
0.568 | |
India |
0.417 |
0.509 |
0.545 |
| Source
: Industrial Development Report, 2004,
UNIDO. |
or
a combination of these and encourage them to achieve better competitiveness. Change
in productivity can come by introducing and entrenching Total Productive Maintenance
(TPM) process in every business activity. The essence of TPM is business process
improvement through working teams and cutting across organisational layers, which
yields significant benefits. Concerted efforts could be made to disseminate the
concept and its implementation. Increase in Technology Intensity Technology
intensity of exports is another factor determining competitiveness of the manufacturing
sector exports of an economy. India’s manufacturing exports largely comprise low-technology
induced goods. High-technology exports, according to World Bank, are products
with high R&D intensity in aerospace, computers, pharmaceuticals, scientific
instruments, and electrical machinery. In the world trade where primary products
and resource-based manufactures have steadily lost their importance, high technology
exports are the largest foreign exchange earners for various countries. In India,
though ITES is considered as the main driver of growth, the share of high-technology
items in its exports as compared with other EMEs is one of the least - about one-sixth
of that of China (Table 27).
| Table
27: High Technology Exports of Select Economies | |
Country |
2002 |
2005 | | |
US $ million |
As a % of Manufactured Exports |
US $ million |
As a % of Manufactured Exports |
| 1 |
2 |
3 |
4 |
5 | |
Philippines |
23,868 |
74.1 |
26,077 |
71.0 | |
Malaysia |
43,544 |
58.2 |
57,376 |
54.7 | |
Korea |
46,600 |
31.3 |
83,527 |
32.3 | |
United States |
191,123 |
33.5 |
233,079 |
31.8 | |
China |
68,182 |
23.3 |
214,246 |
30.6 | |
Japan |
94,730 |
24.5 |
122,680 |
22.5 | |
Indonesia |
5,070 |
16.4 |
6,571 |
16.3 | |
Brazil |
5,340 |
16.8 |
8,007 |
12.8 | |
Australia |
2,945 |
16.4 |
3,276 |
12.7 | |
Russia |
2,897 |
13.3 |
3,690 |
8.1 | |
South Africa |
740 |
5.1 |
1,739 |
6.6 | |
India$ |
1,879 |
4.8 |
2,840 |
4.9 |
| $
: Latest data relate to 2004.
Source : World Development Indicators,
2007. |
High
technology exports in the case of India constituted only 4.9 per cent of total
manufacturing exports in 2004. The low level of technological sophistication of
India’s exports undermines its competitiveness. Research and Development
Efforts Science and technology sheds light on countries’
technological base - the availability of skilled human resources, the competitive
edge the country enjoys in high-technology exports, sales and purchases of technology
through royalties and licenses, and the number of patent and trademark applications
filed. India lags behind a number of economies in terms of manpower for research
and development as well as efforts towards R&D (Table 28). Improvement
in Business Environment Countries differ widely in their business environment.
In some countries the process is straightforward and affordable, while in others
| Table
28: Research and Development Efforts | |
Countries |
Researchers
in R&D
(per million people) |
Technicians
in R&D
(per million people) |
Expend- itures for R&D
(% of GDP) |
Royalty and license fees
in
$ Million |
Patent
applications
filed |
| | | | |
Receipts |
Payments |
Residents |
Non- residents |
| |
2000-04 |
2000-04 |
2000-04 |
2005 |
2005 |
2004 |
2004 | |
1 |
2 |
3 |
4 |
5 |
6 |
7 |
8 | |
Argentina |
720 |
316 |
0.41 |
54 |
635 |
786 |
3,816 | |
Brazil |
344 |
332 |
0.98 |
102 |
1,404 |
3,892 |
14,800 | |
China |
708 |
– |
1.44 |
157 |
5,321 |
65,586 |
64,798 | |
India |
– |
– |
0.85 |
25 |
421 |
6,795 |
10,671 |
| Japan |
5,287 |
528 |
3.15 |
17,655 |
14,653 |
362,342 |
60,739 | |
Indonesia |
207 |
– |
0.05 |
263 |
961 |
226 |
3,441 | |
Korea |
3,187 |
567 |
2.64 |
1,827 |
4,398 |
105,027 |
35,088 | |
Malaysia |
299 |
58 |
0.69 |
27 |
1,370 |
– |
– | |
Mexico |
268 |
96 |
0.40 |
70 |
111 |
531 |
12,667 | |
Philippines |
48 |
8 |
0 |
6 |
265 |
157 |
2,539 | |
Russia |
3,319 |
557 |
1.17 |
260 |
1,593 |
22,944 |
7,246 | |
South Africa |
307 |
73 |
0.76 |
45 |
1,071 |
– |
– | |
Thailand |
287 |
208 |
0.26 |
17 |
1,674 |
681 |
4,329 | |
United States |
4,605 |
– |
2.68 |
57,410 |
24,501 |
185,008 |
171,935 | |
Source : World
Development Indicators, 2007, World Bank. |
it is complex and costly. The World Bank uses some key indicators
in order to measure the ease or difficulty of operating a business -starting a
business, hiring and firing workers, registering property, getting credit, protecting
investors and enforcing contracts. When entrepreneurs start a business, the first
obstacle they face is the administrative and legal procedures required to register
the new firm. According to the World Bank’s indicator, in India, entrepreneurs
have to go through 11 steps to launch a business over 35 days on an average, at
a cost of 73.7 per cent of per capita income, compared with the region’s average
of 8 steps, over 33 days on average, at a cost equal to 46.6 per cent of per capita
income (Table 29). Thus, India does not enjoy a favourable business environment
vis-à-vis other EMEs, which calls for policy intervention. Removal
of Infrastructure Bottlenecks India’s weak infrastructure, especially
of export infrastructure in the ports, congestion problems, insufficient bulk
terminals, etc.,
| Table
29: Business Environment of Select Countries | |
as in April 2006 |
| Country |
Starting a business |
Registering Property |
Getting Credit |
Hiring and Firing Workers |
Enforcing Contracts |
| No.
of start up proce- dures |
Time to start a business days |
No. of Proce- dures |
Time Required Days |
Index of borrower and lender rights
0 (less ac- cess) to 10 (more access) |
1000 Adults
Per Borrower |
Rigidity of emp- loyment index
0 (less rigid) to 100 (mo- re rigid) |
No. of proce- dures |
Time Required
Days |
| Public
registry cove- rage |
Private registry cove- rage |
| 1 |
2 |
3 |
4 |
5 |
6 |
7 |
8 |
9 |
10 |
11 | |
Argentina |
15 |
32 |
5 |
44 |
3 |
254 |
1,000 |
41 |
33 |
520 | |
Brazil |
17 |
152 |
14 |
47 |
2 |
92 |
430 |
42 |
42 |
616 | |
China |
13 |
35 |
3 |
32 |
2 |
102 |
0 |
24 |
31 |
292 | |
India |
11 |
35 |
6 |
62 |
5 |
0 |
61 |
41 |
56 |
1,420 |
| Indonesia |
12 |
97 |
7 |
42 |
5 |
84 |
2 |
44 |
34 |
570 | |
Japan |
8 |
23 |
6 |
14 |
6 |
0 |
– |
29 |
20 |
242 | |
Korea |
12 |
22 |
7 |
11 |
6 |
0 |
766 |
34 |
29 |
230 | |
Malaysia |
9 |
30 |
5 |
144 |
8 |
422 |
– |
10 |
31 |
450 | |
Philippines |
11 |
48 |
8 |
33 |
3 |
0 |
48 |
39 |
25 |
600 | |
Russia |
7 |
28 |
6 |
52 |
3 |
0 |
0 |
44 |
31 |
178 | |
South Africa |
9 |
35 |
6 |
23 |
5 |
0 |
530 |
41 |
26 |
600 | |
Thailand |
8 |
33 |
2 |
2 |
5 |
0 |
217 |
18 |
26 |
425 | |
Source : World
Development Indicators, 2007, World Bank. |
needs to be improved/rationalised. High cost of power with
restricted and unreliable supply affects the industrial performance. Space is
a major constraint in big cities. Therefore, more industrial estates in the rural
and semi-urban areas with required basic infrastructure facilities are the need
of the hour. Transport infrastructure - highways, railways, ports and waterways,
airports and air traffic control systems - and the services that flow from them
also determines the efficiency in the movement of goods and services in the economy.
The higher efficiency reduces the transportation cost, thereby giving a competitive
edge to the economy. Railway sector in India is one of the largest in the world.
Nevertheless, employee productivity of railways in India is very low as compared
to China, Korea, Brazil, Indonesia, etc. Similarly, port container and
air freight traffic is also very less in India as compared to other Asian economies
except Philippines (Table 30). Inadequate transport infrastructure undermines
the competitiveness of Indian economy vis-à-vis its competitors.
New
| Table
30: Comparison of Transport Infrastructure | |
in Select Countries |
| Countries |
Roads |
Railways |
Ports |
Air | | |
Paved roads
(%) |
Goods hauled (million tonne-km) |
Rail Lines total route – km |
Passengers carried (million passenger-
km) | Goods
hauled (million tonne-km) |
Container traffic (000’ TEU) |
Air freight (millions tonne-km) |
| |
2000-04a |
2000-04a |
2000-05a |
2000-05a |
2000-05a |
2005 |
2005 | |
1 |
2 |
3 |
4 |
5 |
6 |
7 |
8 | |
Brazil |
5.5 |
– |
29,314 |
- |
221,600 |
5,598 |
1,531 | |
China |
81.0 |
784,090 |
62,200 |
583,320 |
1,934,612 |
88,549 |
7,579 | |
India |
474.0 |
– |
63,460 |
575,702 |
407,398 |
4,938 |
773 |
| Indonesia |
58.0 |
– |
– |
25,535 |
4,698 |
5,503 |
440 | |
Japan |
77.7 |
327,632 |
20,052 |
145,957 |
22,632 |
16,777 |
8,549 | |
Korea |
86.8 |
518 |
3,392 |
31,004 |
10,108 |
15,113 |
7,433 | |
Malaysia |
81.3 |
– |
1,667 |
1,181 |
1,178 |
12,027 |
2,578 | |
Mexico |
49.5 |
199,800 |
26,662 |
74 |
2,145 |
390 |
– | |
Philippines |
21.6 |
– |
– |
– |
– |
3,634 |
323 | |
Russia |
– |
5,702 |
85,542 |
164,262 |
1,801,601 |
1,803 |
1,541 | |
Singapore |
– |
100 |
– |
– |
– |
23,192 |
7,571 | |
South Africa |
17.3 |
– |
20,247 |
991 |
108,513 |
2,868 |
923 | |
Thailand |
98.5 |
– |
4,044 |
9,195 |
4,037 |
5,115 |
2,002 | |
Note : a
: Data are for the latest year available in the period shown.
Source
: World Development Indicators, 2007, World Bank. |
initiatives for encouraging
entry of more private sector participation and public-private partnership (PPP)
in important sectors like electricity distribution, aviation, roads, railways,
ports and airports should be explored. The experience in
privatising the PSUs in the infrastructure sector has been very encouraging. Privatisation
will not only enhance efficiencies and bring down costs, but also generate more
earnings, in addition to the annual revenue streams for Government. Encouragement
for more PPP in infrastructure development would improve the infrastructure in
the country, which would in turn increase the export competitiveness. Legal
and Regulatory Environment Multiplicity of laws and
frequent amendments restrict and create impediments in the way of growth and necessitates
a need for unified laws to lessen the grey areas in the policy environment. Procedural
hurdles need to be liberalised. Furthermore, complicated taxation laws and procedures
come in the way of consolidating/ restructuring the industrial units due to the
concessions that hitherto availed by them. Adoption of uniform tax laws could
facilitate fair competition and growth. The Government’s endeavour to reduce the
central sales tax rate in recent time is an effort in the right direction. There
is a need to address the policy and institutional barriers, which impede growth
in manufacturing. Furthermore, myriad laws and regulations that govern the manufacturing
sector need to be pruned down and replaced with simplistic laws. Liberalisation
of Labour Laws The economic reforms that started
in the 1990s have left the labour market untouched, which has led to various problems
such as lower productivity, inefficient allocation of resources, etc. Rigid
labour laws have resulted in underinvestment in some industries such as textile
industry. India’s inflexible labour law is not market driven; thus, the problem
of unskilled labour and its low standard reduces the competitiveness of the country.
Simplification of laws relating to retrenchment, and replacement of non-performing
workers at a time when the unit is in trouble could enable the reorganisation/
consolidation in the industry. So, it becomes important that labour reforms be
carried out in order to accelerate investment, enhance productivity, competitiveness
and employment generation in the economy. SME Sector related Issues Historically,
India has had a highly fragmented industrial structure. The manufacturing sector
in India is characterised by a significant number of small scale and unregistered
manufacturing firms. The Small and Medium Enterprises (SMEs) sector in the Indian
economy has been a very vital organ and it has a share of over 40.0 per cent of
the gross industrial value added in the economy. About 44 per cent of the country’s
exports directly or indirectly pertain to this sector. Given its contribution
in the export basket of the country, improvement of competitiveness of the manufacturing
sector is not possible without paying adequate attention to the SMEs. Small Scale
enterprises in India have received significant preferential treatment – both in
terms of specific sectors being reserved exclusively for them and in terms of
preferential excise and other fiscal concessions. Since the preferential treatment
is contingent on these units remaining small, there is no incentive for these
units to expand eroding the competitiveness of Indian manufacturing. This has
prevented India’s market size from being translated into scale for manufacturing.
Industry – research institute interaction is low in India, thereby reducing the
chances of creation of commercially viable technologies. India’s
huge potential lies in the SMEs to expand employment opportunities, further develop
the industry and boost the exports. But, there is no broad-based market information
network to coordinate and develop the SME sector. There is an urgent need to develop
more industrial clusters to facilitate better information network among the SMEs.
Unavailability of information on the reliability of potential buyers and sellers
tends to increase transaction costs. There is significant scope for improving
productivity levels in different manufacturing industries through cluster approach.
On the lines of identified SSI clusters, clusters may also be identified for other
manufacturing sector with improved infrastructure facilities that may improve
the competitiveness of the industries. At present, about
114 commodities are reserved for exclusive manufacturing by the SSI sector. Production
of some of these items requires modernisation and technology upgradation to achieve
economies of scale and de-reservation alone would help enhance competitiveness
of these products. Removal of all restrictions on investment in labor-intensive
small-scale industries needs to be done. The control has led to various sets of
inefficiency in these industrial sectors. There is a need for improving appropriate
linkages with education, infrastructure, human and natural resources and environment
for long-term sustainable development and facilitating value-addition and self-reliance
approach towards manufacturing. Sector Specific Issues Lack
of strong patent protection is a deterrent to attract sizeable investment in R&D,
foreign direct investment (FDI) and introduction of newer and better products
in the drugs and pharmaceuticals industry. Deferred or delayed payments, non-availability
of power, and lack of orders/demands are problems plaguing most of the sugar industry,
which needs to be addressed urgently. High tariff barrier coupled with stringent
sanitary and phyto-sanitary measures, including animal health and residues of
contaminants by the export destination countries like Europe and the US affected
the domestic production and export competitiveness of the India’s milk products. India’s
low quality and low technology intensity of exports are more vulnerable in the
competitive environment, which needs to be improved with quality products and
the share of high technology intensity exports to be increased. Basic infrastructure,
particularly transport infrastructure is vital for any products to compete in
the market, which needs to be improved to attain cost competitiveness. Business
environment also needs improvement by eliminating procedural hurdles to attract
more investment in the manufacturing sector, particularly FDI. Section
VI Concluding Observations As seen earlier, the competitiveness
of the Indian economy has been improving on the whole, so has the competitiveness
of manufacturing sector. Sharp rise in the share of manufacturing exports in GDP
since the 1990s bears testimony to this. India’s manufacturing sector is becoming
increasingly integrated with the global economy as we found that the world GDP
was positively affecting India’s manufacturing exports. India is found to be one
of the leading producers and exporters in respect of various commodities as also
the country enjoys significant advantages in terms of lower labour costs as compared
to other EMEs. However, our analysis brings out that India’s performance
in the manufacturing sector is not so impressive as that of other comparable EMEs.
This could largely be attributable to lesser export-orientation coupled with low
technology exports of Indian manufacturing sector. Given the urgent need to improve
competitiveness, one cannot refrain from being prescriptive. It is found that
India is concentrating largely on exporting processed goods such as gems and jewellery
and petroleum products, which have high import content. This is reflected in sharp
increase in the share of petroleum products in India’s exports during the recent
years, which has increased nearly ten fold from 1.4 per cent in 1995-96 to 14.8
per cent in 2006-07. On the contrary, the share of traditional export items such
as leather, textiles, etc., has declined over the years. Aganist this backdrop,
there is an urgent need for further diversifying India’s export basket towards
high value goods such as office and telecom equipments, high technology goods,
etc., to improve India’s competitiveness. Furthermore, India needs
to rationalise the tariff and non-tariff barriers in order to sharpen its competitive
strength. Ultimately, the issues relating to poor export quality, infrastructural
bottlenecks, lower efforts at research and development that have taken a toll
on the country’s competitiveness should be addressed from a holistic perspective.
There should be widespread awareness and concerted efforts among the constituents
of the manufacturing sector and decision making layers about the need to achieve
sustained increase in Indian manufacturing sector’s competitiveness, which is
not a discreet event but a continuous saga. Notes: 1 China
is not included due to non-availability of information.
2 It is the simple
average of the share of manufactured exports in total exports and the share of
medium and high-technology (MHT) products in manufactured exports. Select
References Asian Development Bank (2003), ADB India Economic Bulletin
Vol.I, No. 4, December, Asian Development Bank, Indian Resident Mission, New Delhi. —
(2003), ADB India Economic Bulletin Vol.II, No. 3, December, Asian Development
Bank, Indian Resident Mission, New Delhi. — (2004), Asian Development
Outlook, Manila, Philippines: Asian Development Bank. Banga,
Rashmi and Bishwanath Goldar (2004), Contribution of Services to Output Growth
and Productivity in Indian Manufacturing: Pre and Post Reforms, Working Paper
139, Indian Council for Research on International Economic Relations, New Delhi,
July. Bhattacharjee, Aditya (2004), Trade and Competition Policy,
Working Paper No. 146, ICRIER, New Delhi, November. CII-Word
Bank (2002), Competitiveness of Indian Manufacturing: Results from a Firm-Level
Survey, Omkar Goswami, A.K. Arun, Srivastava Gantakolla, Vishal More, Arindam
Mookherjee, Confederation of Indian Industry (CII) and David Dollar, Taye Mengistae,
Mary Hallward-Driemier, Giuseppe Iarossi, The World Bank (WB), January. Cook,
Paul; Colin Kirkpatrick; Martin Minogue and David Parker (Ed. 2004), Leading
Issues in Competition, Regulation and Development, Edward Elgar Publishing
Limited, Cheltenham, UK. Dominic Wilson and Roopa Purushothaman (2003),
Dreaming with BRICs: The Path to 2050, Global Economics Paper No: 99, Goldman
Sachs, October. Federation of Indian Chambers of Commerce & Industry
(2005), Manufacturing Sector In India: Competitiveness and other Issues,
January. Felipe, Jesus and Grace C. Sipin (2004), Competitiveness,
Income Distribution, and Growth in the Philippines: What Does the Long-run Evidence
Show? ERD Working Paper No. 53, Asian Development Bank, Manila, Philippines,
June. Goldar, Bishwanath and Suresh Chand Aggarwal (2004),
Trade Liberalisation and Price-Cost Margin in Indian Industries, Working
Paper No. 130, Indian Council for Research on International Economic Relations,
New Delhi. Golder, Bishwanath (2004), Productivity Trends
in Indian Manufacturing in the Pre-and Post-Reform Periods, Working Paper
No. 137, ICRIER, New Delhi, June. Heng, Toh Mun and Tan Kong Yam (1998),
Competitiveness of the Singapore Economy: A Strategic Perspective, Singapore
University Press, Singapore. Hooper, Peter & Larin,
Kathryn A. (1989), International Comparisons of Labor Costs in Manufacturing,
Review of Income and Wealth, Blackwell Publishing, Vol. 35(4). International
Institute for Management Development, World Competitiveness Yearbook, Various
issues, Lausanne, Switzerland. Joshi, V. and I.M.D. Little
(1994), India: Macroeconomics and Political Economy 1964-1991, Washington,
DC: The World Bank and Oxford University Press. Kumar, Nagesh
(2001), India’s Trade in 2020: A Mapping of Relevant Factors, A paper prepared
for the Committee on Vision 2020 for India, Planning Commission, Government of
India, Research and Information System for the Non-aligned and Other Developing
Countries, New Delhi, May. Lall, Sanjaya (1999), India’s Manufactured
Exports: Comparative Structure and Prospects, World Development 27(10): 1769-86. Mahadeva,
Renuka (2002), New Currents in Productivity Analysis: Where To Now? Productivity
Series 31, Asian Productivity Organisation, Tokyo, Japan Mathur, Archana
S. and Arvinder S. Sachdeva (2005), Custom Tariff Structure in India, February
5, 2005, Economic and Political Weekly. OECD (2001), OECD
Productivity Manual: A Guide to the Measurement of Industry-level and Aggregate
Productivity Growth, Statistics Directorate, Directorate for Science, Technology
and Industry, Paris. OECD. Panchamukhi, V.R. (2000), World Trade Organisation
and India: Challenges and Perspectives, RIS Discussion Paper # 01/2000. Singh,
Ajit (2004), Multilateral Competition Policy and Economic Development: A Developing
Country Perspective on the European Community Proposals, UNCTAD Series on
Issues in Competition Law and Policy, New York And Geneva: The United Nations. Srinivasan,
T.N. (1998), India’s Export Performance – A Comparative Analysis in Ahluwalia,
I.J. and I.M.D. Little (Eds.) India’s Economic Reforms and Development: Essays
for Manmohan Singh, New Delhi, Oxford University Press. Suresh,
M. Padma, (2004), Strategic Approach to Strengthening the International Competitiveness
in Knowledge Based Industries: Non-electrical Machinery Industry, RIS Discussion
Paper # 81/2004, September. UNCTAD (2004), Handbook of Statistics 2004,
New York And Geneva: The United Nations. — (2004a), Trade and Development
Report, 2004, New York And Geneva: The United Nations. UNIDO (2004),
Industrial Development Report 2004, Vienna, Austria: The United Nations
Industrial Development Organisation. — (2004a), UNIDO Annual Report 2004,
Vienna, Austria: The United Nations Industrial Development Organisation. Virmani,
Arvind (2004), Sources of India’s Economic Growth: Trends in Total Factor Productivity,
Working Paper 131, Indian Council for Research on International Economic Relations,
New Delhi, July. Viswanadham, Prof. N. and Dr. Roshan Gaonkar
(2003), Leveraging Logistics to Enhance Indian Economic Competitiveness,
CII Logistics 2003 Theme Paper, The Logistics Institute – Asia Pacific, Singapore. Wilson,
Dominic and Roopa Purushothaman (2003), Dreaming With BRIC: The Path to 2050,
Global Economics Paper No: 99, October 2003, Goldman Sachs. World Bank
(2005), Global Economic Prospects: Trade, Regionalism, and Development,
Washington, DC: The World Bank. — (2004), India: Investment
Climate Assessment 2004 - Improving Manufacturing Competitiveness, Finance
and Private Sector Development Unit, South Asia Region: The World Bank, November. World
Economic Forum, Global Competitiveness Report, various issues, WTO
(2005), International Trade Statistics 2005, Geneva: World Trade Organisation. Yap,
Josef T. (2004), A Note on the Competitiveness Debate, Discussion Paper
Series No. 2004-39, Philippine Institute for Development Studies.
*
L. Lakshmanan, Assistant Adviser; S. Chinngaihlian, Research Officer and Raj Rajesh,
Research Officer are in the Department of Economic Analysis and Policy of the
Reserve Bank of India. The authors are extremely thankful to Shri K.U.B. Rao,
Adviser for his encouragement and valuable suggestions. The authors are also thankful
to an anonymous referee for comments on the earlier draft. The authors are also
thankful to Shri A.B. Umaria and Smt. S.S.Walavalkar, Sr. Assistants, for providing
the necessary data assistance. The views expressed are of the authors' own and
the usual disclaimer applies. |