Content Movement
of Reserves 1.
Introduction
2. Review of Growth of Reserves
since 1991
3. Sources of Accretion to Reserves
in the Recent Period
4. External Liabilities
vis-à-vis Foreign Exchange Reserves
5.
Prepayment of External Debt
6. Financial Transaction
Plan (FTP) of IMF
7. Adequacy of Reserves
8. Investment Pattern and Earnings from Foreign Exchange
Reserves Foreign
Exchange Reserves The
Reserve Bank of India (RBI) undertook a review of the main policy and operational
matters relating to management of the reserves, including transparency and disclosure
and decided to compile and make public half-yearly reports on management of foreign
exchange reserves for bringing about more transparency and also for enhancing
the level of disclosure in this regard. These reports are being prepared with
reference to positions as of 31st March and 30th September
each year, with a time lag of about 3 months. The first such report with reference
to September 30, 2003 was placed in the public domain on February 3, 2004. This
is the ninth report on foreign exchange reserves with reference to September 30,
2007. The report is a compilation of quantitative information with regard to external
reserves, such as, level of foreign exchange reserves, sources of accretion to
foreign exchange reserves, external liabilities vis-à-vis the foreign exchange
reserves, prepayment of external debt, Financial Transaction Plan (FTP) of IMF,
adequacy of reserves, etc. To avoid repetition, Sections II and III of the first
report, dealing with various matters relating to the qualitative aspects of management
of forex reserves and cross-country comparison of disclosure in respect of management
of external reserves, respectively, do not figure in this report. Interested readers
may refer to March 2004 issue of RBI Bulletin or visit RBI website (www.rbi.org.in)
for accessing the first report on foreign exchange reserves.
Movement of Reserves 1.
Introduction The
level of foreign exchange reserves had steadily increased from US$ 5.8 billion
as at end-March 1991 to US$ 151.6 billion by end-March 2006 and further to US$
199.2 billion by end-March 2007. It stood at US$ 247.8 billion as at end-September
2007 (Table 1). Although both US dollar and Euro are
intervention currencies, the foreign exchange reserves are denominated and expressed
in US dollar only.
| |
(US
$ million) | |
Date |
FCA |
SDR |
GOLD |
RTP |
Forex Reserves |
| 31-Mar-06 |
145,108 |
3 (2.0) |
5,755 |
756 |
151,622 | |
30-Sep-06 |
158,340 |
1 (0.9) |
6,202 |
762 |
165,305 | |
31-Mar-07 |
191,924 |
2 (1.0) |
6,784 |
469 |
199,179 | |
30-Sep-07 |
239,954 |
2 (1.0) |
7,367 |
438 |
247761 |
Note: 1. FCA (Foreign Currency Assets): FCA is maintained as a multicurrency
portfolio, comprising major currencies,
such as, US dollar, Euro, Pound sterling,
Japanese yen, etc. and is valued in US dollars.
2. SDR (Special Drawing Rights):
Values in SDR have been indicated in parentheses.
3. Gold: Physical stock
has remained unchanged at approximately 357 tonnes.
4. RTP refers to the Reserve
Tranche Position in IMF.
2.
Review of Growth of Reserves since 1991 India’s
foreign exchange reserves have grown significantly since 1991. The reserves, which
stood at US$ 5.8 billion at end-March 1991 increased gradually to US$ 25.2 billion
by end-March 1995. The growth continued in the second half of the 1990s, with
the reserves touching the level of US$ 38.0 billion by end-March 2000. Subsequently,
the reserves rose to US$ 113.0 billion by end-March 2004, US$ 141.5 billion by
end-March 2005, US $ 151.6 billion by end March 2006, US$ 199.2 billion by end-March
2007 and further to US$ 247.8 billion by end-September 2007 (Chart
1). It may be mentioned that foreign exchange reserve data prior to 2002-03
do not include the Reserve Tranche Position (RTP) in IMF. 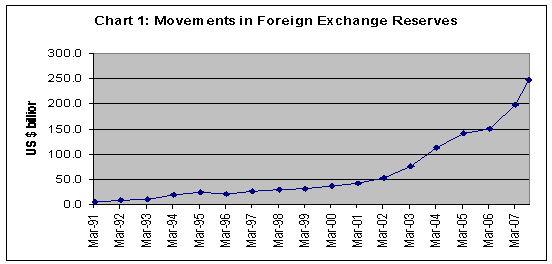
3.
Sources of Accretion to the Reserves Table
2 details the major sources of accretion to foreign exchange seserves
during the period from March 1991 to September 2007.
Table
2: Sources of Accretion to Foreign Exchange Reserves since 1991 | (US$
billion) | |
Items |
1991-92 to 2007-08
(up to
end September 2007) | |
A | |
Reserve Outstanding as on end-March
1991 | 5.8 |
| B.I. | |
Current Account Balance |
-45.7 | |
B.II. | |
Capital Account (net) (a to e) |
264.1 |
|
a. |
Foreign Investment of
which: (i) FDI (ii)
FII |
129.8 47.6
61.8 | |
b. |
NRI Deposits |
29.5 | |
c. |
External Assistance |
14.6 | |
d. |
External Commercial Borrowings |
48.0 | |
e. |
Other items in Capital Account |
42.2 | |
B.III. | |
Valuation Change |
23.5 | | |
Total (A+BI+BII+BIII) |
247.7 |
Table 3
provides details of accretion during April 2007 to September 2007 and the corresponding
period of the previous year. The increase in foreign exchange reserves has been
on account of capital and other inflows. Major sources of increase in foreign
exchange reserves for the year 2006-07 have been: (a) foreign investment (b) External
Commercial Borrowings and (c) short-term credit.
Table
3: Sources of Accretion to Foreign Exchange Reserves | (US
$ billion) | |
Items |
April-September
2007 |
April-September
2006 |
| I. | |
Current Account Balance |
-10.7 |
-10.3 | |
II. | |
Capital Account (net) (a to f) |
51.1 |
18.9 | | |
a. |
Foreign Investment |
22.2 |
6.1 | | |
b. |
Banking Capital |
5.3 |
3.3 | | |
Of which: NRI Deposits |
-0.1 |
2.2 | | |
c. |
Short Term Credit |
5.7 |
3.9 | | |
d. |
External Assistance |
0.7 |
0.4 | |
e. |
External Commercial Borrowings |
10.6 |
5.7 | | |
f. |
Other items in Capital Account* |
6.6 |
-0.5 | |
III. | |
Valuation Change |
8.2 |
5.1 | | | |
Total (I+II+III) |
48.6 |
13.7 |
An
analysis of the sources of reserves accretion during the entire reform period
from 1991 onwards reveals that the increase in foreign exchange reserves has been
facilitated by an increase in the annual quantum of net foreign direct investment
(FDI) from US $ 129 million in 1991-92 to US$ 8.5 billion in 2006-07. During April-September
2007, net FDI amounted to US$ 3.9 billion. FII investments in the Indian capital
market, which commenced in January 1993, have shown significant increase over
the subsequent years. Cumulative net FII investments increased from US$ 1 million
at end-March 1993 to US$ 46.3 billion at end-March 2007 and further to US$ 61.8
billion as at end-September 2007, showing a net accretion of US $ 15.5 billion
during the half year. Outstanding NRI deposits increased from US$ 14.0 billion
at end-March 1991 to US$ 41.2 billion as at end-March 2007. As at end-September
2007, the outstanding NRI deposit stood at US$ 43.7 billion. Turning to the current
account, India’s exports, which were US$ 18.3 billion during 1991-92 increased
to US$ 128.1 billion in 2006-07. During 2007-08 (April-September), India’s exports
amounted to US $ 73.7 billion. India’s imports which were US $ 24.1 billion in
1991-92 increased to US $ 191.3 billion in 2006-07. During 2007-08 (April-September),
India’s imports amounted to US $ 116.1 billion. Invisibles, in particular, private
remittances have also contributed significantly to the current account. Net invisibles
inflows, comprising mainly of private transfer remittances and services increased
from US$ 1.6 billion in 1991-92 to US$ 53.4 billion in 2006-07. During April-September
2007, net invisibles were of the order of US$ 31.7 billion. India’s current account
balance which was in deficit at 3.1 per cent of GDP in 1990-91 turned into a surplus
of 0.7 per cent in 2001-02 and further a surplus of 1.3 per cent in 2002-03. A
surplus of US $ 14.1 billion was posted in the current account during the financial
year 2003-04, driven mainly by the surplus in the invisibles account. However,
this was not sustained during 2004-05, with the current account posting a deficit
of US$ 2.5 billion, driven mainly by the surge in oil prices in the international
market. During 2005-06, current account deficit widened further and was of the
order of US$ 9.9 billion, accounting for 1.1 per cent of GDP, driven mainly by
strong import demand, both oil and non-oil. During 2006-07, the current account
deficit amounted to US $ 9.8 billion, constituting 1.1 per cent of GDP. During
April-September 2007, current account deficit amounted to US $ 10.7 billion. 4.
External Liabilities vis-à-vis Foreign Exchange Reserves The
accretion of foreign exchange reserves needs to be seen in the light of total
external liabilities of the country. India’s International Investment Position
(IIP), which is a summary record of the stock of country’s external financial
assets and liabilities, is available as of end June 2007 (Table
4).
Table
4: International Investment Position of India | (US
$ billion) | |
Item |
June 2007 P |
| A |
Assets | |
| 1. |
Direct investment abroad |
29.39 | |
2. |
Portfolio investment |
0.79 | |
3. |
Other investments |
16.20 | |
4. |
Foreign Exchange Reserves |
213.35 | | |
Total Foreign Assets |
259.73 | |
B |
Liabilities | |
| 1. |
Direct investment in India |
82.98 | |
2. |
Portfolio investment |
93.46 | |
3. |
Other investments |
145.74 | | |
Total Foreign Liabilities |
322.18 | | |
Net Foreign Liabilities (B-A) |
62.45 | |
P: Provisional
Source: Official
website of Reserve Bank of India (www.rbi.org.in) |
5.
Prepayment of External Debt The
significant increase in forex reserves enabled prepayment of certain high-cost
foreign currency loans of the Government of India from the Asian Development Bank
(ADB) and the World Bank (IBRD) amounting to US$ 3.03 billion during February
2003. During 2003-04, prepayment of certain high cost loans to IBRD and ADB amounting
to US$ 2.6 billion was carried out by the Government. Additionally, prepayment
of bilateral loans amounting to US$ 1.1 million was also made. Thus, the total
quantum of prepayments was of the order of US$ 3.7 billion during 2003-04. During
2004-05, prepayment of bilateral loan to the tune of US$ 30.3 million was made.
During 2005-06, no prepayment of high-cost multilateral/bilateral loan was carried
out. During 2006-07, there was only one prepayment of US$ 58.7 million in the
month of April 2006.
6. Financial Transaction Plan (FTP) of IMF International
Monetary Fund (IMF) designated India as a creditor under its Financial Transaction
Plan (FTP) in February 2003, in terms of which India participated in the IMF’s
financial support to Burundi in March-May 2003, with a contribution of SDR 5 million
and to Brazil in June-September 2003 with SDR 350 million. In December 2003, SDR
43 million was made available to Indonesia under FTP. During 2004-05, SDR 61 million
was made available under FTP to countries like Uruguay, Haiti, Dominican Republic
and Sri Lanka. During May-June 2005, SDR 34 million was made available to Turkey
and Uruguay. Thus, the total quantum of India’s contribution under FTP by way
of purchase was SDR 493 million at end-June 2005. There were no purchase transactions
after June 2005. India was included in repurchase transactions of the FTP since
November 2005. There have been 13 repurchase transactions during the period from
November 2005 to November 2007 totaling SDR 709 million received from 6 countries,
viz., Turkey, Algeria, Brazil, Indonesia, Uruguay and Ukraine. 7.
Adequacy of Reserves Adequacy
of reserves has emerged as an important parameter in gauging its ability to absorb
external shocks. With the changing profile of capital flows, the traditional approach
of assessing reserve adequacy in terms of import cover has been broadened to include
a number of parameters which take into account the size, composition and risk
profiles of various types of capital flows as well as the types of external shocks
to which the economy is vulnerable. The High Level Committee on Balance of Payments,
which was chaired by Dr. C. Rangarajan, erstwhile Governor of Reserve Bank of
India, had suggested that, while determining the adequacy of reserves, due attention
should be paid to payment obligations, in addition to the traditional measure
of import cover of 3 to 4 months. In 1997, the Report of Committee on Capital
Account Convertibility under the chairmanship of Shri S.S.Tarapore suggested alternative
measures of adequacy of reserves which, in addition to trade- based indicators,
also included money-based and debt-based indicators. Similar views have been held
by the Committee on Fuller Capital Account Convertibility (Chairman: Shri S.S.Tarapore,
July 2006). In
the recent period, assessment of reserve adequacy has been influenced by the introduction
of new measures. One such measure requires that the usable foreign exchange reserves
should exceed scheduled amortisation of foreign currency debts (assuming no rollovers)
during the following year. The other one is based on a 'Liquidity at Risk' rule
that takes into account the foreseeable risks that a country could face. This
approach requires that a country's foreign exchange liquidity position could be
calculated under a range of possible outcomes for relevant financial variables,
such as, exchange rates, commodity prices, credit spreads etc. Reserve Bank of
India has been undertaking exercises based on intuition and risk models to estimate
'Liquidity at Risk (LAR)' of the reserves. The
traditional trade-based indicator of reserve adequacy, viz, import cover of reserves,
which fell to a low of 3 weeks of imports at end-December 1990, rose to 11.5 months
of imports at end-March 2002 and increased further to 14.2 months of imports or
about five years of debt servicing at end-March 2003. At end-March 2004, the import
cover of reserves was 16.9 months, which came down to 14.3 months as at end-March
2005 and further to 11.6 months as at end-March 2006. The import cover for reserves
was 12.5 months at end-March 2007 and 14 months as at end September 2007. The
ratio of short-term debt (redefined from 2005-06 by including suppliers’ credit
up to 180 days) to the foreign exchange reserves declined from 146.5 per cent
at end-March 1991 to 12.5 per cent as at end-March 2005, but increased slightly
to 12.9 per cent as at end-March 2006 and further to 13.2 per cent at end-March
�2007, but declined to 12.4 per cent at end September 2007. The ratio of volatile
capital flows (defined to include cumulative portfolio inflows and short-term
debt) to the reserves declined from 146.6 per cent as at end-March 1991 to 45.4
per cent as at end March 2007 and further decreased to 42.7 as at end September
2007. 8.
Investment Pattern and Earnings from Foreign Currency Assets The
foreign currency assets are invested in multi-currency, multi-asset portfolios
as per the existing norms, which are similar to international practices in this
regard. As at end-September, 2007, out of the total foreign currency assets of
US$ 240.0 billion, US$ 67.2 billion was invested in securities, US $ 137.3 billion
was deposited with other central banks, Bank for International Settlements (BIS)
and International Monetary Fund (IMF) and US$ 35.4 billion was in the form of
deposits with foreign commercial banks (Table 5).
Table
5: Deployment Pattern of Foreign Currency Assets | (US
$ Million) | |
As on September 30, 2007 |
As on March 31, 2007 |
| Foreign
Currency Assets | 239,954 |
191,924 | |
(a)Securities |
67,212 |
52,996 | |
(b) Deposits with other central banks, BIS &
IMF | 137,348 |
92,175 | |
(c) Deposits with foreign commercial banks |
35,394 |
46,753 |
During
the year 2006-07 (July-June), the return on foreign currency assets and gold,
after accounting for depreciation, increased to 4.6 per cent from 3.9 per cent
during 2005-06, mainly on account of hardening of global short-term interest rates.
* Other items in capital
account, apart from 'Errors and Omissions', also comprise leads and lags in exports,
funds held abroad, advances received pending issue of shares under FDI and transactions
of capital receipts not included elsewhere. The transactions of these capital
receipts mainly constitute cross border transactions relating to financial derivatives
and hedging (margin payments and settlement), migrant transfers and other capital
transfers (transfers of capital assets by the Indian migrants abroad, investment
grants, payments of compensation), realization of guarantees, etc. |