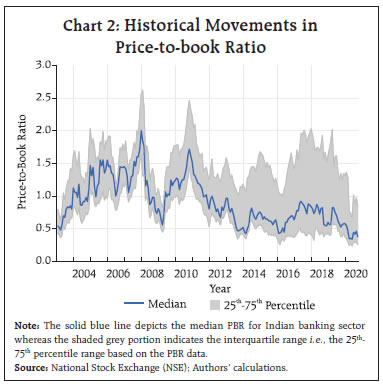
This article is an enquiry into the determinants of price-to-book ratio (PBR) of scheduled commercial banks (SCBs) in India. Our empirical analysis indicates that variations in PBR have linkages with financial and economic cycles. It also captures the ‘franchise value’ of banks and shares a close correlation with indicators relating to profitability and viability of banks. This article, therefore, suggests that PBR may be considered as an alternative measure of bank value. Introduction What is an appropriate measure of bank value? Though there are several indicators spanning various dimensions of banking activities (such as capital adequacy ratios, asset quality measures, Z-scores, profitability and liquidity indicators), none of these comprehensively capture the viability of the underlying business models of banks. This happens primarily because of two reasons: first, while undertaking their principal task of credit intermediation, banks produce valuable private information about borrowers and sectors. For banks, rents or quasi-rents emanating from this activity are an intangible asset (Chousakos & Gorton, 2017). These informational quasi-rents are generally termed as banks’ private “charter value” or “franchise value” (Marcus, 1984). Franchise value may also arise due to barriers to entry or a market structure that limits entry. Second, banks, unlike other firms, are subject to more stringent regulations given their unique role in the financial system. Therefore, many of the standard banking indicators could change owing to shifts in the regulatory environment; they may not necessarily reflect a fundamental change in the health of banks1. Given this context, we argue that the price-to-book ratio (PBR) of banks may be employed to better understand their health, stability and value. PBR is defined as the ratio of market value of equity relative to total book value of a firm. It is similar in spirit to Tobin’s Q – which is defined as market value over replacement cost. A relatively higher (lower) PBR is usually interpreted as the underlying stock being overpriced (underpriced). While this interpretation makes sense for non-financial firms which are relatively less regulated and have greater potential for product differentiation and innovation, the implications of PBR for financial firms are different and perhaps more significant. For banks and other financial institutions, book value of assets may often be closer to market value due to the practice of marking certain classes of assets to market (Bogdanova, Fender & Takáts, 2018). Furthermore, depreciation may play a limited role in accounting of financial assets as compared to physical assets (ibid.). Cross-sectional heterogeneity – measured by product differentiation, cost of funds and regulatory infrastructure – may be limited among banks. Effectively, their PBR may capture how well they maximise the spread2 and how efficient they are in terms of credit risk evaluation and monitoring. In other words, driven by intangibles, the market value of banks over and above their book value may have more to do with their performance as perceived by economic agents based on their efficacy in fund utilisation, asset-liability management and resolution prospects, among others. Additionally, PBR can be construed as reflecting the standards of accounting and financial reporting practices in banks. (Bogdanova, Fender & Takáts, 2018). As banks are exposed to credit and operational risks (such as frauds) leading to potentially large and abrupt losses, the value of their loan portfolio and earnings should be subject to the correct accounting of such losses. In fact, delayed recognition of credit risk and the subsequent understatement of losses have been characteristics of banking troubles in India and in other countries (Huizinga & Laeven, 2012; Vishwanathan, 2018). The theoretical backing to employ a market-based measure to evaluate a bank’s profitability and soundness comes from the efficient market hypothesis which suggests that security prices fully reflect all available information (Fama, 1970). This would imply that the forward-looking information content of a market-based measure - PBR in our case - is likely to be higher as compared to any balance sheet-based measure. From a practitioner’s perspective, the availability of market data at a high frequency and their sensitivity to new information can make PBR of financial institutions a useful metric to assess the performance of the financial sector. Given the bank-centric nature of the Indian financial system, the role of banks’ PBR in such an assessment can hardly be understated. Despite the potential of PBRs in assessing the performance of not just banks but also the financial sector as a whole, it has hardly been studied in the literature with the exception of Ghosh (2009) and Herwadkar & Pratap (2019). In the international context, there exists a large body of literature on banks’ PBR and its interlinkages with bank characteristics (Calomiris & Nissim, 2014; Chousakos & Gorton, 2017; Demsetz, Saidenberg, & Strahan, 1996; and Sarin & Summers, 2016). In this article, therefore, we intend to fill this research gap by evaluating drivers of PBR for banks in India for the period 2002-2017. Our primary objective here is to provide evidence on the desirability of PBR as a measure of bank value. In particular, we examine whether PBR is able to incorporate relevant balance sheet and macro-financial information over and above the intangibles. The rest of the article is organised as follows: Section II provides a bird’s eye view of the existing literature; Section III presents the empirical analysis; and Section IV discusses the conclusions. II. PBR: What does the existing literature say? Earlier studies on the charter value of banks were in the context of deposit insurance and deregulation of banking industry in the US (Marcus, 1984; Keeley 1990; and, Demsetz, Saidenberg and Strahan, 1996). Two main views were considered in this early literature. The first view posited that in the presence of deposit insurance, banks may take excessive risk, thereby ignoring the loss of intangibles in the wake of eventual liquidation. The second view assumed that banks do take into account the value of its intangibles, and thus analysed the interlinkages between charter value and other bank characteristics. Major empirical findings of these papers can be summarised as follows: banks with more market power, as reflected in larger market-to-book ratios, held more capital relative to assets; they had lower default risk as reflected in lower risk premiums on large, uninsured cerfiticates of deposits; and franchise value of banks and their risk taking appeared to be inversely related. A number of papers revisited these questions in the context of the US banking sector following the global financial crisis in 2008, primarily examining (a) the large differentials which arose between the market and book values and (b) the dramatic and persistent decline in the overall market valuation of US banks during the crisis. The literature has ascribed these trends to delayed recognition of stressed assets, distorted financial reporting overstating the value of distressed assets and regulatory capital as well as a decline in the value of intangibles, such as customer relationships, and unrecognised contingent obligations (Huizinga and Laeven, 2012; Calomiris and Nissim, 2014). Another strand in the literature examined whether the major regulatory interventions that were undertaken after the crisis, such as changes in regulatory capital and leverage, and stress testing reduced risk taking by banks. Contrary to the prevailing wisdom at that time, financial market information provided little support for the view that major financial institutions were significantly safer than they were before the crisis. The explanation also pointed towards a dramatic decline in the franchise value of major financial institutions, caused in part by new regulations. This decline in franchise value, it was concluded, made financial institutions more vulnerable to adverse shocks (Sarin and Summers, 2016).3 Most recently, Bogdanova, Fender and Takáts (2018) extended the analytical approach of Calomiris and Nissim (2014) to a multi-country setup and concluded that factors driving bank valuations had not changed signficantly after the global financial crisis. As far as literature relating to India is concerned, studies by Ghosh (2009) and Herwadkar and Pratap (2020) have examined the PBR of banks. Ghosh (2009) explored the interlinkage between the charter value and risk taking by banks. He investigated systemic and institution-specific factors that influenced bank charter values for the period 1996-2006 and found market concentration (both at deposit and loan levels), bank size and operating efficiency to be its major influencing factors. Herwadkar and Pratap (2020) make use of PBR as one of the financial market indicators to test the efficient market hypothesis. More specifically, they tested whether equity markets provide any lead information about banking stress and found that markets are able to price in the stress concurrently but not in advance. Relative to other market-based measures, however, PBR emerged as a better indicator of impending distress, especially for private banks. III. Empirical Analysis Recent and Historical Trends Since the beginning of 2020, domestic and global financial markets were jolted by the spread of COVID-19 pandemic. While Indian equity markets moved cautiously during the first two months, March 2020 saw a steep fall in the equity indices. Chart 1 shows the daily movements in PBR of Nifty Bank Index, Nifty PSU Bank Index and Nifty Private Bank Index highlighting the valuation of the overall Indian banking sector, public sector banks and private sector banks, respectively4. As it was observed, with the rise of COVID-19 cases, market valuation of the banking sector witnessed a sharp deterioration during early March 2020, weeks before the ensuing lockdown of the country. Against the backdrop of countercyclical measures undertaken by the Government and the Reserve Bank of India, subsequent months saw the PBR stabilising and remaining range bound, albeit substantially lower than the valuation at the beginning of the year. Subsequently, the valuation of the overall banking sector, driven mainly by private banks, seems on course of recovery from the pandemic shock. On the other hand, the market value of public sector banks has remained persisently below its pre-pandemic levels5. Given the weak near-term economic outlook for India and the global economy, we juxtapose the current decline in banking sector valuation against similar changes in banks’ PBR observed over the last two decades. Chart 2 shows the overall valuation of the Indian banking sector as measured by the median PBR of Indian SCBs listed on the National Stock Exchange (NSE). The charts also indicates the interquantile range of the PBR distribution for listed Indian banks. The broad observations are as follows. First, a similar but sharper decline in bank valuation was observed during the global financial crisis. Second, after a quick recovery post-crisis, the PBR for the bottom quartile and median group of banks has remained consistenly below one since 2012. This is indicative of the overall health of the banking sector laden with a high proportion of non-performing assets (NPAs)6. Third, the differential between how markets valued the top, median and bottom quartile groups of banks was relatively narrow around the global financial crisis. It has, however, widened since then. As alluded to earlier, changes in price-to-book ratios are able to predict stressed assets, especially in the case of private sector banks (Herwadkar and Pratap, 2020). 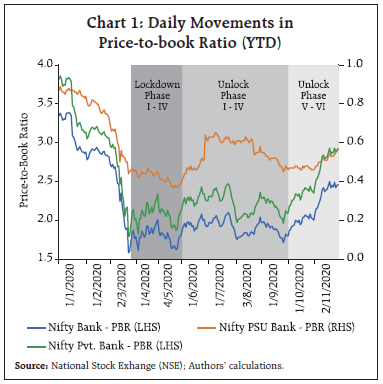
 In order to determine the drivers of PBR of Indian banks, we consider a set of explanatory variables, including bank-level as well as macro-financial indicators (Calomiris and Nissim, 2014; Bogdanova, Fender and Takáts, 2018). It is expected that a bank’s price-to-book value depends positively on net interest margin (NIM) and negatively on the total stressed assets ratio (as a proportion of gross advances), taken as indicators of a bank’s profitability and asset quality, respectively. Further, valuation also depends upon the nature of business activities of a bank and hence we include total interest-bearing deposits and non-interest bearing deposits (both taken as proportion of total assets) as explanatory variables. A larger proportion of interest-bearing deposits would imply higher expenses on account maintainence and incurred interest, and thus negatively impacts a bank’s valuation. On the other hand, it may also augur well for the bank from the point of stable source of funding. Hence, the empirical relationship between deposits and bank valuation may vary across jurisdictions. Generally, banks with higher levels of regulatory capital are considered as financially sound. Thus, we include the total capital-to-risk weighted assets ratio (CRAR) in our model and expect it to positively influence bank valuations. The size of the bank is controlled by total assets. Lastly, we include output gap and the credit-to-GDP gap as business and financial cycle drivers of valuations7. Scatter plots suggest a strong correlation between PBR and the explanatory variables along expected lines (Chart 3). To formally investigate the relationship between price-to-book ratio and its determinants, we employ a fixed effects panel regression framework9. We use the extended model of Bogdanova, Fender and Takáts (2018) as follows: 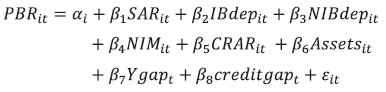 PBR denotes the price-to-book ratio of bank i at time t,αidenotes the time-invariant, bank fixed effects and βi signifies the respective slope coefficients. Our sample consists of 39 listed banks in India active during 2002-201710. The model includes the following as explanatory variables: stressed assets ratio (SAR), interest-bearing deposits ratio (IBdep), non-interest-bearing deposits ratio (NIBdep), net interest margin (NIM), capital-to-risk weighted assets ratio (CRAR), total assets (in natural logarithms), output gap (Ygap) and credit-to-GDP gap (creditgap). The underlying data for our model have been obtained from National Stock Exchange (NSE), Reserve Bank of India and Bank for International Settlements (BIS). We estimate the above model using quarterly data from 2002:Q1 to 2017:Q4. Standard errors are clustered at the bank-level11. Table A1 (Annexure) reports the results from our regression analysis for the full sample of banks. Subsample estimates for public and private sector banks are provided separately. We find that bank profitability tends to boost a bank’s market valuation whereas poor asset quality, i.e., higher stressed assets on a bank’s balance sheet may depress its valuation on average. When compared across subsamples, profitability in case of public banks and asset quality in case of private sector banks emerge as statistically significant drivers of their PBRs. Similarly, while the proportion of interest-bearing deposits does not seem to have any significant impact on valuation, a higher proportion of non-interest-bearing deposits improves market valuation of a bank. While regulatory capital has a positive influence on valuation, in line with theory, the effect is not statistically significant at conventional levels. Given that banks are required to maintain a minimum level of CRAR, this result is not surprising. This suggests that market perception of different banks is similar as long as they maintain the desired level of capital. On the flip side, the relation between PBR and bank capital could also be non-linear which is otherwise not captured by our linear model. A positive output gap is generally indicative of a strong demand for bank credit, which may augur well for banking business. A significant and positive coefficient on output gap in our model corroborates this point. On the other hand, a large and positive credit-to-GDP gap – underlining credit and asset price bubbles – is often found to lead to distress in the banking sector. In line with this argument, credit-to-GDP gap entails a negative coefficient as per our model. However, perhaps due to the dominant presence of public sector banks in the domestic banking sector, credit-to-GDP gap appears to have a statistically significant and negative impact only in case of public sector banks vis-à-vis their private sector counterparts. The estimated model shows a reasonable goodness-of-fit underlining its ability to explain PBR for banks in India. IV. Conclusion The article brings out three findings relating to PBR in the Indian context: first, the variations in PBR has linkages with financial and macroeconomic cycles; second, it captures the charter value of banks; third, PBR shares a strong correlation with various indicators relating to banking sector profitability and viability. As it is available on a real-time basis, unlike the balance sheet data, PBR of banks promises to be a useful metric for policy purposes. This also makes a case for further evaluation of such a measure – that combines book and market-based valuation metrics – in assessing the health of different segments of the financial sector. Following the Covid-19 pandemic, there was a sharp downward trend in PBRs of Indian banks. The fall in market valuation of banks was arrested, and of late, PBR for the banking sector has started to turn around. This underlines the role played by countercyclical policies in restoring the confidence in the economy and in the financial sector, in particular. References Bogdanova, B., Fender, I., & Takáts, E. (2018), The ABCs of bank PBRs. BIS Quarterly Review, pp. 81-95. Calomiris, C. W., & Nissim, D. (2014). Crisis-related shifts in the market valuation. Journal of Financial Intermediation, 400-435. Chousakos, K. T., & Gorton, G. B. (2017, February). http://www.nber.org/papers/w23167. Retrieved from http://www.nber.org/:http://www.nber.org/papers/w23167 Demsetz, R. S., Saidenberg, M. R., & Strahan, P. E. (1996, October). Banks with Something to Lose: The Disciplinary Role of Franchise Value. Economic Policy Review, Federal Reserve Bank of New York. Diamond, D. W. (1984). Financial Intermediation and Delegated Monitoring. The Review of Economic Studies, 393-414. Fama, E. F. (1970). Efficient Capital Markets: A Review of Theory and Empirical Work. The Journal of Finance, 383-417. Ghosh, S. (2009). Charter value and risk-taking: evidence from Indian banks. Journal of the Asia Pacific Economy, 270-286. Gorton, G., & Pennacchi, G. (1990). Financial Intermediaries and Liquidity Creation. The Journal of Finance, 49-71. Herwadkar, S. S., & Pratap, B. (2019). Can financial markets predict banking distress? Evidence from India. Reserve Bank of India Occassional Papers, 65-90. Huizinga, H., & Laeven, L. (2012). Bank valuation and accounting discretion during a financial crisis. Journal of Financial Economics, 614-634. Keeley, M. C. (1990). Deposit Insurance, Risk, and Market Power in Banking. The American Economic Review, 1183-1200. Marcus, A. J. (1984). Deregulation and bank financial policy. Journal of Banking and Finance, 557-565. Sarin, N., & Summers, L. H. (2016, September 15-16). Have big banks gotten safer. Brookings Papers on Economic Activity. Vishwanathan, N. S. (2018, April 18). https://www.rbi.org.in/Scripts/BS_SpeechesView.aspx?Id=1055. Retrieved from https://www.rbi.org.in/: https://rbidocs.rbi.org.in/rdocs/Speeches/PDFs/NIBMS180420186468CF423F80468784A4E51BAD19924F.PDF
Annexure | Table A1: Price-to-book Ratio Analysis - Regression Estimates | | Variables | Full Sample | Public Sector Banks | Private Banks | | Dependent | PBR | PBR | PBR | | Independent | (1) | (2) | (3) | | NIM | 0.12** | 0.031* | 0.18 | | | (0.054) | (0.015) | (0.12) | | SAR | -0.028*** | -0.0063 | -0.043*** | | | (0.0067) | (0.0049) | (0.010) | | IB Deposits | -0.0033 | -0.0072 | -0.0025 | | | (0.0062) | (0.0045) | (0.0085) | | NIB Deposits | 0.066*** | 0.020 | 0.076*** | | | (0.020) | (0.015) | (0.016) | | Total CRAR | 0.020 | 0.013 | 0.0074 | | | (0.018) | (0.014) | (0.024) | | Total Assets | 0.21** | -0.64*** | 0.24** | | | (0.077) | (0.12) | (0.10) | | Output Gap | 0.073*** | 0.056*** | 0.099*** | | | (0.016) | (0.011) | (0.019) | | Credit-to-GDP Gap | -0.0035 | -0.015** | -0.0099 | | | (0.012) | (0.0067) | (0.017) | | Constant | -1.69** | 8.78*** | -1.49 | | | (0.79) | (1.64) | (1.03) | | adj. R2 | 0.904 | 0.712 | 0.886 | | BIC | 1112.3 | -167.9 | 772.1 | | F-Stat. | 18.20 | 25.25 | 72.94 | | Bank FE | Y | Y | Y | | N | 1364 | 792 | 572 | | Standard errors in parentheses; * p < 0.10, ** p < 0.05, *** p < 0.01: Standard errors are clustered at bank-level. |
|