The annual survey on ‘International Trade in Banking Services’ (ITBS) provides dimensions of financial services rendered by overseas branches/subsidiaries of Indian banks and branches of foreign banks operating in India, based on explicit/implicit fee/commission charged to customers. The results of the 2015-16 round of ITBS survey are presented here. It covers the broad changes in branch/ employee/country profile of their banking business as well as service activities (both fund and non-fund based). The major trend in their balance sheet, income, expenditure and profitability are also discussed. Introduction International trade in banking services (ITBS) cover banking services provided to residents of an economy through local presence of (a) foreign banks and (b) foreign affiliates. It takes into account fundbased services (such as, deposit-taking, lending to firms, consumer finance) and a host of so-called non-assetbased services (such as, securities underwriting, local currency bond trading, foreign exchange trading, brokering, custody services, funds transfer and management services and financial consultancy/ advisory services). With increasing presence of both Indian and foreign banks to provide cross-border banking services, it is useful to assess their efficiency and other parameters. Also, the General Agreement on Trade in Services (GATS) under the World Trade Organisation (WTO) inter alia, necessitated the need of consistent and comparable statistics on ITBS for assessing the financial services sector liberalisation. The ITBS survey, conducted annually by the Reserve Bank since 2006-07, is intended to provide information on financial services provided locally through commercial presence [i.e., Mode-3 of supply as per the Manual of Statistics of International Trade in Services (MSITS)] for the banking sector. These cover overseas branches/subsidiaries of Indian banks operating abroad and foreign banks operating in India. As per IMF’s Balance of Payments and International Investment Position Manual: Sixth edition (BPM6), subsidiary is a direct investment enterprise (DIE) over which direct investor is able to exercise control, which is assumed to exist if the investor has more than 50 per cent share in total equity of the enterprise. The 2015-16 survey round covered 201 overseas branches and 249 overseas subsidiaries of Indian Banks and 317 branches of foreign banks operating in India. The salient features along with the recent trends in the international trade in banking services in the last few years are analysed here1. As all scheduled commercial banks with cross-border presence responded to the survey, the results present census position though the data for the latest year remain provisional. I. Branch Distribution Cross-border presence of Indian banks has increased over the years in line with the growing demands from cross-border trade and other activities. The number of Indian banks’ branches operating abroad stood at 201 as on March 2016 (from 163 four years ago), of which, the highest number of branches were located in the United Kingdom (33), followed by Hong Kong (19), Bahrain (18), Singapore (17), United Arab Emirates (13) and Sri Lanka (12). Public sector banks dominated the overseas presence of Indian banks, where State Bank of India had the largest overseas presence (76 branches in 21 countries) followed by Bank of Baroda (47 branches in 14 countries). The Indian banks operating abroad added 23 more overseas branches while foreign banks added 4 more branches in India in 2015-16. The employee strength of Indian banks’ branches operating abroad increased to 3.7 per cent in 2015-16 after a marginal decline in 2014-15 (Table 1). The total number of employees of foreign banks’ branches operating in India increased by 4.4 per cent in 2015-16 as compared to 3.3 per cent in the previous year. Indian banks’ branches operating abroad employed 63.1 per cent of employees from local sources, 33.9 per cent from India and remaining 3.0 per cent from other countries. On the other hand, 99.4 per cent of foreign banks employees working in India were local (Chart 1,Table 2). II. Banking Business The business of Indian banks’ branches operating abroad grew at a slower pace in 2015-16 than in the previous year and their consolidated balance sheet increased by 4.0 per cent as compared with 13.5 per cent witnessed in 2014-15. On the other side, the business of foreign banks’ branches operating in India showed improvement and their consolidated balance sheet increased by 9.0 per cent in 2015-16 on top of 2.8 per cent growth a year ago. Since March 2012, the combined balance sheet of Indian banks’ branches operating abroad recorded 57.5 per cent increase in US dollar terms whereas the combined balance sheet of foreign banks operating in India increased by around 9.0 per cent. The consolidated balance sheet of Indian banks’ subsidiaries operating abroad grew at 20.5 per cent in 2015-16 (1.8 per cent in 2014-15). 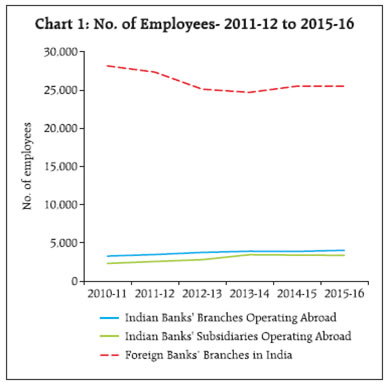
| Table 1: No. of Branches and Employees – 2011-12 to 2015-16 | | Category | 2011-12 | 2012-13 | 2013-14 | 2014-15 | 2015-16 | | | No. of Branches | | Indian Banks’ Branches Operating Abroad | 163 | 170 | 170 | 178 | 201 | | Indian Banks’ Subsidiaries Operating Abroad | 158 | 184 | 235 | 235 | 249 | | Foreign Banks’ Branches in India | 309 | 316 | 307 | 313 | 317 | | | No. of Employees | | Indian Banks’ Branches Operating Abroad | 3,489 | 3,761 | 3,915 | 3,897 | 4,040 | | Indian Banks’ Subsidiaries Operating Abroad | 2,580 | 2,818 | 3,469 | 3,424 | 3,382 | | Foreign Banks’ Branches in India | 27,342 | 25,118 | 24,703 | 25,519 | 26,642 | As lending continued to be a major business of Indian banks’ overseas branches, the share of credit in their total assets stood at 58.4 per cent in March 2016 vis-a-vis 46.2 per cent for foreign banks operating in India. However, foreign banks operating in India financed more operations through deposit mobilisation (56.0 per cent share in balance sheet) compared to Indian banks’ overseas branches (37.1 per cent share). The share of credit and deposit in the relatively small combined balance sheet of overseas subsidiaries of Indian banks stood at 69.5 per cent and 55.4 per cent, respectively (Table 3). | Table 2: Type of Employees – 2014-15 and 2015-16 | | | Indian Banks’ Branches Operating Abroad | Indian Banks’ Subsidiaries Operating Abroad | Foreign Banks’ Branches in India | | 2014-15 | 2015-16 | 2014-15 | 2015-16 | 2014-15 | 2015-16 | | Total number of branches | 178 | 201 | 235 | 249 | 313 | 317 | | Total number of employees | 3,897 | 4,040 | 3,424 | 3,382 | 25,519 | 26,642 | | of which: | | | | | | | | Local | 2,437 | 2,549 | 2,832 | 2,910 | 25,354 | 26,487 | | Indians | 1,322 | 1,368 | 469 | 398 | | Others | 138 | 123 | 123 | 74 | 165 | 155 |
| Table 3: Bank Balance Sheet – 2011-12 to 2015-16 (End-March) | | Category | 2011-12 | 2012-13 | 2013-14 | 2014-15 | 2015-16 | | Indian Banks' Branches Operating Abroad | | Credit to Total Assets (%) | 60.2 | 58.9 | 58.5 | 57.4 | 58.4 | | Deposits to Total Liabilities (%) | 36.5 | 39.5 | 39.0 | 39.0 | 37.1 | | Total Assets/Liabilities (₹ billion) | 7,399.2 | 9,939.8 | 12,791.2 | 14,520.0 | 15,101.7 | | Total Assets/Liabilities (US$ billion)* | 144.6 | 182.8 | 212.8 | 232.0 | 227.7 | | | Indian Banks' Subsidiaries Operating Abroad | | Credit to Total Assets (%) | 64.9 | 66.5 | 67.9 | 70.7 | 69.5 | | Deposits to Total Liabilities (%) | 59.5 | 55.2 | 58.2 | 58.1 | 55.4 | | Total Assets/Liabilities (₹ billion) | 826.4 | 848.3 | 1,050.9 | 1,069.5 | 1,289.0 | | Total Assets/Liabilities (US$ billion)* | 16.2 | 15.6 | 17.5 | 17.1 | 19.4 | | | Foreign Banks’ Branches in India | | Credit to Total Assets (%) | 41.9 | 50.7 | 40.8 | 44.8 | 46.2 | | Deposits to Total Liabilities (%) | 46.9 | 46.7 | 47.8 | 53.7 | 56.0 | | Total Assets/Liabilities (₹ billion) | 5,764.5 | 6,066.5 | 7,290.3 | 7,497.6 | 8,172.7 | | Total Assets/Liabilities (US$ billion)* | 112.7 | 111.5 | 121.3 | 119.8 | 123.2 | | * Using end-March Rupee/Dollar RBI reference rate. | Credit extended by Indian banks’ overseas branches increased by 5.8 per cent in 2015-16 on the top of 11.3 per cent growth during the previous year. Their deposits base however, declined marginally in 2015-16 after recording 13.3 per cent growth in 2014-15. Credit and deposit of overseas subsidiaries of Indian banks recorded high growth of 18.4 and 14.8 per cent, respectively (5.9 and 1.6 per cent a year ago) (Chart 2). III. Income and Expenditure The total income of Indian banks’ branches operating abroad (IB_Br_O) and their subsidiaries (IB_ Sub_O) operating abroad increased in 2015-16, while total income of foreign banks’ branches operating in India (F_Br_I) remained stagnant as compared to the previous year. Total income of Indian banks’ branches operating abroad grew by 4.6 per cent in 2015-16 (8.1 per cent in 2014-15), whereas it increased by 7.3 per cent in 2015-16 (5.2 per cent in 2014-15) for their overseas subsidiaries. Total expenditure of foreign banks’ branches operating in India increased by 1.8 per cent in 2015-16 compared to 9.6 per cent the previous year 2014-15. Foreign banks operating in India had higher share of non-interest income compared to the Indian banks’ branches operating abroad. During 2015- 16, the share of non-interest income in total income was 14.2 per cent for branches of Indian banks’ branches operating abroad and 19.3 per cent for foreign banks operating in India (Chart 3, Table 4). 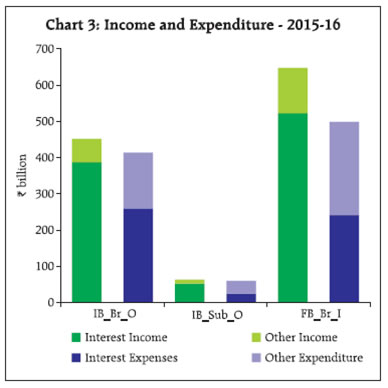
| Table 4: Income and Expenditure– 2011-12 to 2015-16 | | (Amount in ₹ billion) | | | 2011-12 | 2012-13 | 2013-14 | 2014-15 | 2015-16 | | | Indian Banks' Branches Operating Abroad | | Income | 285.3 | 365.6 | 399.8 | 432.3 | 452.0 | | Expenditure | 206.2 | 273.7 | 306.4 | 318.8 | 413.9 | | | Indian Banks' Subsidiaries Operating Abroad | | Income | 42.1 | 48.0 | 56.1 | 59.0 | 63.3 | | Expenditure | 33.9 | 34.3 | 45.8 | 48.4 | 59.8 | | | Foreign Banks’ Branches in India | | Income | 467.3 | 528.4 | 587.2 | 647.7 | 647.4 | | Expenditure | 327.9 | 372.6 | 446.5 | 489.5 | 498.1 | IV. Profitability Profitability across the three bank-groups declined in 2015-16 even though the profitability of foreign banks in India remained substantially higher than the Indian banks’ branches/subsidiaries operating abroad. The profitability ratio (Return on Assets) as well as income-to-asset ratio declined for foreign banks operating in India and Indian banks’ subsidiaries operating abroad. In case of Indian banks’ branches operating abroad, the income to assets ratio remained around the previous years’ level but return on assets declined to 0.2 per cent in 2015-16 from 0.7 per cent in the previous year (Charts 4A & 4B). Country-wise return on asset (ROA) indicate that, during 2015-16, Indian banks’ branches operating in Maldives recorded the highest return on assets (5.0 per cent) followed by banks in Bangladesh (3.5 per cent). In countries with larger number of branches, the ratio was lower at 0.5 per cent for Bahrain, 0.3 per cent for Hong Kong, 0.2 per cent for UK and 0.1 per cent for Singapore (Chart 5). V. Activity-wise Trade in Banking Services Information on trade in banking services was collected based on explicit and implicit fees or commission charged to the customers for various banking services rendered. For this purpose, detailed data were collected on the financial services provided by them, which were classified into eleven major groups as per the MSITS. During 2015-16, Indian banks’ branches operating abroad generated more fee income by rendering banking services, mainly due to higher focus on ‘Credit related services’, ‘Derivative, stock, securities, Foreign exchange trading services’ and ‘Trade finance related services’. On the other hand, the fee income generated by their overseas subsidiaries were mainly due to ‘Credit related services’, ‘Fund Management Services’ and ‘Payment and money transmission services’. Foreign banks operating in India received major part of their fee income from ‘Payment and money transmission services’, ‘Derivative, stock, securities, Foreign exchange trading services’, ‘Trade finance related services’ and ‘Credit related services’ (Table 5 and 6). 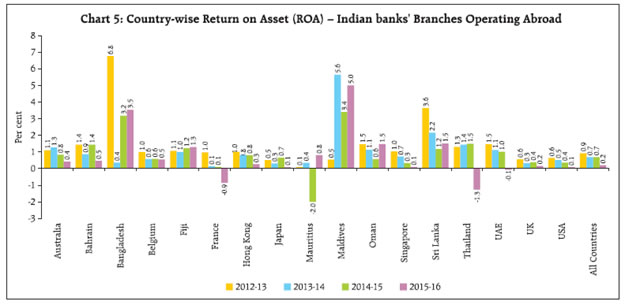
| Table 5: Activity-wise Composition of Banking Services delivered by Indian banks’ branches and Subsidiaries operating abroad | | (Amount in ₹ billion) | | Banking Service | Indian Banks’ Branches Operating Abroad | Indian Banks’ Subsidiaries Operating Abroad | | 2011-12 | 2012-13 | 2013-14 | 2014-15 | 2015-16 | 2011-12 | 2012-13 | 2013-14 | 2014-15 | 2015-16 | | Deposit Account Management Services | 1.8 | 7.8 | 1.2 | 1.1 | 1.2 | 0.2 | 0.2 | 4.1 | 0.2 | 0.9 | | Credit Related Services | 25.6 | 40.5 | 24.9 | 26.6 | 26.2 | 1.4 | 1.4 | 3.7 | 2.5 | 2.3 | | Financial Leasing Services | 0.0 | 0.0 | 0.0 | 0.0 | 0.0 | 0.0 | 0.0 | 0.0 | 0.0 | 0.0 | | Trade Finance Related Services | 18.2 | 34.4 | 14.3 | 15.1 | 13.7 | 0.5 | 0.5 | 5.0 | 5.2 | 0.6 | | Payment and Money Transmission Services | 10.1 | 5.3 | 2.8 | 3.4 | 3.3 | 0.4 | 0.4 | 0.6 | 1.2 | 1.3 | | Fund Management Services | 0.0 | 0.0 | 0.0 | 0.0 | 0.0 | 0.3 | 0.0 | 0.7 | 1.0 | 1.6 | | Financial Consultancy and Advisory Services | 0.3 | 0.1 | 1.1 | 1.2 | 0.7 | 0.2 | 0.5 | 0.9 | 0.8 | 0.9 | | Underwriting Services | 0.0 | 0.0 | 0.0 | 0.0 | 0.0 | 0.0 | 0.0 | 0.0 | 0.0 | 0.0 | | Clearing and Settlement Services | 1.9 | 0.2 | 0.4 | 0.5 | 0.5 | 0.0 | 0.0 | 0.0 | 0.0 | 0.0 | | Derivative, Stock, Securities, Foreign Exchange trading Services | 9.6 | 3.1 | 19.8 | 19.6 | 20.3 | 0.4 | 0.3 | 0.5 | 0.7 | 1.0 | | Other Financial Services | 0.6 | 2.1 | 25.2 | 26.8 | 20.9 | 0.7 | 1.5 | 1.1 | 1.5 | 1.2 | | Total | 68.0 | 93.5 | 89.6 | 94.3 | 86.8 | 4.1 | 4.8 | 16.6 | 13.0 | 9.8 | | Note: Sum of components may differ from total due to rounding off. This is applicable for other tables also. |
| Table 6: Activity Share in Trade in Banking Services | | (per cent) | | Activity | Indian Banks’ Branches Operating Abroad | Foreign Banks’ Branches Operating in India | | 2011-12 | 2012-13 | 2013-14 | 2014-15 | 2015-16 | 2011-12 | 2012-13 | 2013-14 | 2014-15 | 2015-16 | | Deposit Account Management Services | 2.7 | 8.3 | 1.3 | 1.2 | 1.4 | 5.4 | 5.1 | 4.6 | 2.8 | 1.7 | | Credit Related Services | 37.6 | 43.2 | 27.8 | 28.2 | 30.2 | 10.9 | 12.2 | 11.9 | 12.0 | 12.2 | | Financial Leasing Services | 0.0 | 0.0 | 0.0 | 0.0 | 0.0 | 0.0 | 0.0 | 0.0 | 0.0 | 0.0 | | Trade Finance Related Services | 26.8 | 36.7 | 16.0 | 16.0 | 15.8 | 19.0 | 22.1 | 17.1 | 16.6 | 16.7 | | Payment and Money Transmission Services | 14.8 | 5.7 | 3.1 | 3.6 | 3.8 | 9.2 | 15.0 | 15.7 | 18.3 | 21.0 | | Fund Management Services | 0.0 | 0.0 | 0.0 | 0.0 | 0.0 | 5.9 | 6.1 | 4.4 | 5.6 | 6.4 | | Financial Consultancy and Advisory Services | 0.4 | 0.1 | 1.2 | 1.3 | 0.8 | 14.4 | 15.0 | 16.6 | 17.2 | 9.6 | | Underwriting Services | 0.0 | 0.0 | 0.0 | 0.0 | 0.0 | 0.4 | 0.2 | 2.9 | 0.6 | 0.7 | | Clearing and Settlement Services | 2.8 | 0.3 | 0.4 | 0.5 | 0.5 | 3.7 | 1.2 | 0.9 | 0.7 | 1.1 | | Derivative, Stock, Securities, Foreign Exchange trading Services | 14.1 | 3.5 | 22.1 | 20.8 | 23.4 | 21.5 | 17.6 | 20.9 | 20.4 | 19.0 | | Other Financial Services | 0.9 | 2.3 | 28.0 | 28.4 | 24.1 | 9.6 | 5.6 | 4.8 | 5.9 | 11.6 | | All activities | 100.0 | 100.0 | 100.0 | 100.0 | 100.0 | 100.0 | 100.0 | 100.0 | 100.0 | 100.0 |
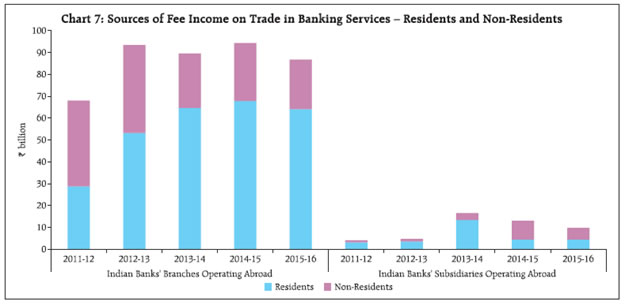
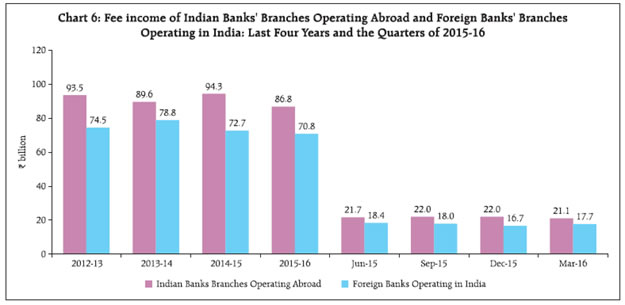 VI. Fee Income Total fee income generated by the 201 Indian banks’ branches operating abroad decreased to ₹ 86.8 billion (US$1.3 billion) in 2015-16 from ₹ 94.3 billion (US$ 1.5 billion) in the previous year. Similarly, fee income of 317 foreign banks branches operating in India reduced to ₹ 70.8 billion (US$ 1.1 billion) in 2015-16 from ₹ 72.7 billion (US$ 1.2 billion) in 2014-15 (Chart 6). A dominant portion of fee income of Indian banks’ branches operating abroad came from residents. In contrast, major portion of fee income for Indian banks’ subsidiaries operating abroad came from nonresidents (Chart 7).
 | Table 7: Country-wise classification of Fee Income by Indian banks’ branches operating abroad and Foreign Banks Operating in India | | (Amount in ₹ billion) | | | Indian Banks’ Branches Operating Abroad | Foreign Banks’ Branches Operating in India | | 2011-12 | 2012-13 | 2013-14 | 2014-15 | 2015-16 | 2011-12 | 2012-13 | 2013-14 | 2014-15 | 2015-16 | | Bahrain | 2.5 | 2.9 | 3.9 | 5.2 | 3.9 | 0.1 | 0.1 | 0.1 | 0.1 | 0.1 | | Hong Kong | 9.5 | 9.4 | 7.9 | 8.2 | 7.2 | 16.5 | 15.7 | 13.4 | 13.5 | 11.9 | | Japan | 0.9 | 1.0 | 1.2 | 0.8 | 0.9 | 1.2 | 1.4 | 1.2 | 1.4 | 1.6 | | Singapore | 8.9 | 8.2 | 7.5 | 7.3 | 6.8 | 4.6 | 3.6 | 2.3 | 2.2 | 2.4 | | Sri Lanka | 0.1 | 15.4 | 0.3 | 0.4 | 0.3 | 0.0 | 0.0 | 0.0 | 0.1 | 0.1 | | UAE | 5.9 | 4.1 | 8.5 | 9.9 | 9.0 | 0.2 | 0.2 | 0.4 | 0.4 | 0.5 | | UK | 27.8 | 38.8 | 49.8 | 52.3 | 48.0 | 26.8 | 18.5 | 23.0 | 18.5 | 16.4 | | USA | 5.2 | 4.3 | 3.7 | 4.1 | 4.1 | 24.0 | 20.4 | 26.6 | 25.6 | 28.6 | | Other Countries | 7.2 | 9.4 | 6.8 | 6.1 | 6.6 | 20.9 | 14.6 | 11.8 | 10.9 | 9.2 | | Total | 68.0 | 93.5 | 89.6 | 94.3 | 86.8 | 94.3 | 74.5 | 78.8 | 72.7 | 70.8 | In terms of fee income, branches of Indian banks in UK had the largest contribution in providing banking services followed by UAE, Hong Kong and Singapore (Table 7). The amount accrued from ITBS operations in India of foreign banks from USA, Hong Kong and Japan was higher than the amount accrued from such overseas operations by Indian banks in these countries. VII. Conclusion The rising cross-border presence of Indian and foreign banks over the years is commensurate with the rising global trade in goods and services and commensurate demand for banking services. As the number of overseas branches of Indian banks increased from 163 in March 2012 to 201 in March 2016, their consolidated balance sheet increased by nearly 57.0 per cent to nearly US$ 227 billion over this period. The growth of foreign banks’ presence in India was relatively moderate from 309 branches to 317 branches over this period and their combined balance sheet also recorded a lower increase of nearly 9.0 per cent to US$ 123 billion in March 2016. Fee income is a focus area for banks’ profitability and most of the fee income of Indian banks’ branches operating abroad came through rendering services to residents. Foreign banks operating in India had a higher share of non-interest income in total income than that for Indian banks’ branches operating abroad. This is a major reason why, despite lower asset base, the income of foreign banks in India consistently exceeded that of Indian banks’ branches operating abroad in the recent years. The profitability ratio (Return on Assets) of foreign banks in India remained above that of the Indian banks’ branches/subsidiaries operating abroad. During 2015-16, however, profitability ratio declined for both Indian banks’ overseas branches/subsidiaries as well as foreign banks’ branches in India.
|