Sadhan Kumar Chattopadhyay and Siddhartha Nath* Received: September 28, 2023
Accepted: February 13, 2024 Based on World Bank’s Enterprise Survey data for 17 emerging and developing countries, this paper finds that the gain in an enterprise’s technical efficiency from its product/process innovations is higher when it has access to external finance for its short-term working capital needs. These findings hold for samples of small and medium enterprises, and for both manufacturing and services activities. Access to external finance for working capital is associated with higher spending on skilled workers, non-manufacturing workers and training, providing a possible explanation for the paper’s findings. JEL Classification: O31, O33, G21, L25. Keywords: Innovation, digital adoption, access to finance, efficiency, World Bank’s Enterprise Survey Introduction The empirical literature has established a robust link between finance and productivity growth1. Some of the channels through which financial development, financial frictions and access to finance influence firm productivity are investment in human capital (Becker, 1967; Black and Lynch, 1996; Blundell et al., 1999; and Madsen and Ang, 2016), investment in technologies (Ayyagari et al., 2011; Brown et al., 2009 and 2012; Hsu et al., 2014; Adegboye and Iweriebor, 2018; Kim et al., 2019; and Kaur et al., 2021), investment in institutional quality (Talke et al., 2010; and Xie et al., 2020), knowledge externality and outsourcing (Grupp, 1997; and Asimakopoulos, 2020), and research collaboration among firms and regions (Fritsch, 2004; Guan et al., 2016; and Fan et al., 2020). These investments bring in newer ways of making products and doing businesses, which are known as innovations2. External finance, apart from bringing in innovation, increases knowledge and level of technology in a firm (Pavitt and Wald, 1971). Productivity gains from innovation require capital investment towards changing the production process, company organisation and skill requirements of both workers and management. Citing the example of USA before 1970s, Pavitt and Wald (1971) argue that research-intensive firms not only employed relatively more scientists and engineers but also a larger workforce in production, sales, and non-production activities to maximise benefits from their research. Access to external finance, including venture capital from non-banking entities, also acted as a key enabler in this process. For the European countries, the sensitivity of a firm’s productivity growth to its spending on innovations depended on financial constraints (Levine and Warusawitharana, 2021). Although Wurgler (2000) and Levine and Warusawitharana (2021) provided insights from the point of view of allocation of funds, direct empirical support between a firm’s access to external finance and the success of its innovation in the emerging and developing economies is limited. This paper tries to address this gap. Based on the World Bank’s Enterprise Survey (WBES) data for 17 emerging and developing economies from 2010, the empirical analysis in this paper suggests that a firm’s productivity gains from its product/process innovations and digital adoption are higher when the enterprise has access to external finance for short-term working capital needs. Our paper is closely related to the branch of empirical literature which supports link between finance and productivity growth (Levine and Zervos, 1998; Beck et al., 2000; Benhabib and Spiegel, 2000; Brown et al., 2009 and 2012; Andrews et al., 2014; Andrews and Cingano, 2014; Cole et al., 2016; and Madsen and Ang, 2016). These studies suggest that financial growth drives productivity through higher investments into innovation, human capital and diverting resources to productive uses. Our paper, in contrast, examines as to whether access to external finance leads to higher success/returns from the existing innovation. The paper extends findings of Wurgler (2000) at the firm-level in the emerging and developing countries, while supporting finance as a condition for the success of innovation, as hypothesised in Pavitt and Wald (1971). Investments in basic research and innovations have gained prominence as the drivers of sustainable growth of enterprises (IMF, 2022). However, a firm’s productivity gain to its innovations varies significantly across countries and sectors (Nasierowski and Arcelus, 2003; Wang, 2007; Bai, 2013; Goa and Chou, 2015; and Aldierdi et al., 2021). For a developing country with limited resources allocated for innovation (Dutz, 2017), maximising benefits from its innovation is crucial for achieving sustained economic progress. A relatively recent strand of empirical literature provides evidence suggesting that variations in institutional, organisational and macroeconomic factors influence returns on innovation at the firm level. For instance, the firm’s ownership structure, size, age (Zhang et al., 2003; and Su et al., 2023), political connections (Song et al., 2015), and fiscal incentives (Guan and Yam, 2015; and Hong et al., 2016) are found to influence a firm’s efficiency gains from its innovations. The role of financial development towards the success of a firm’s innovations, however, has largely remained an unexplored area, which has been studied in our paper. The paper is divided into the following sections: Sections II and III discuss data and empirical methodology, respectively. Section IV discusses results and Section V the concluding observations. Section II
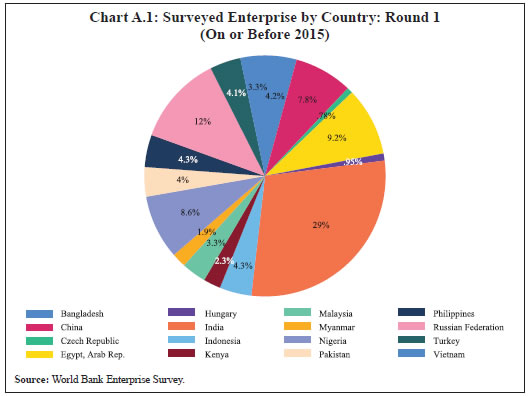
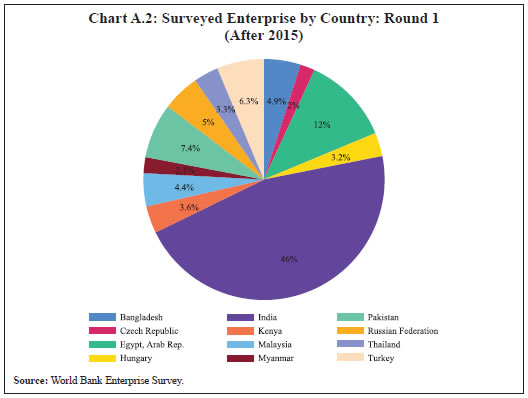
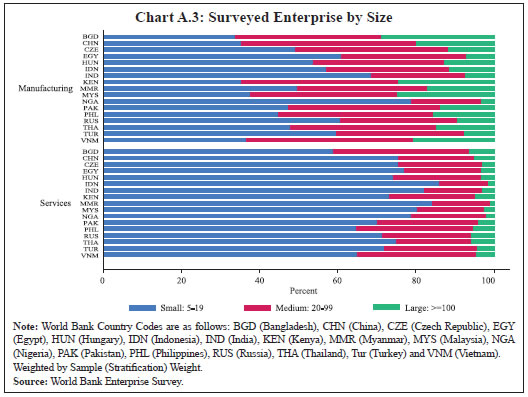
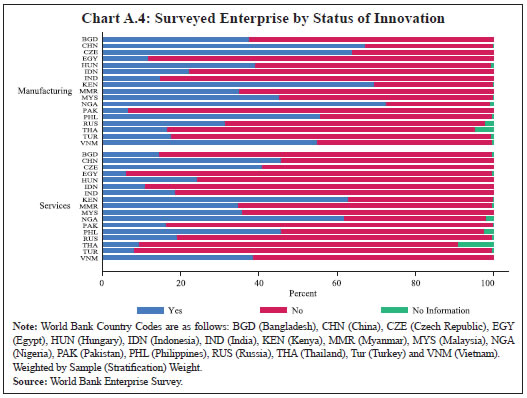
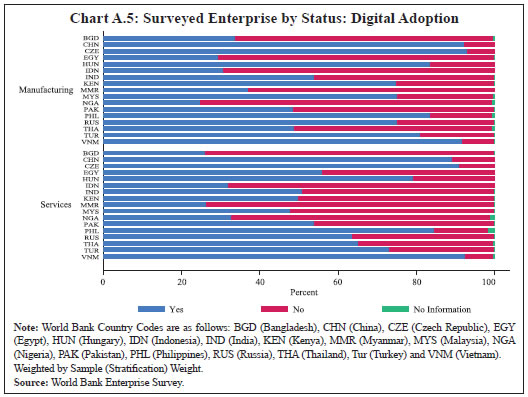
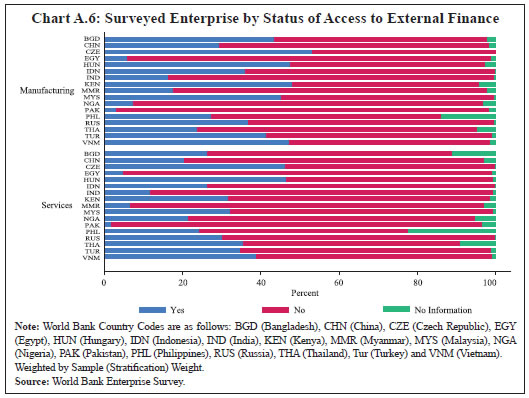
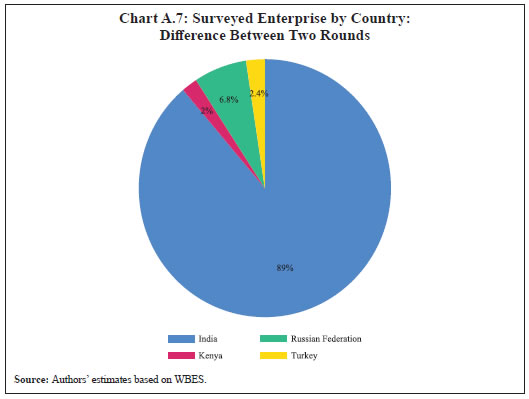
Data We use enterprise-level data from WBES for the following countries: Bangladesh (2013, 2022), China (2012), Czech Republic (2013, 2019), Egypt (2013, 2020), Hungary (2013, 2019), India (2014, 2022), Indonesia (2015), Kenya (2013, 2018), Malaysia (2015, 2019), Myanmar (2014, 2016), Nigeria (2014), Pakistan (2013, 2022), Philippines (2015), Russia (2012, 2019), Thailand (2016), Turkey (2013, 2019) and Vietnam (2015)3. We use the ‘combined’ dataset from the survey’s official website consisting of the commonly available indicators across all countries. We use survey rounds only since the post-Global Financial Crisis period, i.e., after 2010, as this period has attracted debates regarding slowing innovation, on account of investment slowdown and policy uncertainties across the globe (Aghion et al., 2012; and López-García et al., 2013). We have not used the Organisation for Economic Cooperation and Development (OECD) countries as no enterprise survey was available for these countries before 2020, which may significantly bias our findings. We use the post-COVID-19 rounds for Bangladesh, India and Pakistan along with one pre-COVID-19 round, so that the year-specific effects could be controlled. We use the International Monetary Fund’s (IMF) definition of emerging economies4. We exclude Argentina and Colombia from the analysis since these are defined as ‘commodity dependent’, by United Nations Conference on Trade and Development (UNCTAD)5. No data was available for Brazil, Chile, Mexico and South Africa after 2010, while for Saudi Arabia, the only survey round available was after 2020. The WBES provides a representative sample of an economy’s private sector covering business environment, access to finance, corruption, infrastructure, competition, innovation, and performance measures. The survey covers enterprises from both manufacturing and services sectors which are registered and have five or more employees. Enterprises with 100 per cent government/state ownership are not included in the survey. Standard classification of activities within manufacturing and services sectors is provided in the survey based on International Standard Industrial Classification of All Economic Activities (ISIC) (Revisions 3.1 and 4). We use the terms ‘enterprise’ and ‘firm’ interchangeably to refer similar entities throughout this paper. Our main variables of interest are firm-level efficiency, access to finance and innovation. We estimate firm-level efficiency following Kumbhakar and Lovell (2000) (see Section III.1). We define access to finance in the following ways. First, whether an enterprise has reported any type of bank loan of any tenure, or line of credit from the supplier/customer. Second, whether the enterprise has access to any external sources for financing its working capital. Third, whether any proportion of the working capital of an enterprise is financed through bank loan. Fourth, whether any proportion of the investment of an enterprise is financed through bank loan, and last, whether any proportion of the investment of an enterprise is financed through the sale of equity shares. We use two measures of innovation: first, whether an enterprise introduced a new product/service, undertook process innovation, or spent on research and development during the survey reference period, and second, whether an enterprise has or uses its own website/email to communicate with clients/ customers which represents an aspect of digital innovation. Due to the nature of survey per se, we measure access to finance and innovation as binary variables, assuming only values 0 and 1, where 1 represents an affirmative response. The descriptive statistics are given in Table A.1 in the Annex; Charts A.1 to A.6 in Annex show basic survey characteristics. Section III
Empirical Methodology III.1. Technical Efficiency In the literature, the terms productivity and efficiency have been used interchangeably while referring to gains from innovation. While both these terms refer to similar concepts of maximising output with given inputs, productivity is generally measured over time, while efficiency is more useful for comparisons across units at a given point of time. Given the discrete nature of WBES, we use firm-level efficiency, following Kumbhakar and Lovell (2000) to measure returns from innovation. We measure returns from innovation by an enterprise through incremental technical efficiency (TE). In general, TE measures how efficiently a firm uses the available factor inputs, namely labour and capital. With the same levels of factor inputs, higher value-added would indicate higher TE. We use Stochastic Frontier approach of Kumbhakar and Lovell (2000) to estimate TE of a firm. In this approach, a ‘best-practice technology frontier’ is estimated for a set of firms. The frontier usually takes the form of a standard neo-classical production function. This approach considers the ‘distance’ of a firm from the best-practice frontier as a combination of its own technical inefficiency, and random ‘noise’ beyond its control, thus making the entire frontier ‘stochastic’. Under the assumption that the production function of a representative enterprise takes the Cobb-Douglas form, the estimated equation has the following form:  where, log_va, log_l, and log_k are natural logarithms of ith firm’s value added, i.e., total annual sales of the establishment minus total annual cost of inputs; total annual cost of labour; and the replacement value of machinery, vehicles, and equipment, respectively. All these variables are available in constant 2009 USD from the survey data. The technical inefficiency ui is assumed to follow a half-normal distribution, i.e., truncated on its left at 0, and vi is the idiosyncratic white-noise error term following usual two-sided normal distribution. vi and ui are assumed to be distributed independent of each other, and of the regressors. The heteroskedasticity of both vi and ui are explicitly modeled in these estimates using natural logarithm of total annual sales of the establishments. We do not include any time-trend in the construction of TE. Equation (1) includes dummy variables for countries and years to account for unobserved country-specific characteristics, such as institutions, and unobserved year-specific shocks6. A firm’s TE is estimated using Equation (2). 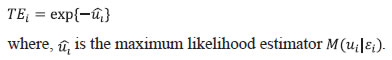  The results are discussed in Section IV. III.2. Cross-section Estimates The following regressions are estimated for the impact of access to external finance on efficiency gains through product/process innovation and digital adoption: Innovation, adoption and access are binary responses, consisting of 0 and 1. An enterprise i reporting access to finance, product/process innovation and adoption of website/email is assigned value 1 for the variables access, innovation and adoption, respectively, and 0 otherwise. We use pooled crosssection data across enterprises for equations (1) to (4). Equations (3) and (4) are subject to ‘endogeneity’ issues since more efficient firms can afford innovations and are also likely to have access to external finance. To mitigate these concerns, we use the following variables from the survey as instruments for our explanatory variables: (a) average number of electrical outages at an enterprise in a month; (b) average duration (in hours) of an electrical outage; (c) a binary response showing whether an enterprise had women among their top managers; (d) percentage of annual sales spent as security cost by an enterprise; and (e) number of years of experience by the top manager of an enterprise in the sector. A necessary condition requires that these instruments be strictly exogenous to the firm but are correlated with the explanatory variables. In our case, power outages can be faced equally by every firm in a certain area and are beyond the direct control of a firm. On the other hand, infrastructure gap, including power shortages, can directly impact firm-level innovations (Sivak et al., 2011). Second, the presence of women in an enterprise in general, and among the top positions in a company are found to be strongly associated with improved investor perception and sustainability expenses, which can be strong drivers of both innovation and access to finance (Gillan et al., 2021). Third, security expenses may suggest an enterprise’s perception about security threats to its operation. Law and order, stability and governance can significantly impact how the financial institutions would expose itself to the business entities in an area (Sivak et al., 2011)8. Lastly, although more efficient enterprises may be able to hire more experienced senior managers (Dahl and Klepper, 2007), medium and small enterprises (with employee size less than 100 employees), which occupy large share in this survey (see Chart A.3 in the Annex), are less likely to hire experienced but expensive top managers from outside, and hence, their managers’ experience could mostly be gathered from within the firm’s operations. Therefore, in small and medium enterprises, the causality is more likely to run from managers’ experience to the firm’s efficiency, and not reverse, where a more efficient firm hires experienced managers9. The ‘exclusion restriction’ requires that a valid instrument impacts the dependent variable only through explanatory variable, and not directly. This condition, however, could not be ensured for our instruments. For instance, while power outages can influence a firm’s decision regarding undertaking of innovations, power outages can also directly reduce a firm’s TE by suspending activities. Lewbel (2012) suggests an Instrumental Variable (IV) estimator using model heteroskedasticity as an additional instrument, when either no exogenous instruments are available, or the conventionally chosen instruments can be ‘suspected’. Lewbel (2018) suggests that Lewbel (2012) remains valid when the endogenous regressors are binary10. The Sargan-Hansen orthogonality tests under Lewbel (2012, 2018) are used to make decisions on the inclusion of instruments in estimation. We weight the observations by (stratified) sample weight assigned by the survey. III.3. Estimates in Difference for Product/Process Innovations We use more than one round of the WBES for most countries in our sample. The survey comes with a unique panel identifier for each enterprise, which remains unchanged between successive rounds of WBES in the same country. This gives us a chance to look at the change in TE, the change in the status of access to external finance and the change in innovation for an enterprise between two survey rounds11. We use this information to estimate equation (5) using Lewbel (2012).  In this specification, we use change in an enterprise’s TE between two survey rounds as the dependent variable. First, we categorise firms into two: those which did not have access to external finance in the first round, and second, those which did not report any change in the access to external finance between two rounds12. Then we define the following categories based on changes in innovation. We assign 1 to an enterprise if it did not report innovation in the first round but reported innovation in the second round of the survey; -1 to an enterprise that reported innovation in the first round of the survey but did not report innovation in the second round; 0 to the remaining enterprises which reported no change in innovation between two rounds. We categorise the changes in instruments also in the similar way13. We use survey data for India, Kenya, Russia and Turkey, as relevant data was available only for these countries14. The estimation of equation (5), however, potentially suffers from ‘attrition bias’ as some weaker firms may discontinue their operation after the first round of survey and may not show up in the second round. In order to overcome this bias, we estimated equation (5) following Wooldridge (2010) where we included the Inverse Mills Ratio (IMR) obtained from a Probit model on survival of a firm in the second round as an additional explanatory variable15. In the Probit model, we use an enterprise’s sector of operation, ownership type and country as the explanatory variables for a binary dependent variable which assumes value 1 if the enterprise existed in both the rounds, 0 otherwise. Section IV
Findings IV.1 Technical Efficiency The distribution of estimated firm-level TEs is given in Chart 116. The left panel shows that TE has longer tails on the left, i.e., towards 0. The distribution broadly remains unchanged, with slightly fatter left-tail and reduced probability of the higher values when we exclude India and China, which together constitute about 40 per cent of our sample. The right panel in Chart 1 shows the distribution of TE within sample countries across all the surveyed enterprises. The horizontal line in the middle of the box provides the median value, and the height of the boxes, the difference between TE in the 25th and 75th percentiles. Chart 2 suggests that, among the firms which reported product/ process innovation and/or digital adoption, the group which had access to external finance, had higher median value of TE as compared to firms which did not have such access except Vietnam. Chart 2, however, is subject to wide inter-quartile variation represented by the height of the boxes. Therefore, we estimate an empirical model to build more robust inferences after accounting for heterogeneity across firms. IV.2 Regression Estimates The estimated coefficients from equation (3) suggesting sensitivity of an enterprise’s TE to its product/process innovation on access to external finance are given in Table 1. The coefficients of innovation are positive and statistically significant in all the models, suggesting that the enterprises which reported any product/process innovation experienced improved TE. The dummy variable for the access to finance had mixed signs. In Models (1) and (2), access to external finance of any type (i.e., bank loan or line of credit for any purpose) was positively associated with TE, supporting the general finance-productivity linkage hypotheses (Heil, 2017). The interaction between innovation and access to finance in Model (2) was positive and statistically significant at 10 per cent, suggesting that the sensitivity of an enterprise’s TE to product/process innovation was higher when the enterprise had access to external finance. 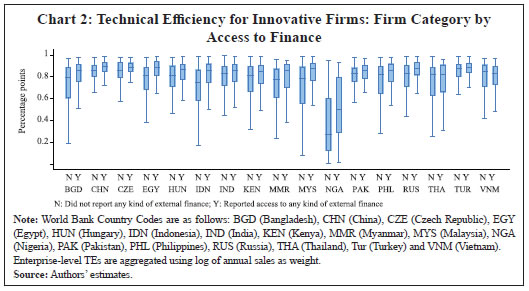
| Table 1: Product/Process Innovation and Efficiency under Access to Finance: All Firms | | | Bank Loan/Line of Credit (LoC) | External Finance for Working Capital | Bank Loan for Working Capital | Bank Loan for Investment | Sale of Equity | | (1) | (2) | (3) | (4) | (5) | (6) | (7) | (8) | (9) | (10) | | Dependent Variable: Technical Efficiency | | Innovation=1 | 0.100*** | 0.094*** | 0.22*** | 0.034* | 0.23*** | 0.20*** | 0.065*** | 0.058*** | 0.12*** | 0.12*** | | | (0.0072) | (0.0075) | (0.0076) | (0.020) | (0.0075) | (0.0094) | (0.014) | (0.014) | (0.0085) | (0.0084) | | Access to Finance=1 | 0.097*** | 0.088*** | -0.063*** | -0.047*** | -0.015 | -0.034*** | 0.11*** | 0.077** | 0.19*** | 0.240*** | | | (0.0081) | (0.0087) | (0.0081) | (0.011) | (0.013) | (0.010) | (0.026) | (0.033) | (0.048) | (0.047) | | (Innovation=1)* | | 0.026* | | 0.083*** | | 0.058*** | | -0.033 | | -0.167* | | (Access to Finance=1) | | (0.015) | | (0.015) | | (0.020) | | (0.036) | | (0.098) | | Chi-sq | 7.114 | 7.069 | 0.341 | 6.051 | 1.154 | 2.883 | 8.502 | 0.429 | 0.002 | 1.592 | | Prob (Chi-sq) | 0.0285 | 0.0292 | 0.8434 | 0.0139 | 0.5615 | 0.2365 | 0.0143 | 0.8069 | 0.9630 | 0.2071 | | Number of Observations | 21649 | 21649 | 21677 | 21647 | 21431 | 21532 | 13628 | 13628 | 5650 | 5650 | Note: Standard errors in parentheses.
* p < 0.10, ** p < 0.05, *** p < 0.01
Sargan-Hansen’s orthogonality test statistic (Chi-sq) suggests that the tests ‘fail to reject’ the null hypothesis that ‘Instruments are Valid’ at 5 per cent level of significance.
Source: Authors’ estimates. | Models (3) and (4) provide estimates using access to external finance for working capital for meeting an enterprise’s day-to-day operational expenses. The coefficients for innovation were positive and statistically significant. The coefficients for the access to finance were negative17. The interaction between innovation and access to finance was positive and statistically significant in Model (4). We found similar evidence for Models (5) and (6), when working capital of an enterprise was funded through bank loans. Models (7) and (8) present estimates for the access to external finance for long-term investments through bank loans, and Models (9) and (10) provide estimates when an enterprise issued equity shares for raising external funds. The coefficients of both innovation and access to finance were positive and statistically significant. The interaction between innovation and access to finance, however, was not statistically significant in Model (8) (financing of investment through bank loans), while it became negative in Model (10) (issuance of equity shares). The estimates for digital adoption in Table 2 based on equation (4) corroborated our findings in Table 1. The interaction between digital adoption and access to finance was positive and statistically significant in all the specifications, except under Model (10), suggesting that the sensitivity of an enterprise’s TE to digital adoption was generally higher when the enterprise had access to external finance. The interaction coefficient was negative, although not statistically significant in Model (10), i.e., under the issuance of equity shares. In Model (8), i.e., when an enterprise met its long-term investment needs through bank loans, the coefficient was positive and statistically significant. The coefficients were positive and statistically significant in Models (4) and (6), when an enterprise’s short-term working capital needs were financed through external sources, including banks. | Table 2: Digital Adoption and Efficiency under Access to Finance: All Firms | | | Bank Loan/ LoC | External Finance for Working Capital | Bank Loan for Working Capital | Bank Loan for Investment | Sale of Equity | | (1) | (2) | (3) | (4) | (5) | (6) | (7) | (8) | (9) | (10) | | Dependent Variable: Technical Efficiency | | Adoption=1 | 0.048*** | 0.12*** | 0.081*** | 0.16*** | 0.052*** | 0.059*** | 0.16*** | 0.063*** | 0.21*** | 0.20*** | | | (0.016) | (0.0098) | (0.015) | (0.018) | (0.017) | (0.0095) | (0.0099) | (0.012) | (0.015) | (0.015) | | Access to | 0.15*** | 0.057** | 0.078*** | -0.061*** | 0.10*** | -0.010 | 0.29*** | -0.028 | -0.040 | 0.061 | | Finance=1 | (0.017) | (0.026) | (0.021) | (0.016) | (0.025) | (0.012) | (0.059) | (0.031) | (0.042) | (0.085) | | (Adoption=1)* | | 0.066** | | 0.047** | | 0.12*** | | 0.091*** | | -0.091 | | (Access to Finance=1) | | (0.029) | | (0.023) | | (0.019) | | (0.035) | | (0.095) | | Chi Sq. | 1.811 | 2.274 | 4.178 | 2.357 | 1.614 | 3.959 | 3.131 | 1.096 | 0.006 | 1.142 | | Prob (Chi Sq.) | 0.1784 | 0.3208 | 0.0410 | 0.1247 | 0.2040 | 0.1382 | 0.0768 | 0.5781 | 0.9362 | 0.2852 | | Number of Observations | 24713 | 22619 | 24747 | 21782 | 24465 | 21432 | 15452 | 13630 | 5664 | 5664 | Note: Standard errors in parentheses.
* p < 0.10, ** p < 0.05, *** p < 0.01
Sargan-Hansen’s orthogonality test statistic (Chi-sq) suggests that the tests ‘fail to reject’ the null hypothesis that ‘Instruments are Valid’ at 5 per cent level of significance.
Source: Authors’ estimates. | Our estimates in Tables 1 and 2 suggested that the sensitivity of an enterprise’s TE to its product/process innovation and digital adoption was higher when the enterprise had access to external finance. Our separate estimates based on WBES suggested that an enterprise’s likelihood of spending on formal trainings (Model (2) in Table A.4 in the Annex) and the proportion of workers to whom it offered formal training (Models (3) and (4) in Table A.5 in the Annex), both were positively associated with the enterprise’s access to external finance18. An enterprise’s access to short-term external finance19, on the other hand, was positively associated with both the proportion of nonproduction workers in total number of permanent workers (Model (1) in Table A.4 in the Annex) and the proportion of skilled workers in all workers (Model (2) in Table A.5 in the Annex), compared to enterprises which either did not have any access to external finance or had access to external finance only for the long-term financial needs20. IV.3 Robustness Checks We conducted several robustness checks for our estimates on the access to external finance for working capital needs. To illustrate, our earlier findings based on Tables 1 and 2 were robust for separate samples of small and medium enterprises (Table 3). Estimates in Table 1 could be subject to a variation in sample sizes. We provide a robustness check for the estimates in Models (3) to (6) given in Table 1 (i.e., access to finance for working capital) by limiting the enterprises to a set of common firms which appear in all models. Table 4 suggests that the estimated coefficients for the interaction term between innovation and access to finance for working capital were positive and statistically significant in a sub-sample of common firms in Models (2) and (3), i.e., access to external finance for working capital. | Table 3: Robustness Check for the Access to External Finance for Working Capital on Firm Size | | Variable | Small (5-20) | Medium (20-99) | Small (5-20) | Medium (20-99) | | (1) | (2) | (3) | (4) | | Dependent Variable: Technical Efficiency | | Innovation=1 | 0.034* | 0.063** | | | | | (0.018) | (0.028) | | | | Digital Adoption=1 | | | 0.10* | 0.067* | | | | | (0.064) | (0.035) | | Access to Finance=1 | -0.054*** | -0.038** | -0.11*** | -0.073 | | | (0.018) | (0.015) | (0.031) | (0.051) | | (Innovation=1)*(Access to Finance=1) | 0.060** | 0.040** | | | | (0.028) | (0.019) | | | | (Digital Adoption=1)*(Access to Finance=1) | | | 0.11** | 0.13** | | | | | (0.044) | (0.058) | | Chi Sq. | 11.207 | 3.757 | 1.082 | 3.782 | | Prob (Chi sq) | 0.0037 | 0.0526 | 0.5822 | 0.0518 | | Number of Observations | 6921 | 8553 | 6945 | 8951 | Note: Standard errors in parentheses.
* p < 0.10, ** p < 0.05, *** p < 0.01
Sargan-Hansen’s orthogonality test statistic (Chi-sq) suggests that the tests ‘fail to reject’ the null hypothesis that ‘Instruments are Valid’ at 5 per cent level of significance in models (2) to (4).
Source: Authors’ estimates. |
| Table 4: Product/Process Innovation and TE under Access to Finance: Common Firms | | Variable | Bank Loan/LoC of Any Type | External Finance for Working Capital | Bank Loan for Working Capital | | (1) | (2) | (3) | | Innovation=1 | 0.23*** | 0.098*** | 0.11*** | | | (0.021) | (0.0096) | (0.0098) | | Access to Finance=1 | -0.071*** | -0.077*** | -0.079*** | | | (0.017) | (0.013) | (0.014) | | (Innovation=1)*(Access to Finance=1) | -0.0056 | 0.094*** | 0.095*** | | | (0.034) | (0.018) | (0.019) | | Chi Sq. | 0.046 | 4.895 | 3.509 | | Prob (Chi Sq.) | 0.8302 | 0.0865 | 0.1730 | | Number of Observations | 5659 | 5851 | 5851 | Note: Standard errors in parentheses.
* p < 0.10, ** p < 0.05, *** p < 0.01.
Sargan-Hansen’s orthogonality test statistic (Chi-sq) suggests that the tests ‘fail to reject’ the null hypothesis that ‘Instruments are Valid’ at 5 per cent level of significance.
Source: Authors’ estimates. |
| Table 5: Firm Efficiency under Access to Finance for Working Capital: By Sector | | Dependent Variable: Firm-level Technical Efficiency | | Variable | Product/Process Innovation | Digital Adoption | | Manufacturing | Services | Manufacturing | Services | | (1) | (2) | (3) | (4) | | Innovation=1 | 0.058** | -0.25*** | | | | | (0.024) | (0.092) | | | | Digital Adoption=1 | | | 0.15*** | 0.18*** | | | | | (0.018) | (0.020) | | Access to Finance=1 | -0.067*** | -0.026 | -0.064*** | 0.094*** | | | (0.017) | (0.054) | (0.016) | (0.019) | | (Innovation=1)*(Access to Finance=1) | 0.18*** | 0.24*** | | | | | (0.028) | (0.076) | | | | (Digital Adoption=1)*(Access to Finance=1) | | | 0.054** | 0.046* | | | | | (0.023) | (0.027) | | Chi Sq. | 2.986 | 1.465 | 2.679 | 3.819 | | Prob (Chi Sq.) | 0.2247 | 0.4806 | 0.1017 | 0.1482 | | Number of Observations | 20945 | 1660 | 20182 | 1665 | Note: Standard errors in parentheses.
* p < 0.10, ** p < 0.05, *** p < 0.01
Sargan-Hansen’s orthogonality test statistic (Chi-sq) suggests that the tests ‘fail to reject’ the null hypothesis that ‘Instruments are Valid’.
Source: Authors’ estimates. | Separate estimates for manufacturing and services sectors in Table 5 are also in line with the earlier findings21. Models (1) and (2) in Table 5 pertain to product/process innovations, while Models (3) and (4) pertain to digital adoption by an enterprise. The interaction terms between innovation and access to finance under both Models (1) and (2) were positive and statistically significant. Similar effects were also seen with regard to the sensitivity of an enterprise’s TE to its adoption of digital technologies in both manufacturing and services sectors under Models (3) and (4), respectively. | Table 6: Innovation and Efficiency under Access to Finance: Estimates on Differences | | Variable | Bank Loan/LoC | External Finance for Working Capital | | (1) | (2) | | Innovation | 0.16* | -0.21* | | | (0.086) | (0.12) | | Access to Finance | -0.041 | 0.27** | | | (0.056) | (0.13) | | (Innovation)*(Access to Finance) | -0.047 | 0.24** | | | (0.15) | (0.11) | | Chi Sq. | 1.36 | 0.40 | | Prob (Chi Sq.) | 0.51 | 0.82 | | Number of observations | 665 | 674 | Notes: 1. Standard errors in parentheses. Significance levels are as follows:
* p < 0.10, ** p < 0.05, *** p < 0.01
2. Estimates are obtained from two-step procedure based on Wooldridge (2010) to control for panel attrition bias in the second round.
3. The sample is restricted to a common set of firms for which both access to finance in overall category and working capital were observed.
4. Observations are weighted by the survey weight from the first round.
5. Sargan-Hansen’s orthogonality test statistic (Chi-sq) suggests that the tests ‘fail to reject’ the null hypothesis that ‘Instruments are Valid’.
Source: Authors’ estimates. | IV.4 Estimates on Differences The results from equation (5) are illustrated in Table 6. This model was estimated based on the change in TE, innovation and access to finance between two rounds of the WBES for a smaller set of countries and enterprises22. Model (1) in Table 6 provided estimates for the access to external finance for any purpose, including long-term and short-term, whereas Model (2) provided estimates only for the access to external finance for short-term working capital. Both the models are estimated using Lewbel (2012). The coefficient of (gaining) access to external finance is positive and statistically significant only in Model (2), i.e., in case of the access to external finance for working capital, while the coefficient of (adopting) innovation turns negative and statistically significant at 10 per cent. The interaction term between access to external finance and innovation in Model (2) is positive and statistically significant, corroborating our earlier results23. Section V
Conclusion Investments in research and innovations have gained prominence as the drivers of enterprise growth in the backdrop of subdued global economic weaknesses over the last decade and multipronged challenges, including climate change and the pandemic (IMF, 2022). Our paper analyses whether access to finance from external sources makes a difference to the sensitivity of an enterprise’s technical efficiency from the innovation activities that it undertakes. Using WBES rounds for 17 emerging and developing economies conducted after 2010, we observe that the sensitivity of an enterprise’s technical efficiency to both product/process innovation and digital adoption are higher when the enterprise gets access to external finance, especially for its short-term working capital needs. These findings remain robust in separate samples of small and medium enterprises, for manufacturing and services sectors, and within a smaller set firms based on changes in each of these attributes between two survey rounds. We also observe that an enterprise’s likelihood of spending on formal trainings and the proportion of workers to whom it offers formal trainings are positively associated with the enterprise’s access to external finance of any kind (both short and long-term). On the other hand, an enterprise’s access to short-term external finance is associated with higher values of both the proportion of non-production workers in total number of permanent workers and the proportion of skilled workers in all workers, compared to enterprises which either do not have access to external finance or have access to external finance only for the long-term financial needs. Overall, our analysis suggests higher efficiency gains from product/process innovation when firms get access to external finance for short-term working capital. The lack of access to finance not only makes innovations unviable due to their large sunk cost, but also reduces rewards from the existing innovations. The study can be improved further depending upon availability of data. First, while one of our main explanatory variables is access to finance, we rely upon a binary variable whether an enterprise has access to external finance or not. Availability on data on the magnitude and cost of such finance could be more relevant for a firm’s efficiency and productivity and strengthen the analysis. While quantitative information is available in WBES, it is limited, and cannot be verified through the enterprises’ balance sheets. Second, data on the quality and/or the intensity of innovations could provide a better understanding of the linkage between access to finance and innovations. Although there is disagreement regarding the measure of innovation, a firms’ expenditure on different heads such as R & D, environment-risk mitigation, and royalties paid can be useful. Third, a panel data could be more helpful and powerful relative to pooled cross-sectional data in analysing the impact of access to finance on innovations in a more dynamic sense. References Adegboye, A. C., & Iweriebor, S. (2018). Does access to finance enhance SME innovation and productivity in Nigeria? Evidence from the World Bank Enterprise Survey. African Development Review, 30(4), 449-461. Aghion, P., Askenazy, P., Berman, N., Cette, G., & Eymard, L. (2012). Credit constraints and the cyclicality of R&D investment: Evidence from France. Journal of the European Economic Association, 10(5), 1001-1024. Aghion, P., Fally, T., & Scarpetta, S. (2007). Credit constraints as a barrier to the entry and post-entry growth of firms. Economic Policy, 22(52), 732-779. Aldieri, L., Barra, C., Paolo Vinci, C., & Zotti, R. (2021). The joint impact of different types of innovation on firm’s productivity: evidence from Italy. Economics of Innovation and New Technology, 30(2), 151-182. Andrews, D., & Cingano, F. (2014). Public policy and resource allocation: evidence from firms in OECD countries. Economic Policy, 29(78), 253-296. Andrews, D., Criscuolo, C., & Menon, C. (2014). Do resources flow to patenting firms? Cross-country evidence from firm level data. Arping, S., Lóránth, G., & Morrison, A. D. (2010). Public initiatives to support entrepreneurs: Credit guarantees versus co-funding. Journal of Financial Stability, 6(1), 26-35. Asimakopoulos, G., Revilla, A. J., & Slavova, K. (2020). External knowledge sourcing and firm innovation efficiency. British Journal of Management, 31(1), 123-140. Ayyagari, M., Demirgüç-Kunt, A., & Maksimovic, V. (2008). How important are financing constraints? The role of finance in the business environment. The World Bank Economic Review, 22(3), 483-516. Ayyagari, M., Demirgüç-Kunt, A., & Maksimovic, V. (2010). Formal versus informal finance: Evidence from China. The Review of Financial Studies, 23(8), 3048-3097. Ayyagari, M., Demirgüç-Kunt, A., & Maksimovic, V. (2011). Firm innovation in emerging markets: The role of finance, governance, and competition. Journal of Financial and Quantitative Analysis, 46(6), 1545-1580. Bai, J. (2013). On regional innovation efficiency: Evidence from panel data of China’s different provinces. Regional Studies, 47(5), 773-788. Baum, C., & Schaffer, M. (2021). IVREG2H: Stata module to perform instrumental variables estimation using heteroskedasticity-based instruments. Beck, T., Demirguc‐Kunt, A. S. L. I., Laeven, L., & Levine, R. (2008). Finance, firm size, and growth. Journal of Money, Credit and Banking, 40(7), 1379-1405. Beck, T., Levine, R., & Loayza, N. (2000). Finance and the sources of growth. Journal of Financial Economics 58, 261-300. Becker, G. S. (1967). Human capital and the personal distribution of income: An analytical approach (No. 1). Institute of Public Administration. Benhabib, J., & Spiegel, M. M. (2000). The role of financial development in growth and investment. Journal of Economic Growth, 5, 341-360. Black, S. E., & Lynch, L. M. (1996). Human-capital investments and productivity. The American Economic Review, 86(2), 263-267. Blundell, R., Dearden, L., Meghir, C., & Sianesi, B. (1999). Human capital investment: the returns from education and training to the individual, the firm and the economy. Fiscal Studies, 20(1), 1-23. Brown, J. R., Fazzari, S. M., & Petersen, B. C. (2009). Financing innovation and growth: Cash flow, external equity, and the 1990s R&D boom. The Journal of Finance, 64(1), 151-185. Brown, J. R., Martinsson, G., & Petersen, B. C. (2012). Do financing constraints matter for R&D? European Economic Review, 56(8), 1512-1529. Caggese, A. (2019). Financing constraints, radical versus incremental innovation, and aggregate productivity. American Economic Journal: Macroeconomics, 11(2), 275-309. Carpenter, R. E., & Petersen, B. C. (2002). Is the growth of small firms constrained by internal finance? Review of Economics and Statistics, 84(2), 298-309. Cole, H. L., Greenwood, J., & Sanchez, J. M. (2016). Why doesn’t technology flow from rich to poor countries? Econometrica, 84(4), 1477-1521. Dahl, M. S., & Klepper, S. (2007). Who do new firms hire? Working Paper. Dutz, M. (Ed.). (2007). Unleashing India’s innovation: toward sustainable and inclusive growth. World Bank Publications. Enterprise Surveys (http://www.enterprisesurveys.org), The World Bank. Fan, F., Lian, H., & Wang, S. (2020). Can regional collaborative innovation improve innovation efficiency? An empirical study of Chinese cities. Growth and Change, 51(1), 440-463. Fazzari, S., Hubbard, R. G., & Petersen, B. C. (1987). Financing constraints and corporate investment. Fritsch, M. (2004). Cooperation and the efficiency of regional R&D activities. Cambridge Journal of Economics, 28(6), 829-846. Gao, W., & Chou, J. (2015). Innovation efficiency, global diversification, and firm value. Journal of Corporate Finance, 30, 278-298. Gillan, S. L., Koch, A., & Starks, L. T. (2021). Firms and social responsibility: A review of ESG and CSR research in corporate finance. Journal of Corporate Finance, 66, 101889. Griliches, Z., Mairesse, Jacques, (1984). Productivity and R&D at the firm level. In: Griliches, Z. (Ed.), R&D, Patents, and Productivity. Univ. of Chicago Press, Chicago, pp. 339–374. Griliches, Z. (1985). Productivity, R&D, and basic research at the firm level in the 1970s. National Bureau of Economic Research, (No. w1547). Griliches, Z. (1998). Introduction to R&D and Productivity: The Econometric Evidence. R&D and Productivity: The Econometric Evidence (pp. 1-14). University of Chicago Press. Grupp, H. (1997). External effects as a microeconomic determinant of innovation efficiency. International Journal of the Economics of Business, 4(2), 173-188. Guan, J., & Yam, R. C. (2015). Effects of government financial incentives on firms’ innovation performance in China: Evidences from Beijing in the 1990s. Research Policy, 44(1), 273-282. Guan, J., Zuo, K., Chen, K., & Yam, R. C. (2016). Does country-level R&D efficiency benefit from the collaboration network structure? Research Policy, 45(4), 770-784. Gutierrez, E., Rudolph, H. P., Homa, T., & Beneit, E. B. (2011). Development banks: role and mechanisms to increase their efficiency. World Bank Policy Research Working Paper, (5729). Hall, B. H., Lotti, F., & Mairesse, J. (2009). Innovation and productivity in SMEs: empirical evidence for Italy. Small Business Economics, 33, 13-33. Heil, M. (2017). Finance and productivity: A literature review. Hong, J., Feng, B., Wu, Y., & Wang, L. (2016). Do government grants promote innovation efficiency in China’s high-tech industries? Technovation, 57, 4-13. Hsu, P. H., Tian, X., & Xu, Y. (2014). Financial development and innovation: Cross-country evidence. Journal of Financial Economics, 112(1), 116-135. IMF, 2022. Sailing into Headwinds. Regional Economic Outlook: Asia and the Pacific. October. Jaffee, D. M., & Russell, T. (1976). Imperfect information, uncertainty, and credit rationing. The Quarterly Journal of Economics, 90(4), 651-666. Kaur, P., Kaur, N., & Kanojia, P. (2022). Firm innovation and access to finance: firm-level evidence from India. Journal of Financial Economic Policy, 14(1), 93-112. Kim, W. J., Hoi, T. V., Tuan, L. N., & Trung, N. N. (2019). R&D, training and accessibility to finance for innovation: a case of Vietnam, the country in transition. Asian Journal of Technology Innovation, 27(2), 172-193. Kumbhakar, S., & Lovell, K. (2000). Stochastic frontier analysis. Cambridge: Cambridge University Press. Levine, O., & Warusawitharana, M. (2021). Finance and productivity growth: Firm-level evidence. Journal of Monetary Economics, 117, 91-107. Levine, R., & Zervos, S. (1998). Stock markets, banks, and economic growth. American Economic Review, 537-558. Levinsohn, J., & Petrin, A. (2003). Estimating production functions using inputs to control for unobservables. The Review of Economic Studies, 70(2), 317-341. Lewbel, A. (2012). Using heteroscedasticity to identify and estimate mismeasured and endogenous regressor models. Journal of Business & Economic Statistics, 30(1), 67-80. Lewbel, A. (2018). Identification and estimation using heteroscedasticity without instruments: The binary endogenous regressor case. Economics Letters, 165, 10-12. López-García, P., Montero, J. M., & Moral-Benito, E. (2013). Business cycles and investment in productivity-enhancing activities: evidence from Spanish firms. Industry and Innovation, 20(7), 611-636. Madsen, J. B., & Ang, J. B. (2016). Finance-led growth in the OECD since the nineteenth century: how does financial development transmit to growth? Review of Economics and Statistics, 98(3), 552-572. Nasierowski, W., & Arcelus, F. J. (2003). On the efficiency of national innovation systems. Socio-Economic Planning Sciences, 37(3), 215-234. Nickell, S., & Nicolitsas, D. (1999). How does financial pressure affect firms? European Economic Review, 43(8), 1435-1456. Organisation for Economic Co-operation and Development, Pavitt, K., & Wald, S. (1971). The Conditions for Success in Technological Innovation. Organisation for Economic Co-operation and Development. Rajan, R., & Zingales, L. (1998). Financial development and growth. American Economic Review, 88(3), 559-586. Rand, J. (2007). Credit constraints and determinants of the cost of capital in Vietnamese manufacturing. Small Business Economics, 29, 1-13. Rogers, M., & Rogers, M. (1998). The definition and measurement of innovation (Vol. 98). Parkville, VIC: Melbourne Institute of Applied Economic and Social Research. Sivak, R., Caplanova, A., & Hudson, J. (2011). The impact of governance and infrastructure on innovation. Post-Communist Economies, 23(02), 203-217. Song, M., Ai, H., & Li, X. (2015). Political connections, financing constraints, and the optimization of innovation efficiency among China’s private enterprises. Technological Forecasting and Social Change, 92, 290-299. Su, W., Wang, Z., Zhang, C., & Balezentis, T. (2023). Determinants of the innovation efficiency of strategic emerging enterprises: evidence from the robust frontiers. Economic Change and Restructuring, 56(3), 1433-1465. Talke, K., Salomo, S., & Rost, K. (2010). How top management team diversity affects innovativeness and performance via the strategic choice to focus on innovation fields. Research Policy, 39(7), 907-918. Valls Martinez, M. D. C., Cruz Rambaud, S., & Parra Oller, I. M. (2019). Gender policies on board of directors and sustainable development. Corporate Social Responsibility and Environmental Management, 26(6), 1539-1553. Wang, E. C. (2007). R&D efficiency and economic performance: A cross-country analysis using the stochastic frontier approach. Journal of Policy Modeling, 29(2), 345-360. Wooldridge, J. M. (2010). Econometric analysis of cross section and panel data. MIT press. Wurgler, J. (2000). Financial markets and the allocation of capital. Journal of Financial Economics, 58(1-2), 187-214. Xie, L., Zhou, J., Zong, Q., & Lu, Q. (2020). Gender diversity in R&D teams and innovation efficiency: Role of the innovation context. Research Policy, 49(1), 103885. Zhang, A., Zhang, Y., & Zhao, R. (2003). A study of the R&D efficiency and productivity of Chinese firms. Journal of Comparative Economics, 31(3), 444-464.
Annex | Table A.1: Descriptive Statistics24 | | Mean (Standard Deviation) [Number of Observations] | | Country | Log (Value Added) | Log (Cost of Labour) | Log (Replacement Value for Machinery and Vehicle) | Log (Value of Intermediate Inputs) | Log (Sales) | Weights | | Bangladesh | 12.0 | 10.5 | 11.4 | 12.0 | 12.4 | 6.6 | | | (1.9)[1572] | (1.7)[2335] | (2.4)[1612] | (2.4)[1581] | (2.1)[2317] | (10.6)[2429] | | China | 14.3 | 12.6 | 13.1 | 13.7 | 14.7 | 364.3 | | | (1.5)[1508] | (1.4)[2608] | (1.6)[1365] | (1.7)[1510] | (1.6)[2640] | (784.8)[2700] | | Czech | 14.4 | 12.6 | 14.0 | 13.9 | 14.5 | 124.8 | | Republic | (1.7)[333] | (1.8)[645] | (2)[337] | (2)[334] | (1.8)[701] | (119.5)[756] | | Egypt, Arab | 12.2 | 10.6 | 12.2 | 11.7 | 12.6 | 61.6 | | Rep. | (2)[3402] | (1.6)[5444] | (2.2)[3463] | (2.3)[3525] | (2)[5169] | (120.7)[5801] | | Hungary | 13.6 | 12.2 | 13.2 | 13.0 | 14.1 | 60.9 | | | (1.6)[425] | (1.6)[823] | (1.8)[419] | (1.9)[427] | (1.7)[968] | (72)[1113] | | India | 13.0 | 11.3 | 11.7 | 13.0 | 13.5 | 122.7 | | | (1.8)[11021] | (1.6)[17656] | (2.3)[7443] | (2.1)[11039] | (2)[17266] | (285.8)[18352] | | Indonesia | 11.7 | 10.6 | 10.3 | 10.6 | 12.1 | 163.1 | | | (2.2)[902] | (1.9)[1218] | (2.4)[893] | (2.3)[902] | (2.2)[1167] | (394)[1307] | | Kenya | 13.0 | 10.6 | 12.7 | 11.8 | 12.9 | 7.7 | | | (2.3)[593] | (2)[1453] | (2.6)[589] | (2.5)[611] | (2.2)[1476] | (15.3)[1781] | | Malaysia | 13.3 | 11.6 | 12.9 | 12.3 | 13.4 | 83.2 | | | (2.1)[1093] | (1.6)[1926] | (2.3)[840] | (2.3)[1099] | (2)[2029] | (239)[2143] | | Myanmar | 12.0 | 10.8 | 11.5 | 11.5 | 12.6 | 21.4 | | | (1.8)[552] | (1.6)[1196] | (2)[590] | (1.8)[568] | (1.8)[1117] | (36.6)[1239] | | Nigeria | 9.3 | 7.0 | 7.5 | 7.5 | 9.5 | 8.3 | | | (1.9)[397] | (3.4)[1588] | (3.3)[328] | (2.7)[439] | (2.1)[1880] | (27.9)[2646] | | Pakistan | 12.6 | 10.6 | 12.4 | 12.0 | 12.8 | 50.8 | | | (1.8)[1069] | (1.7)[1765] | (2.6)[1085] | (2.2)[1090] | (2)[1759] | (94.8)[2485] | | Philippines | 13.3 | 11.6 | 11.7 | 12.8 | 13.8 | 33.0 | | | (2.2)[787] | (2)[1110] | (2.4)[302] | (2.6)[790] | (2.4)[1173] | (74.8)[1308] | | Russian | 13.4 | 11.7 | 12.5 | 12.6 | 13.7 | 80.9 | | Federation | (1.9)[1271] | (1.7)[3746] | (2.5)[963] | (2.2)[1329] | (1.8)[4149] | (302.5)[5543] | | Thailand | 12.7 | 11.3 | 10.8 | 11.4 | 12.9 | 43.8 | | | (2)[543] | (1.6)[832] | (2.4)[575] | (2.6)[544] | (2)[884] | (92)[951] | | Turkey | 14.3 | 12.2 | 13.0 | 12.8 | 14.6 | 68.6 | | | (1.6)[1020] | (1.7)[1912] | (2.3)[1215] | (1.8)[1089] | (1.7)[2395] | (149.8)[3007] | | Vietnam | 13.0 | 11.3 | 12.6 | 12.4 | 13.6 | 96.4 | | | (1.9)[522] | (1.7)[882] | (2.3)[448] | (2.5)[523] | (1.9)[946] | (172.8)[992] | | Total | 12.9 | 11.1 | 12.0 | 12.5 | 13.2 | 95.1 | | | (2.1)[27010] | (2)[47139] | (2.5)[22467] | (2.4)[27400] | (2.2)[48036] | (288.3)[54553] | | Source: Authors’ estimates. |
| Table A.2: Robustness Check for Efficiency | | (5 per cent sample truncated on both side based on value added) H0: Mean 1 (full sample) = Mean 2 (truncated sample) | | Sector Id | Sector Name | Mean 1 | Mean 2 | Difference (Mean 1 -Mean 2) | S.E. 1 | S.E. 2 | Difference (S.E. 1 - S.E. 2) | t-stat (t) | Pr (|T| > |t|) | | 1 & 3 | Textile | 0.75 | 0.75 | 0.005 | 0.003 | 0.003 | -0.0003 | 1.39 | 0.16 | | 5 | Food | 0.72 | 0.72 | 0.004 | 0.003 | 0.004 | -0.0003 | 0.78 | 0.43 | | 7 | Metals and Machinery | 0.75 | 0.74 | 0.014 | 0.002 | 0.003 | -0.0003 | 3.87 | 0.00 | | 8 | Electronics | 0.73 | 0.71 | 0.020 | 0.005 | 0.006 | -0.0010 | 2.46 | 0.01 | | 9 | Chemicals and Pharmaceuticals | 0.73 | 0.72 | 0.009 | 0.004 | 0.005 | -0.0006 | 1.36 | 0.17 | | 11 | Wood and Furniture | 0.70 | 0.70 | -0.006 | 0.007 | 0.007 | -0.0004 | -0.61 | 0.54 | | 12 | Non-metallic and Plastic | 0.75 | 0.75 | 0.007 | 0.003 | 0.003 | -0.0003 | 1.68 | 0.09 | | 15 | Auto | 0.78 | 0.76 | 0.019 | 0.004 | 0.005 | -0.0006 | 3.13 | 0.00 | | 2 & 16 | Misc. Manufacturing | 0.77 | 0.78 | -0.005 | 0.006 | 0.006 | -0.0003 | -0.63 | 0.53 | | 21 | Retail and Wholesale Trade | 0.77 | 0.77 | 0.005 | 0.009 | 0.010 | -0.0009 | 0.42 | 0.67 | | 22 | Hotels and Restaurants | 0.68 | 0.69 | -0.006 | 0.011 | 0.010 | 0.0002 | -0.39 | 0.70 | | 23 | Other Services | 0.79 | 0.78 | 0.013 | 0.005 | 0.006 | -0.0005 | 1.66 | 0.10 | Note: S.E.: Standard Error. Mean 1 and S.E. 1 pertain to full sample. Mean 2 and S.E. 2 pertain to truncated sample.
Misc. Manufacturing includes leather (Sector Id 2).
Source: Authors’ estimates. |
| Table A.3: Security Cost - A Proxy for Risks (Tobit Estimates) | | | (1) | (2) | | Without FE | Country x Sector FE | | Dependent Variable: Security costs (Per cent of Annual Sales) | | Proportion of Loans Requiring Collateral | 0.010*** | 0.0100*** | | | (0.0015) | (0.0015) | | Number of Observations | 11123 | 11123 | | Pseudo R-Sq | 0.0220 | 0.0010 | Note: Standard errors in parentheses.
* p < 0.10, ** p < 0.05, *** p < 0.01
Source: Authors’ estimates. |
| Table A.4: Firms’ Spending and Worker Composition on Access to External Finance Category | | | (1) | (2) | | Variable | Tobit: Proportion of Non-production Workers in Permanent Workers | Probit: Firm Spending on Formal Trainings | | Access: Only long-term | 0.31 | 0.32*** | | (Dummy = 1) | (0.41) | (0.065) | | Access: Long & short-term | 0.41** | 0.21*** | | (Dummy = 2) | (0.18) | (0.042) | | Number of Observations | 32,449 | 53,018 | | R-sq./Pseudo R-sq. | 0.0089 | 0.1529 | Note: Standard errors in parentheses.
* p < 0.10, ** p < 0.05, *** p < 0.01
Regressions control for unobserved country, year and sector effects.
Firms with no access to external finance (Dummy = 0) serve as the base category.
The categorical dependent variable takes value 0 for enterprises with no access to external finance, 1 for enterprises which have access to finance only for long-term investment and equity sales, and 2 for enterprises whose access to finance extends to short-term capital needs (i.e., either for both long and short- term capital needs or only short-term).
Source: Authors’ estimates. |
| Table A.5: Firms’ Worker Composition and Access to External Finance Category: Tobit Estimates | | Variable | Proportion of Skilled Workers out of all Workers | Proportion of Workers offered Formal Training within a Firm | | (1) | (2) | (3) | (4) | | No Access vs. Only long-term | Only Long-term vs. Long & short-term | No Access vs. Only long-term | Only Long-term vs. Long & short-term | | Access to Finance: | 15.0** | 22.2*** | 81.5*** | 11.9 | | Prob.# | (6.19) | (5.61) | (14.5) | (10.8) | | Constant | 86.4*** | 57.8*** | 21.1 | 69.1*** | | | (5.93) | (5.07) | (14.2) | (10.5) | | Number of Observations | 12,499 | 14,597 | 2,773 | 3,887 | | Pseudo-R Sq. | 0.0216 | 0.0149 | 0.0442 | 0.0290 | Note: Standard errors in parentheses.
* p < 0.10, ** p < 0.05, *** p < 0.01
#: Estimated probabilities from a multinomial logit model where the categorical variable indicating Access to External Finance Category is regressed on the four instruments used in the regressions, viz., 1. the number of electrical outages faced by an enterprise in a month, 2. whether an enterprise had women among their top managers, 3. percentage of annual sales spent on security cost, and 4. number of years of experience by the top manager of the firm in the sector. The categorical dependent variable in the multinomial logit model takes value 0 for enterprises with no access to external finance, 1 for enterprises which has access to finance only for long-term investment and equity sales, and 2 for enterprises whose access to finance extends to short-term capital needs (i.e., either for both long and short-term capital needs or only short-term).
Regressions control for unobserved country, year and sector effects.
Source: Authors’ estimates. |
|