The global banking sector remained resilient as reflected in strong capital buffers, high leverage ratio and improved profitability. Despite its current strength, global GDP growth is expected to slow down amidst trade policy uncertainty, while inflation to moderate. Central banks have responded with monetary policy easing. Global regulatory and supervisory initiatives have been directed at addressing concerns emanating from interconnectedness of banks and non-banks as well as integration of artificial intelligence and crypto-assets into the financial system. Policy makers need to remain vigilant to the evolving risks in the financial system amidst rising trade and geopolitical uncertainty, technological innovations and climate risks. Introduction II.1 The global economy showed resilience during 2025, supported by front-loaded imports, easing financial conditions and stimulative fiscal stance in major economies, albeit with some signs of slowdown in the second half. Inflation remained benign, aided by softer energy prices and subdued demand. Trade policy uncertainty, geoeconomic fragmentation, geopolitical tensions and high debt levels, however, weigh on the economic outlook. II.2 The global banking sector successfully navigated these challenges, benefiting from strong capital buffers and improved profitability. Global financial markets remained volatile, albeit with low funding spread and rebound in equity prices. The role of non-bank financial intermediaries (NBFIs) is growing in the capital market and credit intermediation. Yet, valuation of risky assets appears stretched amid slowing global growth and expansion in banks’ exposure to NBFIs. These global shifts can create vulnerabilities in the financial system. With debt continuing to shift towards the government sector and exposure of banks and non-banks remaining elevated, stress in sovereign bond markets can be transmitted directly to banks. The growing size of NBFIs along with banks’ rising exposure raises concerns about risk-taking and interconnectedness in the financial system. Global foreign exchange markets remain vulnerable to macrofinancial uncertainty, raising risks of spillover into other asset classes and tightening of financial conditions. Policymakers remain attentive to risks from leverage, liquidity mismatches, and cross-border spillovers, even as financial innovations such as stablecoins and the use of artificial intelligence (AI) reshape market structures and supervisory practices. In this environment, strengthening of financial sector regulation and supervision remains crucial for financial stability. II.3 Against this backdrop, this chapter covers developments in the global banking sector. Section 2 reviews current global macroeconomic conditions. Section 3 discusses recent global banking policy developments. The financial performance of the global banking sector is examined in Section 4, followed by an analysis of world’s top 100 banks ranked by Tier 1 capital positions in Section 5. Section 6 concludes with an overall assessment. 2. Global Macroeconomic Conditions II.4 Global growth is projected to decelerate marginally to 3.2 per cent in 2025 and 3.1 per cent in 2026 from 3.3 per cent in 2024, amidst trade and geopolitical uncertainty.1 This reflects the resilience of the global economy, which is partly supported by front-loading of trade and investment, and fiscal expansion in some major economies. Nonetheless, global growth remains below the pre-pandemic historical average of 3.7 per cent.2 The risks to the outlook also remain tilted to the downside because of trade policy uncertainty and protectionism, which can dampen investment and disrupt supply chains. Emerging market and developing economies (EMDEs) are projected to grow by 4.2 per cent in 2025 and 4.0 per cent in 2026, as compared with 1.6 per cent for the advanced economies (AEs) (Chart II.1a). Easier financial conditions benefit EMDEs as they continue to demonstrate resilience on the back of improving policy frameworks. II.5 Global inflation remains benign, with headline inflation projected to decline to 4.2 per cent in 2025 and further to 3.7 per cent in 2026, supported by subdued demand and softer energy prices. Nonetheless, inflation is projected to converge back to target earlier in AEs (2.2 per cent in 2026) as compared to EMDEs (4.7 per cent) (Chart II.1b). II.6 Central banks responded to the easing of inflation and moderation in growth by reducing policy rates since the second half of 2024. This was a significant reversal from the extended period of monetary tightening by major central banks to counter the surge in inflation during 2022-2023. The policy path taken by central banks, however, varies across countries, driven by stickiness of inflation above target as well as growth and labour market concerns. The European Central Bank (ECB) reduced policy rates by a cumulative 250 basis points (bps) since its first rate cut in June 2024, while the Bank of England reduced rate by a total of 150 bps since the onset of its easing cycle in August 2024. The US Federal Reserve started easing policy rate in September 2024, with a cumulative reduction of 175 bps so far. In contrast, the Bank of Japan adopted a monetary tightening cycle, with a cumulative increase of 85 bps since March 2024 to curb rising inflation (Chart II.2a). Amongst the BRICS group, South Africa cut the policy rate in September 2024, followed by India in February 2025 and Russia in June 2025. After a pause since August 2023, China further reduced the rate in July 2024. Brazil, however, adopted a monetary tightening cycle since September 2024, increasing the policy rate by 450 bps, to bring inflation down to its target (Chart II.2b). 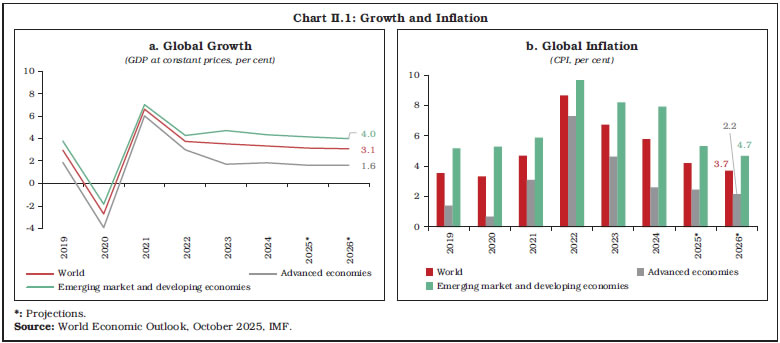 II.7 World trade remained robust despite protectionism, driven by front-loaded imports and exports in response to proposed high US import tariffs. Global trade volume is projected to grow faster at 3.6 per cent in 2025, before slowing down to 2.3 per cent in 2026.3 AEs are projected to run a deficit in their current account in 2025 as against a surplus in 2024. This is mainly on account of continued trade deficit in the US and lowering surplus in the Euro area. In EMDEs, the current account surplus is projected to remain unchanged at 1.0 per cent of GDP in 2025, before declining to 0.6 per cent in 2026 (Chart II.3a). This is partly due to pre-emptive trade ahead of prospective tariffs widening the surplus for China. II.8 The general government gross debt for AEs is projected to increase marginally to 110.2 per cent of GDP in 2025 and further to 111.8 per cent of GDP in 2026. The EMDEs are also under rising fiscal strain with the debt-GDP ratio projected to rise to 72.7 per cent in 2025 and 75.8 per cent in 2026, due to higher interest payments and growth moderation (Chart II.3b).
3. Global Banking Policy Developments II.9 The global outlook has become more challenging amidst increased trade and economic policy uncertainty. The COVID-19 induced market turmoil of March 2020, and the banking stress of March 2023 demonstrated that vulnerabilities could unravel quickly, reinforcing the importance of vigilance, proactive policy responses and international cooperation to maintain global financial stability. Regulators and central banks are taking measures to mitigate systemic risks emanating from the growing size of NBFIs and their deepened ties with banks, integration of artificial intelligence and crypto-assets into the financial system, and the looming threat of climate change. 3.1 Building Resilient Financial Institutions4 II.10 Underlining the importance of prudent regulation and effective supervision, the Basel Committee on Banking Supervision (BCBS) has prioritised implementation of all the aspects of the Basel III framework effective January 1, 2023. As of September 2025, most member jurisdictions have published their rules implementing the final elements of Basel III. Since end-September 2024, the final Basel III standards became effective in more than 40 per cent of the 27 member jurisdictions. The revised credit risk and operational risk standards, as well as the output floor, have now become effective in around 80 per cent of the member jurisdictions, while the credit valuation adjustment standard in nearly 70 per cent, and the revised market risk standards in nearly 40 per cent. II.11 There has been further progress in other Basel III standards that had implementation dates before January 1, 2023. Since end-September 2024, one additional jurisdiction has implemented margin requirements for non-centrally cleared derivatives, while another has completed implementing the interest rate risk in the banking book. Additionally, two member jurisdictions have published the final regulations on crypto-assets. To enhance transparency and accountability, the Federal Reserve Board proposed revising its supervisory stress testing framework by publishing the stress test models and scenarios for public comments. 3.2 Cyber Resilience II.12 In an increasingly digital and inter connected environment, cyber and operational incidents have become a growing threat to financial stability. Supervisory authorities depend on timely incident reporting to track disruptions and coordinate responses, but fragmented frameworks across jurisdictions pose challenges. To address this gap, the Financial Stability Board (FSB), in April 2025, published its final report on the Format for Incident Reporting Exchange (FIRE), introducing a standardised reporting format to reduce fragmentation and ease compliance for internationally active firms.5 This has been developed in close collaboration with the private sector and is also designed to be applicable to third-party service providers and entities outside the financial sector. To support global implementation, the FSB has also issued a taxonomy package that includes a data model, which enables machine-readable formats of FIRE.6 3.3 G20 Financial Regulatory Reforms on Securitisation II.13 The regulatory reforms introduced after the global financial crisis (GFC) aimed to improve transparency, address conflicts of interest, strengthen the regulatory capital treatment for banks’ securitisation exposures and align incentives associated with securitisation. The FSB, based on the feedback received on the consultation report issued in July 2024, published a report evaluating these reforms in January 2025. It is noted that regulatory reforms improved the resilience of securitisation markets, with no strong evidence of material negative impact on financing activity.7 Complex structures that played a role in the GFC, such as securitisation of subprime assets, collateralised debt obligations and re-securitisations, have significantly declined, while market transparency has improved. Further, the assessment finds that the reforms appear to have prompted a shift in the risk from banks to the NBFI sector, as banks have moved towards investing in higher-rated tranches. This shift is partly driven by the growing role of non-banks and their increased participation in the securitisation markets. 3.4 Vulnerabilities in Non-bank Commercial Real Estate Market8 II.14 The commercial real estate (CRE) market has experienced significant stress, driven by weak demand for offices and retail space since the pandemic and higher borrowing costs, following monetary policy tightening in 2022-2023. While banks continue to be the main source of financing for CRE, some jurisdictions have a sizeable share of non-bank investors’ participation, especially property funds and real estate investment trusts. II.15 The FSB highlighted three main vulnerabilities associated with these non-bank CRE investors – liquidity mismatches in open-ended funds, high financial leverage, and opacity in asset valuations. The report also highlighted a fourth broader vulnerability due to interlinkages between banks and these non-bank CRE investors, raising the potential for spillover to the banking system. 3.5 Non-bank Financial Intermediation II.16 The role of NBFIs in financing the real economy has expanded in the last decade, and the sector accounted for 51.0 per cent of the global financial assets in 2024. The experience of the global financial crisis of 2008, the market turmoil of March 2020, Archegos failure of March 2021 and commodities markets turmoil in 2022 demonstrate that NBFIs can also create or amplify systemic risk. The FSB highlights three main forms of linkages between banks and NBFIs: (i) funding and deposit relationships, where non-banks place deposits with banks; (ii) lending, repo and other credit exposures from banks to non-banks; and (iii) holdings of bank-issued securities by investment funds, insurers and pension funds.9 The FSB is collaborating with standard-setting bodies across a wide range of areas to assess and address vulnerabilities that could lead to systemic risk. The policy objective has been to reduce excessive spikes in the demand for liquidity; enhance the resilience of liquidity supply in stress; and improve the risk monitoring and preparedness of authorities and market participants. The implementation of reforms in this direction continues to advance, albeit at an uneven pace across jurisdictions. II.17 Over time, the NBFI sector has become more diverse and increasingly intricate, with business models and strategies that are constantly evolving and frequently employing leverage. The vulnerabilities from leverage and liquidity mismatches in parts of the NBFI sector that gave rise to market stress episodes continue with the global financial system.10 The FSB recommends that authorities should: (i) have a domestic framework in place to identify and monitor financial stability risks created by NBFI leverage; and (ii) take steps to select, design and calibrate policy measures to address the identified financial stability risks in a flexible, targeted and proportionate way. II.18 The incidents also highlight the need for policy adjustments to deal with liquidity strains in the NBFI sector, arising from spikes in margin and collateral calls in times of market stress.11 The FSB sets out steps to enhance the liquidity preparedness of non-bank market participants for margin and collateral calls in centrally and non-centrally cleared derivatives and securities markets. II.19 The FSB has identified several data-related challenges that impede authorities’ ability to effectively assess vulnerabilities. Accordingly, it has established a Non-bank Data Task Force in July 2025 to strengthen authorities’ ability to identify, assess and mitigate financial stability risks emanating from the non-bank sector. The FSB also puts out a workplan to address non-bank data challenges with two areas of high priority, viz., leveraged trading strategies in core financial markets and private finance.12 3.6 Climate and Nature-related Risks II.20 Climate transition plans have gained prominence as the means for financial institutions and non-financial companies to communicate their strategies and approaches to manage climate-related risks. As part of its roadmap for addressing financial risks from climate change, the FSB published a report in January 2025, assessing the relevance of transition plans for financial stability.13 The report highlights the role of transition plans in addressing climate-related financial risks through three channels – contributing to better risk management, informing investment decisions and supporting authorities’ macro-monitoring of transition and physical risks both in the financial system and the real economy. As they provide forward-looking information, transition plans hold potential for enhancing financial stability. 3.7 Cross-border Payments II.21 In 2020, G20 launched a roadmap for faster, cheaper, more transparent and inclusive cross-border payments and endorsed a set of global quantitative targets in this regard. The FSB, in October 2025, published the consolidated progress report on this G20 roadmap.14 The report has highlighted that while a majority of the roadmap actions are completed, these efforts have not yet translated into tangible improvements, with key performance indicators for 2025 showing only a slight improvement. The access to cross-border payments remained broad, with slight improvement in transparency of information to end-users. Although the global speed of wholesale cross-border payments improved, wide variations across regions persist with South Asia lagging in terms of speed of receiving wholesale payments. The average global cost of such payments varies widely across regions – lowest in Asia-Pacific and highest in Sub-Saharan Africa. Going forward, modernising domestic payment infrastructure and providing a level playing field for bank and non-bank payment service providers is essential to enhance cross-border payments. 3.8 Crypto-assets II.22 Stablecoins – crypto-assets designed to maintain a stable value by referencing one or more fiat currencies – have become a key component of the digital asset ecosystem. The market capitalisation of stablecoins reached approximately US$ 300 billion at end-September 2025.15 The increasing adoption of stablecoins raises concerns for both monetary policy and financial stability, particularly in EMDEs as their widespread use can weaken central banks’ control over money supply and interest rates. Proliferation of stablecoins also creates risk of currency substitution, weakening the effect of monetary policy transmission and banking disintermediation.16 | Table II.1: Regulations for Stablecoins in Select Economies | | Country | Regulation | Key Features | | 1 | 2 | 3 | | United States | Guiding and Establishing National Innovation for U.S. Stablecoins (GENIUS) Act17 | Dual federal-state regulation with 100 per cent backup in terms of issuers’ holding of highly liquid assets. | | EU | Markets in Crypto-Assets (MiCA) Regulation, 202418 | Classifies stablecoins into two categories – asset-referenced tokens and e-money tokens. Issuers must obtain licenses to operate within EU jurisdictions. | | Singapore | Monetary Authority of Singapore (MAS) Stablecoin Regulatory Framework, 202319 | Applicable to single-currency stablecoins, pegged to the Singapore dollar or any G10 currency, that is issued in Singapore. | | Japan | Regulatory Framework for Crypto-assets and Stablecoins20 | Only banks, fund transfer service providers, and trust companies are entitled to issue digital-money type stablecoins. | II.23 According to the Bank for International Settlements (BIS), any form of money should pass three tests to serve as the backbone of the monetary system – singleness, elasticity and integrity. Stablecoins perform poorly when assessed against these standards. Stablecoins often trade at varying exchange rates, thus undermining singleness. They also fail the elasticity test because the issuer’s balance sheet cannot be expanded at will. Furthermore, as a digital bearer instrument on borderless public blockchains, stablecoins circulate without issuer oversight, compromising integrity and raising concerns about their use for financial crimes, such as money laundering and terrorism financing.21 II.24 Stablecoins are evolving under formal regulatory oversight, and many countries have put in place stablecoin regulations to safeguard investors (Table II.1). The FSB released a follow-up report of its global regulatory framework governing crypto-asset activities in November 2025. The report revealed that while progress has been made in regulating crypto-asset activities and global stablecoins, significant gaps remain. Global stablecoin regulation is fragmented, and cross-border coordination is inadequate, hindering effective oversight and timely responses to systemic risks.22 3.9 Artificial Intelligence and Tokenisation II.25 Artificial intelligence (AI) has the potential to reshape the financial system by fostering innovation, boosting efficiency and strengthening resilience. It can help with regulatory compliance, enable advanced data analytics, produce personalised financial products and enhance fraud detection. The FSB, however, identified key AI-related vulnerabilities which may have implications for financial stability.23 It identified a range of indicators to support monitoring of AI adoption and related vulnerabilities in the financial system. These include measuring the extent of AI adoption in the financial institution, concentration of third-party AI service providers and monitoring AI-related cyber events.24 II.26 At end-2024, the Irving Fisher Committee on Central Bank Statistics conducted a survey covering six dimensions to assess the current state of AI adoption: (i) scope and interest; (ii) expectations; (iii) applications; (iv) organisational policies, governance and risks; (v) IT stack; and (vi) collaborative strategies.25 The survey highlighted two key findings: first, effective deployment of AI requires robust governance frameworks, which are still evolving; and second, implementation of AI entails trade-offs in IT infrastructure, as rising computational demands raise costs and cloud-based solutions while offering scalability, pose data security and sovereignty challenges. Another important issue relates to the choice of closed versus open-source AI models. II.27 Tokenisation — the recording of claims on real or financial assets from traditional ledgers onto programmable platforms — is emerging as a key element of next-generation financial market infrastructure. The BIS identified tokenisation as the next step in the evolution of monetary and financial system, as it enables the integration of messaging, reconciliation, and asset transfer into a single operation.26 The report highlights its potential to reduce friction in existing systems and introduce more flexible and automated contracting mechanisms. In cross-border payments, tokenisation could streamline correspondent banking by replacing the current chain of intermediaries and sequential account updates with a single, integrated process. It can also improve the functioning of capital markets through better collateral management, margining, and delivery-versus-payment processes. II.28 Tokenisation initiatives are gaining momentum globally. A BIS study27 assessed the case for tokenised government bonds, highlighting their potential to become a foundational element in tokenised financial ecosystems, central bank reserves and commercial bank money. Tokenisation of government bonds, which accounts for the largest segment of global financial assets in 2024 with an outstanding amount of around US$ 80 trillion, could bolster trust, enhance settlement efficiency, and support monetary operations. The study, however, emphasised that these benefits remain contingent on scalability, regulatory clarity, and supporting infrastructure. 4. Performance of the Global Banking Sector II.29 At end-December 2024, bank credit to private non-financial sector decelerated across advanced and emerging economies, with credit growth turning negative in AEs (Chart II.4a). Even though monetary policy started easing in H2:2024, the tight credit conditions weighed on activity through 2024, due to the long lags in transmission.28 In H1:2025, credit growth picked up in both groups, albeit with a variation across countries. Among emerging market economies (EMEs), Brazil and South Africa were exceptions where credit growth increased in 2024 compared to 2023 (Chart II.4b and c). Brazil witnessed strong credit growth despite a tight monetary policy due to high income growth and success in expanding financial inclusion.29 4.1 Asset Quality II.30 In 2024, the asset quality of banks, measured by the ratio of non-performing loans to total gross loans (NPL ratio), deteriorated for select AEs (Table II.2). Euro area banks’ NPL ratios remained low despite a slight uptick in some economies in 2024, driven mainly by the corporate loan book (notably commercial real estate and small and medium loans).30 For most EMDEs, asset quality showed improvement including for Vietnam, which continued to have high NPL ratio attributable to distress in key sectors, particularly real estate.31 4.2 Provision Coverage Ratio II.31 A higher provision coverage ratio (PCR) indicates higher resilience of the bank to loan losses. Among select AEs, banks in the US maintained the highest PCR, despite some moderation in 2024 (Chart II.5a). The ratio, however, remained below 50 per cent in other AEs. Among EMDEs, banks in China maintained high PCR and the ratio improved in 2024. (Chart II.5b). | Table II.2: Asset Quality | | (NPL Ratio) | | (Per cent) | | Country | 2015 | 2020 | 2023 | 2024 | Q1:2025 | Q2:2025 | | 1 | 2 | 3 | 4 | 5 | 6 | 7 | | Advanced Economies | | Australia | 0.89 | 1.11 | 0.85 | 0.99 | 1.06 | N.A. | | Canada | 0.52 | 0.53 | 0.45 | 0.57 | 0.65 | 0.68 | | Japan | 1.47 | 1.22 | 1.28 | 1.10 | 1.10 | N.A. | | UK | 1.01 | 0.98 | 0.98 | 1.02 | 0.98 | 0.96 | | US | 1.47 | 1.07 | 0.85 | 0.97 | 0.95 | 0.93 | | Euro area | | France | 3.52 | 2.38 | 2.06 | 2.09 | 2.07 | N.A. | | Germany | N.A. | N.A. | 1.54 | 1.77 | 1.73 | 1.79 | | Italy | 18.06 | 4.36 | 2.71 | 2.77 | N.A. | 2.71 | | Netherlands | 2.71 | 1.88 | 1.55 | 1.64 | 1.58 | 1.48 | | Spain | 5.09 | 2.85 | 3.06 | 2.87 | 2.82 | 2.69 | | Emerging Market and Developing Economies | | Brazil | 2.85 | 1.87 | 2.84 | 2.72 | 3.08 | N.A. | | China | 1.67 | 1.84 | 1.59 | 1.50 | 1.51 | 1.49 | | India | 5.88 | 7.94 | 3.36 | 2.50 | 2.34 | 2.35 | | Indonesia | 2.32 | 2.64 | 1.96 | 1.94 | 2.01 | 2.05 | | Mexico | 2.60 | 2.56 | 2.08 | 2.02 | 2.00 | 2.10 | | Philippines | 1.89 | 3.53 | 3.19 | 3.20 | 3.26 | 3.27 | | Russia | 8.38 | 8.16 | 4.51 | 4.58 | N.A. | N.A. | | South Africa | 3.12 | 5.18 | 4.72 | 4.54 | 4.60 | N.A. | | Thailand | 2.68 | 3.23 | 2.76 | 2.81 | 2.92 | N.A. | | Vietnam | 2.76 | 1.87 | 5.41 | 4.85 | 4.91 | N.A. | N.A.: Data not available.
Notes: 1. Data for 2024 for Russia pertain to Q1:2024.
2. Annual data for Japan pertain to the first quarter of next year.
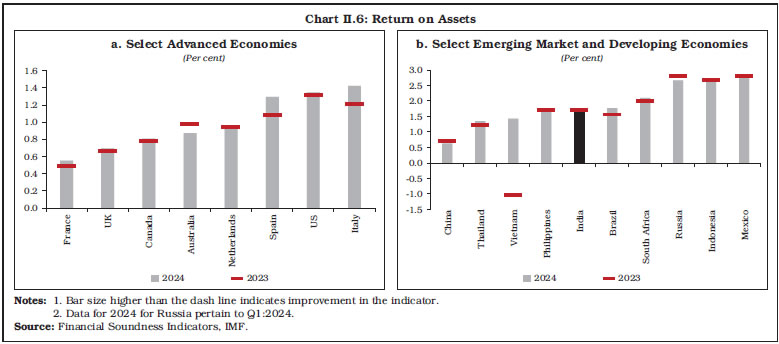
Source: Financial Soundness Indicators, IMF. | 4.3 Bank Profitability II.32 Profitability, measured by return on assets (RoA), increased in most AEs in 2024, with slight moderation in Australia and Netherlands (Chart II.6a). EMDEs also generally showed an improvement in profitability, albeit with a few exceptions (Chart II.6b). In 2024, widening net interest margins and, for larger banks, strong performance from asset management, advisory, and trading services expanded revenues. At the same time, the reduction of loan loss provisions has been a substantial driver of RoA across all regions.32 4.4 Capital Adequacy II.33 Banks have substantially increased their capital levels, enhancing their ability to absorb losses. The capital adequacy, measured by regulatory capital to risk-weighted assets ratio (CRAR), remains above the Basel III norms in all major economies. The IMF’s global stress test shows that the global banking sector remains broadly resilient. However, under the scenario of severe stagflation, common equity Tier 1 capital (CET1) ratio of banks representing about 18 per cent of global bank assets falls below 7 percent.33 This is an improvement from 2023 stress test results due to improved capitalisation across most regions. 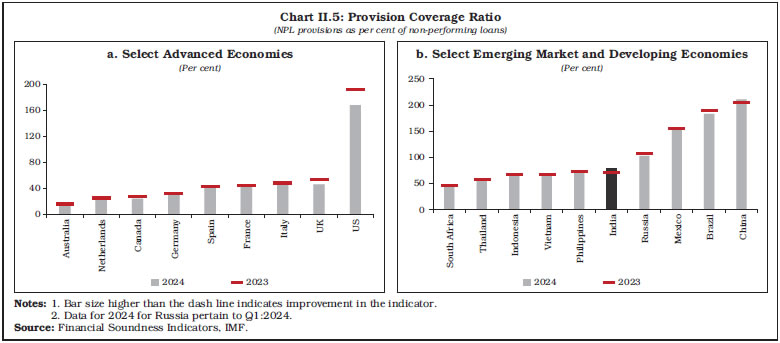
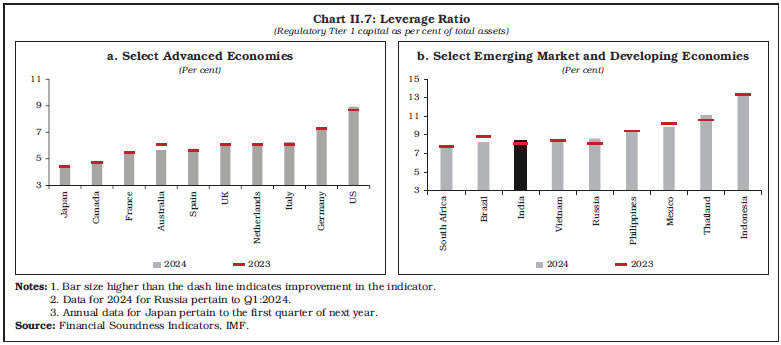
 II.34 Amongst AEs, banks in the UK maintained high capital buffers, while banks in the US maintained lower CRAR, albeit with some improvement in 2024. In the Euro area, high internal capital generation in the form of retained earnings continued to have a strong positive effect on banks’ capital ratios.34 The capital ratios in EMDEs show a mixed pattern, with Indonesian banks maintaining CRAR above 25 per cent in 2024 (Table II.3). 4.5 Leverage Ratio II.35 Leverage ratio, defined as regulatory Tier 1 capital to total assets, measures the extent to which bank assets are funded by equity, serving as a safeguard against excessive risk taking. Banks in both AEs and EMDEs maintained leverage ratio well above the minimum Basel III requirement of 3.0 per cent. Among AEs, banks in the US continued to maintain high leverage ratio (Chart II.7a). The ECB, in December 2024, subjected banks to increased capital on account of the risk of excessive leverage. Bank-specific mandatory requirements under the leverage ratio Pillar 2 requirement ranged between 10 and 40 basis points, in addition to the minimum required 3 per cent leverage ratio.35 Banks in EMDEs generally maintained higher leverage ratio than AEs and the ratio improved in many economies in 2024 (Chart II.7b). | Table II.3: Regulatory Capital to Risk-weighted Assets Ratio | | (Per cent) | | Country | 2015 | 2020 | 2023 | 2024 | Q1:2025 | Q2:2025 | | 1 | 2 | 3 | 4 | 5 | 6 | 7 | | Advanced Economies | | Australia | 13.8 | 17.6 | 19.9 | 20.2 | 20.5 | N.A. | | Canada | 14.2 | 16.1 | 17.1 | 16.8 | 16.9 | 17.5 | | Japan | 15.9 | 16.6 | 16.4 | 16.7 | 16.7 | N.A. | | UK | 19.6 | 21.6 | 21.3 | 21.3 | 20.7 | 20.5 | | US | 14.1 | 16.3 | 15.9 | 16.3 | 16.3 | 16.8 | | Euro Area | | France | 16.4 | 19.5 | 19.5 | 19.8 | 19.8 | N.A. | | Germany | N.A. | N.A. | 19.9 | 20.5 | 20.1 | 20.5 | | Italy | 14.8 | 19.3 | 19.4 | 19.7 | N.A. | 19.8 | | Netherlands | 20.1 | 22.8 | 21.1 | 20.9 | 21.2 | 21.6 | | Spain | 14.7 | 17.0 | 17.1 | 17.5 | 17.8 | 17.8 | | Emerging Market and Developing Economies | | Brazil | 16.4 | 19.1 | 17.9 | 17.1 | 17.0 | N.A. | | China | 13.5 | 14.7 | 15.1 | 15.7 | 15.3 | 15.6 | | India | 12.7 | 15.6 | 15.6 | 16.4 | 17.0 | 17.4 | | Indonesia | 18.9 | 22.1 | 25.8 | 25.1 | 23.7 | 24.3 | | Mexico | 15.0 | 17.7 | 18.8 | 19.1 | 19.9 | 20.0 | | Philippines | 15.3 | 16.3 | 16.3 | 15.8 | 15.9 | 15.7 | | Russia | 12.7 | 13.8 | 13.1 | 12.9 | N.A. | N.A. | | South Africa | 14.2 | 16.6 | 16.1 | 16.3 | 16.1 | N.A. | | Thailand | 17.1 | 19.8 | 19.6 | 20.1 | 20.4 | N.A. | | Vietnam | 12.8 | 11.1 | 11.7 | 12.3 | 12.4 | N.A. | N.A: Data not available.
Notes: 1. Data for 2024 for Russia pertain to Q1:2024.
2. Annual data for Japan pertain to the first quarter of next year.
Source: Financial Soundness Indicators, IMF. |
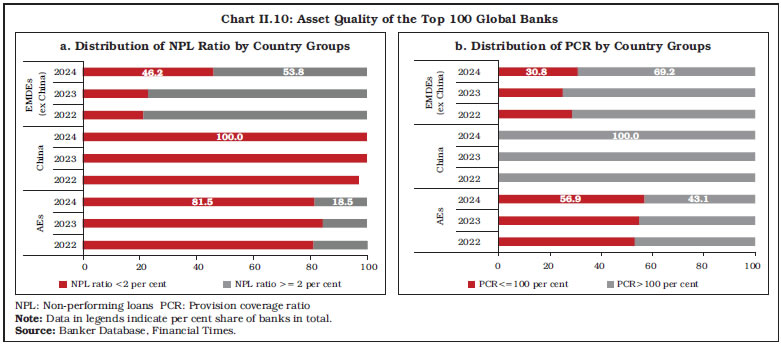
 4.6 Financial Market Indicators II.36 Tariffs and trade policy uncertainty are associated with increased financial market volatility. After abrupt tightening post April 2, 2025 tariff announcement, the rebound in asset prices globally alongside a weaker dollar eased financial conditions around the world. Bank equity prices, particularly in the Euro area, fell sharply following the US tariff announcement on April 2, 2025, reflecting investor concerns about rising trade tensions and their potential impact on global growth and financial stability. However, post a 90-day pause on implementation of tariffs announced on April 9, the stock indices showed signs of recovery. Recently, stronger-than-expected European bank earnings, which were boosted by trading on market volatility, have supported their stock prices (Chart II.8a).36 After the recent peak in April 2025, following the tariff announcement, the credit default swap (CDS) spreads have narrowed, reflecting improved market sentiment and lower perceived default risk (Chart II.8b). 5. World’s Largest Banks II.37 The list of top 100 global banks, based on their Tier 1 capital, continues to be dominated by China in 2024. (Chart II.9a). In terms of total assets, the distribution shifted between 2020 and 2024, with AEs holding a smaller share, and both China and other EMDEs increasing their respective shares (Chart II.9b). The trend of declining international business and growing focus on local markets continued for the largest banks in AEs. 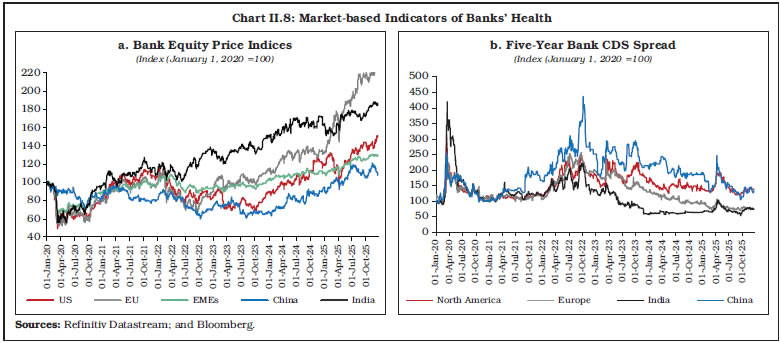 II.38 In 2024, the asset quality of banks in EMDEs improved, as reflected in the lower proportion of banks with NPL ratios greater than or equal to 2 per cent as compared to the previous year. In contrast, there was a marginal deterioration in the asset quality of banks in AEs. Additionally, all Chinese banks in the top 100 global banks list consistently maintained their NPL ratios below 2 per cent (Chart II.10a). The provision coverage ratio, an indicator of loss absorbing capacity, of all Chinese banks in the top 100 banks, remained above 100 per cent. In other EMDEs, the share of banks with PCR more than 100 per cent decreased to 69.2 per cent in 2024 from 75.0 per cent a year ago. In contrast, more than 50 per cent of the banks in AEs had PCR below 100 per cent. (Chart II.10b). 
 II.39 The global banking system showed resilience as banks remained well capitalised. In 2024, the modal class for capital adequacy ratio for banks in EMDEs (excluding China) and AEs was greater than or equal to 16 per cent, while the modal class of banks in China remained in the 12–14 per cent band. China and other EMDEs showed an increase in the share of banks in the highest capital bracket in 2024 vis-à-vis 2020 (Chart II.11a). Leverage ratio, calculated as ratio of Tier 1 capital to total assets, of large global banks strengthened in 2024. Banks in China and other EMDEs showed a notable improvement in leverage ratios, with modal class shifting upwards. In AEs, the modal class remained at four to six per cent (Chart II.11b). II.40 In terms of profitability, top banks in EMDEs (excluding China) continued to demonstrate superior profitability than AE and Chinese counterparts. EMDEs had higher concentration of banks with return on assets (RoA) in the range of one to two per cent in 2024. In China, about 95 per cent of the banks had RoA in the range of zero to one per cent (Chart II.11c). Cost-to-income ratio is a key measure of operational efficiency of the bank. Chinese banks demonstrated greater efficiency than their counterparts in both emerging and advanced economies, as indicated by their consistently lower cost-to-income ratio (Chart II.11d). 6. Overall Assessment II.41 The global macroeconomic conditions remained in a state of flux amidst trade tensions and geoeconomic fragmentations. The risks to growth outlook remain tilted to the downside. With growth moderating and inflation falling, most central banks continued with monetary policy easing cycles since 2024. The global banking sector remained broadly resilient supported by stronger capital positions and improved profitability, although bank credit growth moderated in 2024. While exposures to non-bank financial institutions pose potential vulnerabilities, system-wide stress indicators remain contained. 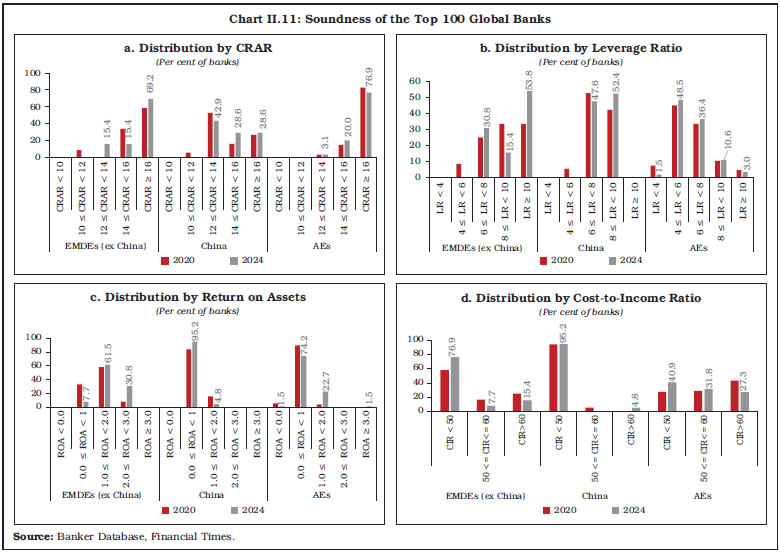 II.42 Continued vigilance through robust supervision, effective macroprudential frameworks, and enhanced oversight of interconnectedness will be crucial to safeguard financial stability and to ensure that banks remain a reliable conduit for supporting global growth. Apart from prudent regulation and supervision, fiscal discipline and calibrated monetary policy actions also remain crucial for macro-financial stability in a state of heightened global uncertainty.
|