Today, the Reserve Bank released the results of its Consumer Confidence Survey (CCS)1 for the September 2022 round. The survey obtains current perceptions (vis-à-vis a year ago) and one year ahead expectations on general economic situation, employment scenario, overall price situation and own income and spending across 19 major cities. The latest round of the survey was conducted during September 01 to September 10, 2022, covering 6,062 responses. Highlights: -
Consumer confidence2 has been on recovery path since July 2021 after the impact of the COVID-19 pandemic waned; though the current situation index (CSI) remained in negative terrain, it improved in the latest survey round on the back of better sentiments on general economic situation and spending (Chart 1 and Tables 1 and 6). -
Households expressed pessimism on their current income but a majority of them expect higher income over the next one year (Table 5). -
The expectations on employment conditions have moderated since March 2022 survey round but they remained in positive terrain (Table 2). -
Consumer confidence for the next one year, as measured by the future expectations index (FEI), remained steady and the expectation at the aggregate level remains close to its level in the previous survey round (Chart 1). -
Most households reported higher current spending, which was mainly driven by essential spending; nearly three-fourths of the respondents expect further rise in overall spending over the next one year and another 20 per cent expect it to remain around the prevailing levels (Tables 6 and 7). 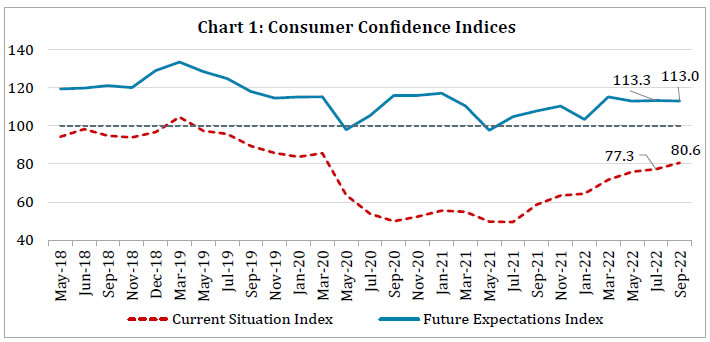 Note: Please see the excel file for time series data.3
| Table 1: Perceptions and Expectations on the General Economic Situation | | (Percentage responses) | | Survey Round | Current Perception | One year ahead Expectation | | Improved | Remained Same | Worsened | Net Response | Will Improve | Will Remain Same | Will Worsen | Net Response | | Sep-21 | 15.4 | 13.0 | 71.6 | -56.2 | 42.3 | 18.1 | 39.6 | 2.7 | | Nov-21 | 17.4 | 12.6 | 70.1 | -52.7 | 44.6 | 17.3 | 38.1 | 6.4 | | Jan-22 | 17.8 | 15.6 | 66.7 | -48.9 | 40.8 | 16.7 | 42.5 | -1.7 | | Mar-22 | 21.7 | 16.2 | 62.2 | -40.5 | 49.2 | 15.2 | 35.7 | 13.5 | | May-22 | 22.5 | 14.9 | 62.7 | -40.2 | 45.4 | 15.3 | 39.4 | 6.0 | | Jul-22 | 21.6 | 15.4 | 63.0 | -41.5 | 46.4 | 14.9 | 38.8 | 7.6 | | Sep-22 | 26.2 | 14.6 | 59.2 | -33.0 | 46.5 | 15.4 | 38.1 | 8.4 |
| Table 2: Perceptions and Expectations on Employment | | (Percentage responses) | | Survey Round | Current Perception | One year ahead Expectation | | Improved | Remained Same | Worsened | Net Response | Will Improve | Will Remain Same | Will Worsen | Net Response | | Sep-21 | 15.6 | 13.5 | 70.9 | -55.4 | 45.7 | 18.1 | 36.3 | 9.4 | | Nov-21 | 19.6 | 16.5 | 64.0 | -44.4 | 48.9 | 18.1 | 33.0 | 16.0 | | Jan-22 | 17.4 | 17.2 | 65.4 | -48.0 | 41.4 | 19.3 | 39.3 | 2.2 | | Mar-22 | 23.6 | 17.0 | 59.5 | -35.9 | 52.9 | 17.0 | 30.2 | 22.7 | | May-22 | 27.3 | 17.8 | 54.9 | -27.6 | 51.3 | 16.7 | 32.1 | 19.2 | | Jul-22 | 28.1 | 17.3 | 54.6 | -26.5 | 50.7 | 17.2 | 32.0 | 18.7 | | Sep-22 | 28.4 | 17.6 | 54.0 | -25.7 | 49.4 | 17.3 | 33.3 | 16.1 |
| Table 3: Perceptions and Expectations on Price Level | | (Percentage responses) | | Survey Round | Current Perception | One year ahead Expectation | | Increased | Remained Same | Decreased | Net Response | Will Increase | Will Remain Same | Will Decrease | Net Response | | Sep-21 | 92.6 | 5.7 | 1.7 | -91.0 | 75.0 | 14.5 | 10.5 | -64.5 | | Nov-21 | 95.1 | 3.9 | 1.0 | -94.2 | 76.6 | 12.6 | 10.9 | -65.7 | | Jan-22 | 93.4 | 5.4 | 1.2 | -92.3 | 78.1 | 12.4 | 9.5 | -68.6 | | Mar-22 | 93.3 | 5.6 | 1.2 | -92.1 | 79.1 | 10.4 | 10.5 | -68.6 | | May-22 | 95.4 | 4.1 | 0.5 | -94.9 | 80.0 | 11.1 | 8.9 | -71.1 | | Jul-22 | 95.2 | 4.0 | 0.9 | -94.3 | 80.4 | 10.9 | 8.8 | -71.6 | | Sep-22 | 94.6 | 4.3 | 1.1 | -93.6 | 79.9 | 11.0 | 9.1 | -70.8 |
| Table 4: Perceptions and Expectations on Rate of Change in Price Level (Inflation)* | | (Percentage responses) | | Survey Round | Current Perception | One year ahead Expectation | | Increased | Remained Same | Decreased | Net Response | Will Increase | Will Remain Same | Will Decrease | Net Response | | Sep-21 | 88.2 | 9.0 | 2.9 | -85.3 | 82.9 | 12.9 | 4.3 | -78.6 | | Nov-21 | 90.6 | 7.1 | 2.3 | -88.4 | 82.4 | 13.2 | 4.4 | -78.0 | | Jan-22 | 88.1 | 8.7 | 3.2 | -84.9 | 81.7 | 13.5 | 4.7 | -77.0 | | Mar-22 | 88.5 | 9.3 | 2.2 | -86.2 | 83.9 | 12.4 | 3.7 | -80.2 | | May-22 | 91.3 | 7.0 | 1.7 | -89.7 | 81.7 | 14.2 | 4.1 | -77.6 | | Jul-22 | 88.5 | 8.9 | 2.6 | -85.9 | 81.8 | 13.6 | 4.6 | -77.3 | | Sep-22 | 89.6 | 7.8 | 2.6 | -87.0 | 80.6 | 14.5 | 4.9 | -75.7 | | *Applicable only for those respondents who felt price has increased/price will increase. |
| Table 5: Perceptions and Expectations on Income | | (Percentage responses) | | Survey Round | Current Perception | One year ahead Expectation | | Increased | Remained Same | Decreased | Net Response | Will Increase | Will Remain Same | Will Decrease | Net Response | | Sep-21 | 11.2 | 31.5 | 57.3 | -46.1 | 45.4 | 41.8 | 12.8 | 32.6 | | Nov-21 | 13.0 | 36.0 | 51.0 | -38.1 | 47.9 | 40.8 | 11.3 | 36.6 | | Jan-22 | 12.3 | 38.0 | 49.7 | -37.4 | 43.2 | 42.5 | 14.3 | 29.0 | | Mar-22 | 16.0 | 42.1 | 42.0 | -26.0 | 52.9 | 38.5 | 8.6 | 44.3 | | May-22 | 17.6 | 46.0 | 36.4 | -18.9 | 52.4 | 39.2 | 8.4 | 44.0 | | Jul-22 | 18.2 | 46.0 | 35.9 | -17.7 | 51.6 | 40.0 | 8.4 | 43.3 | | Sep-22 | 20.2 | 45.5 | 34.4 | -14.2 | 51.3 | 39.8 | 8.9 | 42.4 |
| Table 6: Perceptions and Expectations on Spending | | (Percentage responses) | | Survey Round | Current Perception | One year ahead Expectation | | Increased | Remained Same | Decreased | Net Response | Will Increase | Will Remain Same | Will Decrease | Net Response | | Sep-21 | 58.3 | 25.4 | 16.3 | 42.0 | 66.0 | 26.7 | 7.3 | 58.8 | | Nov-21 | 62.2 | 22.1 | 15.8 | 46.4 | 66.4 | 25.7 | 8.0 | 58.4 | | Jan-22 | 61.7 | 24.9 | 13.3 | 48.4 | 64.4 | 26.9 | 8.7 | 55.8 | | Mar-22 | 64.1 | 24.8 | 11.1 | 53.0 | 70.4 | 23.2 | 6.4 | 64.1 | | May-22 | 69.4 | 22.1 | 8.5 | 60.9 | 72.5 | 21.7 | 5.8 | 66.7 | | Jul-22 | 72.6 | 21.1 | 6.3 | 66.3 | 73.0 | 22.4 | 4.6 | 68.3 | | Sep-22 | 75.9 | 17.5 | 6.6 | 69.2 | 74.2 | 20.7 | 5.2 | 69.0 |
| Table 7: Perceptions and Expectations on Spending- Essential Items | | (Percentage responses) | | Survey Round | Current Perception | One year ahead Expectation | | Increased | Remained Same | Decreased | Net Response | Will Increase | Will Remain Same | Will Decrease | Net Response | | Sep-21 | 72.4 | 16.5 | 11.1 | 61.3 | 73.5 | 20.7 | 5.8 | 67.8 | | Nov-21 | 75.4 | 14.5 | 10.1 | 65.4 | 74.1 | 20.1 | 5.8 | 68.4 | | Jan-22 | 75.7 | 15.6 | 8.7 | 67.1 | 73.5 | 20.1 | 6.4 | 67.0 | | Mar-22 | 76.6 | 15.7 | 7.7 | 68.9 | 78.6 | 16.2 | 5.2 | 73.5 | | May-22 | 81.7 | 12.8 | 5.5 | 76.2 | 79.9 | 15.7 | 4.4 | 75.4 | | Jul-22 | 82.0 | 13.7 | 4.3 | 77.7 | 80.0 | 16.5 | 3.6 | 76.4 | | Sep-22 | 85.2 | 10.7 | 4.1 | 81.1 | 80.9 | 15.4 | 3.7 | 77.3 |
| Table 8: Perceptions and Expectations on Spending- Non-Essential Items | | (Percentage responses) | | Survey Round | Current Perception | One year ahead Expectation | | Increased | Remained Same | Decreased | Net Response | Will Increase | Will Remain Same | Will Decrease | Net Response | | Sep-21 | 10.2 | 28.9 | 60.8 | -50.6 | 25.5 | 37.0 | 37.5 | -12.0 | | Nov-21 | 12.9 | 26.8 | 60.4 | -47.5 | 25.0 | 36.3 | 38.7 | -13.7 | | Jan-22 | 14.3 | 31.1 | 54.5 | -40.2 | 23.6 | 38.6 | 37.8 | -14.2 | | Mar-22 | 16.1 | 31.6 | 52.2 | -36.1 | 28.9 | 36.7 | 34.4 | -5.5 | | May-22 | 16.6 | 34.1 | 49.3 | -32.7 | 27.5 | 38.4 | 34.1 | -6.6 | | Jul-22 | 18.7 | 35.9 | 45.5 | -26.8 | 29.3 | 38.5 | 32.2 | -2.9 | | Sep-22 | 20.9 | 32.5 | 46.7 | -25.8 | 29.5 | 37.6 | 33.0 | -3.6 |
|