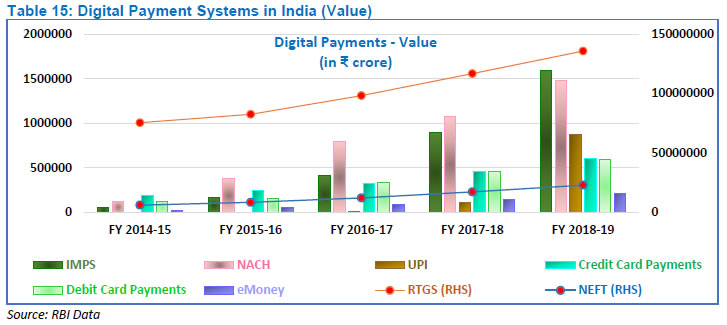
1. Background 1.1 The digital revolution is taking the world by storm and no other area has witnessed such metamorphosis as payment and settlement systems, resulting in a myriad of digital options for the common man. Consumers now have a range of options to choose from when selecting a payment method to complete a transaction. They make this selection based on the value they attribute to a payment method in a certain situation as each payment mode has its own use and purpose. In India, like in many parts of the world, cash is the well-established and widely used payment instrument. It is, however, reassuring that non-cash payments, especially those using electronic or digital modes are rapidly increasing. 2. Approach 2.1 Cash is all pervasive, easy to use and store and offers great convenience. The challenge in assessing the progress of a country from cash to digitisation arises from the fact that, given the anonymity of cash transactions, it is very difficult to establish the exact volume of transactions conducted in cash, and consequently the value of such transactions. Notwithstanding this, this paper studies the popularly used indicators over the world which denote the use of cash and which are considered as a proxy for cash payments. 2.2 This study also analyses the measures of cash, the enablers for payment systems and the measures of electronic payments over a timeframe of the last 5 years to ascertain the shift in India, if any, from cash to digital payments. Further, a comparison with the 26 member countries of the Committee on Payments and Market Infrastructures (CPMI) over the same five year period has also been attempted to evaluate India’s performance vis-à-vis other countries. 3. Measure of Cash 3.1 While there is no accurate estimate of the cash payments, two key indicators, viz., (a) the value of Currency in Circulation (CIC) versus Gross Domestic Product (GDP); and (b) the value of ATM withdrawals that take place across the country, can be used for this purpose. (a) Currency in Circulation 3.2 The amount of CIC is related to the use of cash as a payment instrument since one of the major forces of demand for currency is its use for making payments. The CIC across the country increased at a Compounded Annual Growth Rate (CAGR) of 10.2% over the past 5 years, i.e., between the financial years (FY) 2014-15 and 2018-19. 3.3 It is assumed that having high CIC relative to GDP indicates that cash is highly preferred as a payment instrument. Based on this assumption, India continues to have a strong bias for cash payments. Demonetisation and an active growth in GDP brought down the cash in circulation as a percentage of GDP to 8.70% in 2016-17. This increased to 10.70% in 2017-18 and to 11.2% in 2018-19 which, however, is less than the pre-demonetisation level of 12.1% in 2015-16. The rate of increase is lower indicating a perceptible shift away from cash. 3.4 The notes in circulation (CIC minus coins in circulation) increased at an average rate of 14% between October 2014 and October 2016. Assuming the same growth rate, notes in circulation (NIC) would have been ₹26,04,953 crore in October 2019. NIC, however, was ₹22,31,090 crore, indicating that digitaisation and reduction in cash usage helped reduce NIC by over ₹3.5 lakh crore. 3.5 While India’s CIC levels reduced in 2018 as compared to 2014, other countries, with the exception of Argentina, China, Indonesia, Russia, South Africa, Sweden and Turkey, had increasing cash levels. Although cash is deeply embedded in the payment systems in India, planned efforts post-demonetisation have shown a marked shift from cash to digital payments. (b) Share of High Value denominated currency and Low Value denominated currency 3.6 “Money is what money does” (Hicks (1969)). Cash, like other forms of money, is used both as a means of payment and as a store of value. A common way to try and disentangle the two types of cash demand is to assume that high value denomination notes are mostly held as a store of value and low denomination for payments (Amromin and Chakravorti (2007)). Over the past 5 years, the demand for high value denominated currency has outpaced low value denominated currency which may indicate that cash is increasingly used as a store of value and less for making payments. (c) Cash Withdrawals from ATMs 3.7 The cash withdrawals from ATMs increased over the past 5 years. India is next only to China in terms of the cash withdrawals from ATMs. However, the percentage of cash withdrawals to GDP has been constant in India at around 17%. In addition, with a CAGR of 9% in terms of volume and 10% in terms of value, the growth has been slow when compared to digital payment transactions (which grew at a CAGR of 61% and 19% in terms of volume and value, respectively), indicating a shift towards digitisation. Further, the infrastructure for cash withdrawal, i.e., ATMs has grown at a low pace (CAGR of 4% during the past 5 years).
4. Estimates of Cash Payments 4.1 Some surveys / reports have attempted to measure the level of cash payments in the economy. Although many of the reports are only estimates, they do provide some indication of cash usage and digitisation in the country as also across the world. According to these estimates, cash still reigns supreme not only in India but in many other jurisdictions as well. Payments are, however, quickly expanding to include online payment channels. A report by Worldpay revealed that digital payment usage is increasing in the Asia Pacific region and estimated that the e-commerce market in the region will grow by a CAGR of 12 percent between 2016 and 2021, with India being one of the key drivers of this growth. (a) The Pymnts Global Cash Index for Asia Pacific 4.2 The Pymnts Global Cash Index for Asia Pacific published in June 2018, computed the “cash share of the wallet”, as the amount of cash withdrawn in a country as a share of its annual GDP, to determine the popularity of physical cash exchange in comparison to that of alternative payment methods. India was observed to be highly dependent on cash. | Table 7: Cash Propensity and Growth in Cash | | Country | Population (mn) | GDP (USD bn) | Cash Propensity (%) | Total Cash Growth (%) | | Australia | 24.4 | 1282.0 | 11.2 | -0.7 | | China | 1382.7 | 10365.4 | 35.9 | 9.2 | | India | 1299.8 | 2939.5 | 49.3 | 10.5 | | Japan | 127.0 | 5049.4 | 3.4 | -8.5 | | Korea | 51.2 | 1458.9 | 4.1 | 2.1 | | Singapore | 5.6 | 276.3 | 16.7 | 1.6 | | Source: Pymnts Global Cash Index for Asia Pacific published in June 2018 | (b) The JP Morgan 2019 Global Payments Trends Report 4.3 The JP Morgan 2019 Global Payments Trends Report - India Country Insights observed that Indian payments market, historically dominated by cash, is evolving to meet the demands of smartphone led online shopping culture, with cards and digital wallets rising in prominence. (c) The Worldpay Global Payments Report 2018 4.4 The Worldpay Global Payments Report 2018 observed that in India, while cash continued to be the primary payment method for point of sale purchases (card present), eMoney dominated the online payments (card not present). The report observed that as internet penetration and the digital economy continues to grow, there will be room for ongoing shift of payment forms. 4.5 World over, cards have replaced cash as a mode of making payments, except in traditionally cash denominated jurisdictions like Germany, Italy, Japan and Russia. In India, the shift has been to electronic / digital channels. (d) Credit Suisse Group AG 4.6 According to a report by Credit Suisse Group AG, 72% of India’s consumer transactions take place in cash, double the rate as in China. According to the report, many merchants, especially in rural areas, remain unable or unwilling to accept digital transactions due to network connectivity issues and a reluctance to pay charges for what are often low-value transactions. 5. Digital Payment Enablers (a) Mobile Phones and Internet 5.1 The increasing mobile density and mobile internet users are being leveraged upon by payment systems providers, both banks and non-banks, to offer the payment services using mobile as an access device as well as an access channel. Banks in particular, have been offering mobile banking services through all three channels – SMS, USSD (Unstructured Supplementary Services Data) and mobile applications. 5.2 As at end November 2019, India had over 115.5 crore wireless telephone subscribers resulting in a tele-density of 88.90%. The urban tele-density and rural tele-density was 157.33% and 56.69%, respectively. The increase in smartphones has helped to accelerate the adoption of digital payments. Further, it has led to numerous innovations in payment mechanisms, such as tokenisation and scanning of QR code for making payments using smartphones. These have facilitated the shift from cash to non-cash payments. 5.3 Internet usage is on the rise in India. While the average Indian until 2013 used to spend more on voice services than on mobile data services, the majority of an average mobile bill now pertains to data charges according to a report by the Internet and Mobile Association of India (IAMAI). As on end November 2019, there were over 64.2 crore and 1.9 crore wireless and wireline broadband subscribers, respectively across the country. The increase in internet penetration has ensured adoption of digital modes of payments across the country. 5.4 The growth of infrastructure in India has been phenomenal over the past six years, especially with reference to availability of Mobile Cellular Subscriptions. With increased penetration of 3G and 4G even in remote areas, the internet network is rapidly expanding in India and provides a threshold of “Digital Revolution.” (b) Bank Accounts 5.5 The number of deposit accounts has grown to 217.40 crore as at end March 2019. These include deposit accounts in all commercial banks including Local Area Banks (LABs), Payment Banks (PBs), Small Finance Banks (SFBs), Regional Rural Banks (RRBs) and cooperative banks in the country. As on October 30, 2019 there were 37.36 crore Basic Savings Bank Deposit (BSBD) accounts. The availability of bank accounts plays a key role in initiating digital payments from / to such accounts. (c) Aadhaar 5.6 Since its launch in 2009, the Aadhaar, a unique identity for all Indian citizens has been issued to over 124 crore individuals across the country. “Aadhaar” enabled eKYC (electronic Know Your Customer) had resulted in an exponential growth of digital payments in India. The use of Aadhaar has also been leveraged for authenticating payments to merchants and through business correspondents. Aadhar has helped widen the reach and access of payment systems across the country. The coverage of Aadhaar biometric identification has witnessed increased use in Government payments (G2P). It reduced leakages from the system by expunging fake beneficiaries. These payment systems have helped migrate cash payments to electronic form. (e) Debit and Credit Cards 5.7 In respect of card issuance, during the past 5 years, the number of credit cards issued increased from 211 lakh to over 550 lakh. The same period also witnessed a steep increase in debit cards from 5535 lakh to over 8000 lakh. This was supported by the 2960 lakh Rupay debit cards issued to BSBD account holders. Increase in cards has facilitated growth in both online and physical PoS terminals based card payments resulting in an increase in digital transactions. 5.8 Banks issued new cards to comply with the requirement to convert all existing Magstripe cards to EMV Chip and PIN compliant cards by December 31, 2018 and subsequently removed deactivated cards from their systems, resulting in a drop in debit cards outstanding. The consolidation of public sector banks also contributed to this reduction. 6. Progress in Digitisation 6.1 While there is no accurate measure of cash payments in the country, the progress of various digital payments can be measured accurately. Overall, the digital payments in the country have witnessed a CAGR of 61% and 19% in terms of volume and value, respectively over the past 5 years, demonstrating a steep shift towards digital payments. (a) Growth of digital payments 6.2 Within the digital payments, retail electronic payments comprising credit transfers {NEFT, fast payments (IMPS and UPI)} and direct debits (ECS, NACH) have shown a rapid growth at a CAGR of 65% and 42% in terms of volume and value, respectively. Stored value cash issued in the form of wallets and prepaid cards demonstrated an increased adoption with a CAGR of 96% and 78% in terms of volume and value, respectively. 6.3 Debt and credit card based payments registered a CAGR of 44% and 40% in terms of volume and value, respectively. The adoption of card payments has been supported by innovations in the form of contactless payments and tokenisation technologies, contributing to the growth. In addition, the use of cards for payments is increasing vis-a-vis their use for withdrawing cash. 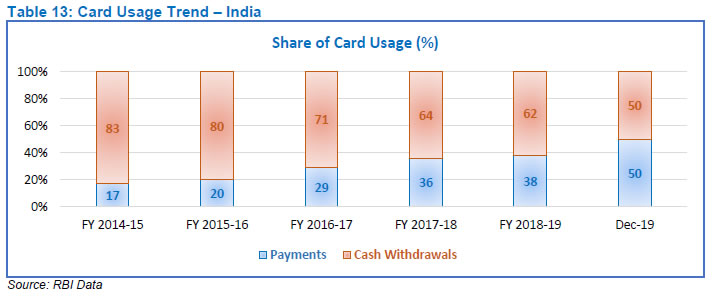 6.4 Innovation is making domestic payments increasingly convenient, instantaneous and ubiquitous. More options are available to consumers and this is making it more convenient for them to use digital payments. Systems that offer near instant person-to-person retail payments are increasingly available around the world. Many payment systems in the country now operate 24 hours a day, seven days a week, which are pushing customers towards digital payments on account of the convenience they offer. India has Immediate Payment Systems (IMPS) and Unified Payments Interface (UPI) as fast payments and the latter is driving the retail payments volume. In addition, with NEFT, which drives the retail payments value, operationalised on a 24x7x365 basis (with half-hourly settlements), India’s payment systems landscape is headed for substantial growth. 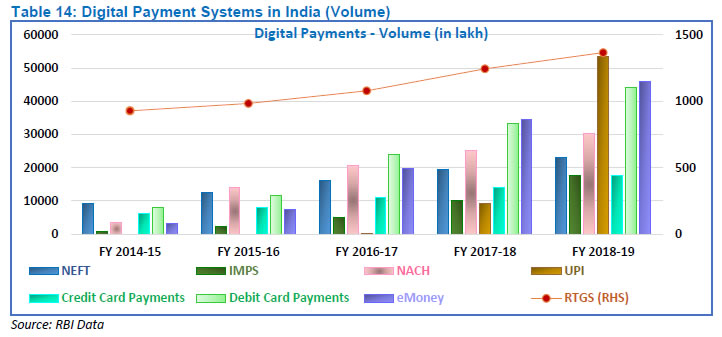
 6.5 According to GlobalData, a data and analytics company, digital cash in India is poised for significant growth. According to the 2017 Consumer Payments Insight Survey by the company, India is one of the top markets globally in terms of digital cash adoption with 55.4% survey respondents indicating that they use it. India is followed by China and Denmark. The adoption level in India is much higher compared to many of the developed markets such as the US and the UK, where consumers predominantly use cards. (b) Digital Payments to GDP 6.6 The value of cash withdrawals at ATMs to GDP has remained constant in India at around 17% except during the demonetisation period when it fell to 15%. When compared with other jurisdictions, India is behind only to Nordic countries, France, Belgium, UK and Australia which are known “less-cash” economies. Even China, which is ahead of most countries in terms of digital products and channels, has a high 67%, indicating a high velocity of cash.
6.7 The value of digital payments to GDP increased from 660% in 2014-15 to 862% in 2018-19, making the shift to digital payments in India clearly perceptible. A comparison with other CPMI countries shows that India is amongst the few countries like Argentina, Brazil, China, South Korea, Turkey and U.K. where the value of digital payments as a percentage of GDP has increased.
(c) Infrastructure 6.8 Infrastructure is the key requirement facilitating both cash dispensation and electronic payments. While it is true that bank branches and ATMs facilitate cash transactions, the former also facilitates the growth of electronic payments by bringing about financial inclusion and the latter acts as a confidence factor that cash is available at hand when required and as such there is no need to keep it stored in your wallet / purse. PoS terminals and mobile phones directly aid electronic transactions. 6.9 The last 5 years have witnessed a growth of 3.5% in the number of branches of SCBs across the country. The increase in branches, especially in rural and semi-urban areas has been an enabler for instilling banking practices in these areas which aids digital payments. 6.10 As at December 2019, there were around 49 lakh PoS terminals across the country. The ATMs and PoS terminals across the country have grown at a CAGR of 4% and 35%, respectively over the past 5 years. While the number of ATMs (a “cash” infrastructure) has grown at a low pace, the growth of non-cash infrastructure, mainly depicted by PoS has been significant. This has given a further fillip to digitisation. 6.11 While India made considerable progress with reference to the absolute number of PoS terminals deployed, the density of population dependent on a PoS terminal continues to be high at 358. While this is a drastic improvement from the 1124 persons per PoS terminal in 2014, other CPMI countries had a better deployment rate. In order to increase the acceptance infrastructure, the Reserve Bank has announced the operationalisation of an Acceptance Development Fund to increase acceptance infrastructure. 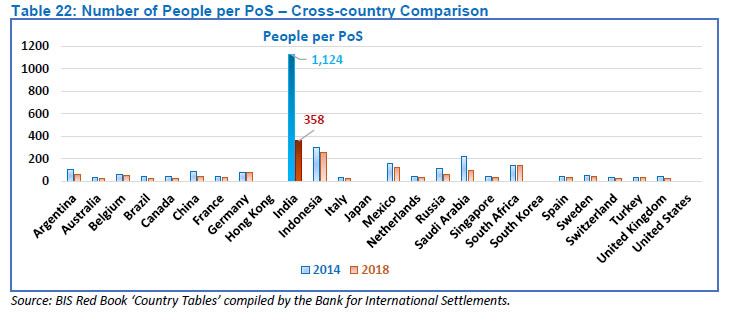 6.12 Another important acceptance infrastructure gaining popularity is the digital PoS or the QR code. Bharat QR has grown as a lightweight, low cost method to bring merchants into the acceptance network. The deployment of QR codes is expected to increase substantially in the coming years which along with physical PoS terminals will facilitate the rapid adoption of digital payments. As on November 30, 2019, over 16 million payment QR codes (Bharat QR as well as proprietary QRs of other payment system operators) were deployed. A committee has been constituted by the Reserve Bank to examine, review and finalise a pan-India, inter-operable QR code structure. 7. Looking Glass 7.1 The factors inhibiting the digital push are connectivity issues, inadequate acceptance infrastructure, lack of familiarity with newer, alternative payment methods, delay in getting complaints resolved and security and privacy concerns. Reserve Bank has acknowledged the same and to address these issues has put in place systems like, consumer awareness programmes, ombudsman schemes, increasing the category of billers in Bharat Bill Pay, etc. 7.2 The Payments and Settlement Systems Vision 2019-2021 envisages empowering every citizen with an Exceptional (e) Payment Experience, and provide her access to a bouquet of options. To achieve this, the Reserve Bank has (a) made NEFT available 24x7 with effect from December 16, 2019; (b) mandated banks not to charge savings bank account customers for online transactions in the NEFT system with effect from January 2020; (c) permitted all authorised payment systems and instruments (non-bank PPIs, cards and UPI) for linking with National Electronic Toll Collection (NETC) FASTags; and (d) enabled processing of e-mandates for transactions through UPI. However, some areas still remain where action is envisaged, such as (a) operationalising the Acceptance Development Fund to increase acceptance infrastructure; (b) Assessing the need for plurality of QR codes and merits of their co-existence or convergence from both systemic and consumer viewpoints; In addition, RBI is conducting an innovation contest through the Institute of Development and Research in Banking Technology (IDRBT). These steps will further accelerate the adoption of digital payments. 8. Conclusion 8.1 Both cash and non-cash payment instruments fulfil unique needs, and as long as these needs do not change, both types of payment instruments are required to meet the full spectrum of user’s needs. 8.2 Electronic payment methods are both at the service of and bound by India’s heterogeneous economic composition. Virtual payments are increasing in popularity, but the country’s ethnic and economic diversity render the shift toward digital payments geographically variable and certain regions and economic strata exhibit more openness to digitisation than others. 8.3 India’s growing use of retail digital payments, along with the radical reconstruction of its cash economy, indicates a shift in its relationship with cash. This is evidenced by the steep growth observed in the retail digital payments. Increasing acceptance and convenience of digital payments vis-à-vis cash is also reflected in decrease in average value per digital payment transaction. 8.4 A large population of the country historically lacked access to personal bank accounts and credit lines. Digital payment methods (AePS, APBS, DBT) have played a large role in helping them manage their personal finances leading to their being financially included. 8.5. Cash still rules but is increasingly seen as a way to store value as an economic asset rather than to make payments. 8.6 Speed, convenience and competition are shaping the future of payments. Our endeavour is to make digital (payments) a divine experience to the users – Cash is King, but Digital is Divine. February 24, 2020
References: (i) Hicks, J (1969): “Critical essays in monetary theory”, The Canadian Journal of Economics, vol 2, no 1, pp 141–44. (ii) Amromin, G and S Chakravorti (2007): “Debit card and cash usage: A cross-country analysis”, Federal Reserve Bank of Chicago, Working Papers, no 4. (iii) Pymts Global Cash Index-India Edition (Cash Use, Cash Share, Growth) (iv) JP Morgan 2019 Global Payments Trends Report India Country Insights (mobile, internet, card penetration; e-commerce payments split by value) (v) WorldPay Global Payments Report 2018 (share of cash and other payments in the payments methods used) (vi) March report by Credit Suisse Group AG (vii) Red Book Statistics – CPMI (viii) TRAI Data |