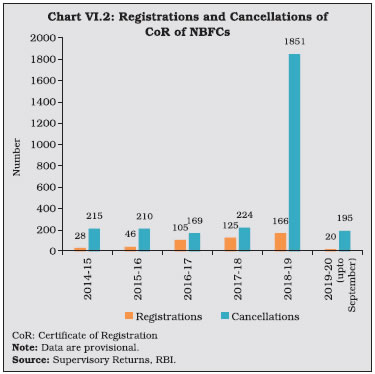
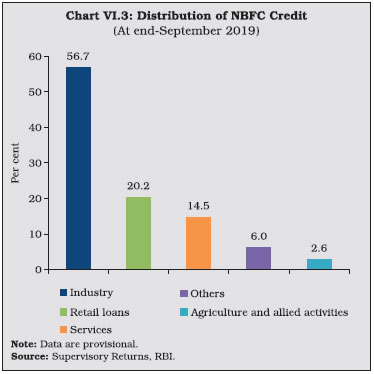
The consolidated balance sheet of the NBFCs expanded at a slower pace in 2018-19 and in the first half of 2019-20 in the aftermath of IL&FS default and rating downgrades of a few companies. NBFCs credit growth continued, supported by bank borrowings. Although GNPA ratio showed an uptick, their capital position remained stable. HFCs experienced deceleration in credit growth and muted profitability as market confidence in the sector waned. The Reserve Bank and the government have taken several measures to address these challenges by enhancing systemic liquidity and strengthening the governance and risk-management framework of NBFCs, including HFCs. The consolidated balance sheet of AIFIs expanded on the back of robust credit growth, particularly due to augmentation of line of credit by NABARD. 1. Introduction VI.1 Non-banking financial institutions (NBFIs) are a group of diverse financial intermediaries which, in a bank-dominated financial system like India, serve as an alternative channel of credit flow to the commercial sector. Among the various institutions that perform this function1, those regulated by the Reserve Bank are all-India financial institutions (AIFIs), non-banking financial companies (NBFCs), primary dealers (PDs) and the most recent addition, housing finance companies2 (HFCs) (Chart VI.1).  AIFIs are apex financial institutions established during the development planning period to ensure adequate flow of long-term financial resources to crucial sectors, i.e., agriculture, rural development, small industries and so on. NBFCs are government/public/private limited companies, which specialise in delivering credit to a wide variety of niche segments, ranging from infrastructure to consumer durables. PDs came into existence in 1995 and act as market makers in the government securities (G-secs) market, besides ensuring that primary issuances of G-secs are subscribed. HFCs extend housing finance to individuals, co-operative societies and corporate bodies and lease commercial and residential premises to support housing activity in the country. VI.2 This chapter presents an analysis of the financial performance of NBFIs in 2018-19 and April-September 2019. The rest of the chapter is organised into four sections. Section 2 provides an overview of the NBFC sector–both non-deposit taking systemically important NBFCs (NBFCs-ND-SI) and deposit-taking NBFCs (NBFCs-D). The activities of HFCs are also covered in this section. An assessment of the performance of AIFIs is made in Section 3. Section 4 evaluates the performance of PDs. Section 5 concludes and offers some policy perspectives. 2. Non-Banking Financial Companies VI.3 NBFCs can be classified on the basis of a) their asset/liability structures; b) their systemic importance; and c) the activities they undertake. In terms of liability structures, NBFCs are subdivided into deposit-taking NBFCs (NBFCs-D) - which accept and hold public deposits - and non-deposit taking NBFCs (NBFCs-ND) - which rely on markets and banks to raise money. Among NBFCs-ND, those with an asset size of ₹500 crore or more are classified as non-deposit taking systemically important NBFCs (NBFCs-ND-SI). At the end of September 2019, there were 82 NBFCs-D and 274 NBFCs- ND-SI as compared to 88 and 263, respectively at the end of March 2019. VI.4 Since NBFCs cater to niche areas, they are also categorised on the basis of activities they undertake. Till February 21, 2019, NBFCs were divided into 12 categories. Thereafter, these categories were harmonised in order to provide NBFCs with greater operational flexibility. As a result, asset finance companies (AFCs), loan companies (LCs) and investment companies (ICs) were merged into a new category called Investment and Credit Company (NBFC-ICC). At present, there are 11 categories of NBFCs in the activity- based classification (Table VI.1). VI.5 As per the regulatory guidelines, only those NBFCs with a minimum net owned fund (NOF) of ₹2 crore are allowed to operate. As a result, 2018-19 saw a record number of cancellations of registration (Chart VI.2). The number of NBFCs registered with the Reserve Bank declined from 9,856 at the end of March 2019 to 9,642 at the end of September 2019. 2.1 Ownership Pattern VI.6 The NBFC sector is dominated by NBFCs- ND-SI, which constitute 86.3 per cent of the total asset size of the sector. Within this segment, government owned NBFCs (particularly the two largest NBFCs i.e., Power Finance Corporation Limited and REC Limited) hold around two-fifth of the total assets (Table VI.2). VI.7 The strategy adopted by the Reserve Bank of limiting the operations and growth of NBFCs-D is driven by the need to secure depositors’ interest, given that deposits of NBFCs-D are not covered by the Deposit Insurance and Credit Guarantee Corporation (DICGC). The Reserve Bank has mandated that only investment grade NBFCs-D shall accept fixed deposits from the public, up to a limit of 1.5 times of their NOF and for a tenure of 12 to 60 months only, with interest rates capped at 12.5 per cent. | Table V1.1: Classification of NBFCs by Activity | | Type of NBFC | Activity | | 1. Investment and Credit Company (ICC) | Lending and investment. | | 2. NBFC-Infrastructure Finance Company (NBFC-IFC) | Provision of infrastructure loans. | | 3. NBFC-Systemically Important Core Investment Company (CIC-ND-SI) | Investment in equity shares, preference shares, debt or loans of group companies. | | 4. Infrastructure Debt Fund-NBFC (IDF-NBFC) | Facilitation of flow of long-term debt into infrastructure projects. | | 5. NBFC-Micro Finance Institution (NBFC-MFI) | Credit to economically disadvantaged groups. | | 6. NBFC-Factor | Acquisition of receivables of an assignor or extending loans against the security interest of the receivables at a discount. | | 7. NBFC-Non-Operative Financial Holding Company (NOFHC) | Facilitation of promoters/ promoter groups in setting up new banks. | | 8. Mortgage Guarantee Company (MGC) | Undertaking of mortgage guarantee business. | | 9. NBFC-Account Aggregator (NBFC-AA) | Collecting and providing information about a customer’s financial assets in a consolidated, organised and retrievable manner to the customer or others as specified by the customer. | | 10. NBFC–Peer to Peer Lending Platform (NBFC-P2P) | Providing an online platform to bring lenders and borrowers together to help mobilise funds. | | 11. Housing Finance Companies (HFC) | Financing for housing. | | Source: RBI. |
 VI.8 As a consequence, NBFCs-D accounted for only 13.7 per cent of the total assets of the NBFC sector at the end of March 2019, with 89.7 per cent of all NBFCs-D assets held by non-government companies. Public non-government companies are the dominant sub-group among the deposit taking NBFCs (Table VI.2). 2.2 Balance Sheet VI.9 Although the NBFC sector grew in size from ₹ 26.2 lakh crore in 2017-18 to ₹ 30.9 lakh crore in 2018-19, the pace of expansion was lower than in 2017-18 mainly due to rating downgrades and liquidity stress in a few large NBFCs in the aftermath of the IL&FS event. This slowdown was witnessed mainly in the NBFCs- ND-SI category, whereas, NBFCs-D broadly maintained their pace of growth. However, in 2019-20 (up to September) growth in balance-sheet size of NBFCs-ND-SI as well as NBFCs-D moderated due to a sharp deceleration in credit growth (Table VI.3, Appendix Tables VI.1 and VI.2). | Table VI.2: Ownership Pattern of NBFCs | | (At end-March 2019) | | (Amount in ₹ crore) | | Type | NBFCs-ND-SI | NBFCs-D | | Number of companies | Asset Size | Share in per cent
| Number of companies | Asset Size | Share in per cent | | Number | Asset Size | Number | Asset Size | | 1 | 2 | 3 | 4 | 5 | 6 | 7 | 8 | 9 | | A. Government Companies | 29 | 10,59,336 | 10.7 | 39.8 | 8 | 43,358 | 9.8 | 10.3 | | B. Non-government Companies (1+2) | 234 | 16,04,252 | 89.3 | 60.2 | 80 | 3,78,534 | 90.2 | 89.7 | | 1. Public Limited Companies | 120 | 12,03,189 | 46.0 | 45.2 | 78 | 2,83,900 | 87.8 | 67.3 | | 2. Private Limited Companies | 114 | 4,01,063 | 43.4 | 15.1 | 2 | 94,634 | 2.4 | 22.4 | | Total (a+B) | 263 | 26,63,588 | 100.0 | 100.0 | 88 | 4,21,892 | 100.0 | 100.0 | Note: Data are provisional.
Source: Supervisory Returns, RBI. | VI.10 Amongst NBFCs-ND-SI, ICCs and IFCs together account for 85.6 per cent of the total asset size of the segment at end-March 2019. Despite liquidity stress faced by the sector, there was expansion in asset size of IFCs. Balance sheets of micro finance institutions or NBFCs-MFI also expanded on the back of strong growth in their loans and advances, especially to the agriculture sector. For other categories of NBFCs, excluding CICs, however, the growth of loans and advances moderated during 2018-19 (Table VI.4). | Table VI.3: Abridged Balance Sheet of NBFCs | | (Amount in ₹ crore) | | Items | At end-March 2018 | At end-March 2019 | At end-September 2019 | | NBFCs | NBFCs- ND-SI | NBFCs-D | NBFCs | NBFCs- ND-SI | NBFCs-D | NBFCs | NBFCs- ND-SI | NBFCs-D | | 1 | 2 | 3 | 4 | 5 | 6 | 7 | 8 | 9 | 10 | | 1. Share Capital and Reserves | 6,10,383 | 5,56,043 | 54,339 | 6,95,807 | 6,28,603 | 67,204 | 7,73,163 | 6,99,301 | 73,862 | | | (21.6) | (20.6) | (32.4) | (14.0) | (13.0) | (23.7) | (21.7) | (21.5) | (24.2) | | 2. Public Deposits | 30,439 | 0 | 30,439 | 40,058 | 0 | 40,058 | 47,710 | 0 | 47,710 | | | (-0.6) | | (-0.6) | (31.6) | (0) | (31.6) | (40.3) | (0) | (40.3) | | 3. Debentures | 8,90,105 | 8,06,667 | 83,437 | 9,05,833 | 8,06,663 | 99,170 | 9,27,557 | 8,32,048 | 95,509 | | | (33.1) | (33.9) | (25.5) | (1.8) | (0) | (18.9) | (7.7) | (7.6) | (8.4) | | 4. Bank Borrowings | 4,18,902 | 3,47,546 | 71,356 | 6,07,037 | 5,00,803 | 1,06,235 | 6,30,786 | 5,13,205 | 1,17,581 | | | (33.4) | (37.4) | (16.7) | (44.9) | (44.1) | (48.9) | (21.2) | (21.9) | (18.3) | | 5. Commercial Paper | 1,47,742 | 1,29,569 | 18,173 | 1,54,469 | 1,36,357 | 18,112 | 1,23,440 | 1,04,477 | 18,964 | | | (13.4) | (12.2) | (22.8) | (4.6) | (5.2) | (-0.3) | (-31.2) | (-30.6) | (-34.7) | | 6. Others | 5,20,219 | 4,36,806 | 83,414 | 6,82,276 | 5,91,162 | 91,114 | 7,54,986 | 6,54,606 | 1,00,380 | | | (24.5) | (22.2) | (37.8) | (31.2) | (35.3) | (9.2) | (16.8) | (17.2) | (14.4) | | Total liabilities/assets | 26,17,790 | 22,76,631 | 3,41,159 | 30,85,480 | 26,63,588 | 4,21,892 | 32,57,642 | 28,03,637 | 4,54,006 | | | (26.8) | (27.2) | (24.2) | (17.9) | (17.0) | (23.7) | (13.2) | (13.1) | (14.1) | | 1. Loans and Advances | 19,62,459 | 16,53,217 | 3,09,242 | 22,76,600 | 18,97,527 | 3,79,072 | 23,54,211 | 19,49,198 | 4,05,013 | | | (31.8) | (32.7) | (26.7) | (16.0) | (14.8) | (22.6) | (9.9) | (9.5) | (12.2) | | 2. Investments | 4,16,609 | 4,04,651 | 11,958 | 5,12,443 | 4,88,550 | 23,893 | 5,87,685 | 5,62,943 | 24,742 | | | (21.2) | (22.2) | (-5.9) | (23.0) | (20.7) | (99.8) | (30.1) | (29.4) | (49.2) | | 3. Cash and Bank Balances | 76,182 | 67,386 | 8,796 | 98,776 | 88,984 | 9,792 | 1,13,156 | 1,01,150 | 12,006 | | | (-7.4) | (-8.4) | (1.2) | (29.7) | (32.1) | (11.3) | (23.8) | (23.5) | (26.0) | | 4. Other Current Assets | 1,30,457 | 1,21,023 | 9,433 | 1,53,842 | 1,46,310 | 7,532 | 1,60,162 | 1,49,682 | 10,480 | | | (8.7) | (7.7) | (22.6) | (17.9) | (20.9) | (-20.2) | (2.6) | (1.9) | (13.6) | | 5. Other Assets | 32,084 | 30,354 | 1,729 | 43,820 | 42,216 | 1,603 | 42,429 | 40,664 | 1,765 | | | (13.6) | (13.4) | (17.3) | (36.6) | (39.1) | (-7.3) | (18.5) | (18.1) | (28.2) | Notes: 1. Data are provisional. Data for 2017-18 have been updated, while data at end-September 2019 exclude data of two large NBFCs merged with banks.
2. Figures in parentheses indicate y-o-y growth in per cent.
Source: Supervisory Returns, RBI. | VI.11 NBFCs-D largely comprise AFCs and LCs; since merged into a new category called ICC. In both these categories, moderation in credit expansion led to the share of investments in total assets rising from 3.5 per cent in 2017-18 to 5.7 per cent 2018-19. On the liabilities side, LCs and AFCs witnessed a spurt in deposit growth in 2018-19 and 2019-20 (up to September), augmenting their resource base (Table VI.5). 2.3 Sectoral Credit of NBFCs VI.12 Credit extended by NBFCs continued to grow in 2018-19. Industry is the largest recipient of credit provided by the NBFC sector, followed by retail loans and services (Chart VI.3). Credit to industry and services was subdued in relation to the previous year. However, growth in retail loans continued its momentum (Table VI.6 and Appendix Table VI.3). VI.13 Over 40 per cent of the retail portfolio of NBFCs are vehicle and auto loans. The slowdown in auto loans in 2018-19 could be attributed to a slump in aggregate demand, exacerbated by postponement of vehicle purchases in anticipation of the implementation of BS-VI norms, the sharp increase in insurance costs in case of passenger vehicles and two wheelers, and sizeable enhancement in permissible axle load for commercial vehicles. In the consumer durables segment, a decline in credit extended was observed, reflecting muted consumer demand. NBFCs’ credit to commercial real estate decelerated in 2018-19, reflecting their risk aversion in light of the slowdown in real estate sector despite expansion of bank credit to the sector. On the other hand, credit to agriculture and allied activities saw a significant increase in 2018-19, partly attributable to the policy measure of September 2018 enabling co-origination of loans for lending to priority sector by banks and NBFCs. | Table VI.4: Major Components of Liabilities and Assets of NBFCs-ND-SI by Activity | | (Amount in ₹ crore) | | Category/ Liability | At end-March 2018 | At end-March 2019 | At end-September 2019 | Percentage
Variation in Total
Liabilities | | Borrowings | Other
Liabilities | Total
Liabilities | Borrowings | Other
Liabilities | Total
Liabilities | Borrowings | Other
Liabilities | Total
Liabilities | 2017-18 | 2018-19 | | 1 | 2 | 3 | 4 | 5 | 6 | 7 | 8 | 9 | 10 | 11 | 12 | | Investment and Credit Company | 7,96,131 | 3,66,623 | 11,62,754 | 8,67,420 | 4,20,127 | 1,28,7547 | 8,99,660 | 4,36,934 | 13,36,594 | 22.3 | 10.7 | | Core Investment Company | 85,104 | 1,40,222 | 2,25,326 | 1,06,647 | 1,82,441 | 2,89,088 | 1,13,969 | 2,36,753 | 3,50,723 | 19.8 | 28.3 | | Factoring – NBFC | 1,828 | 1,969 | 3,797 | 2,087 | 2,087 | 4,174 | 1,906 | 2,074 | 3,981 | 37.7 | 9.9 | | IDF-NBFC | 17,457 | 3,164 | 20,620 | 20,487 | 4,169 | 24,656 | 22,337 | 4,438 | 26,776 | 72.0 | 19.6 | | Infrastructure Finance Company | 6,63,621 | 1,49,364 | 8,12,985 | 8,01,996 | 1,90,288 | 9,92,284 | 8,24,946 | 1,99,216 | 10,24,162 | 39.5 | 22.1 | | NBFC-MFI | 35,912 | 15,237 | 51,149 | 43,212 | 22,627 | 65,839 | 41,866 | 19,535 | 61,401 | -4.0 | 28.7 | | Total | 16,00,053 | 6,76,578 | 22,76,631 | 18,41,850 | 8,21,739 | 26,63,588 | 19,04,685 | 8,98,951 | 28,03,637 | 27.2 | 17.0 | | Category/ Asset | At end-March 2018 | At end-March 2019 | At end-September 2019 | Percentage
Variation in Total
Assets | Loans and
Advances | Other
Assets | Total
Assets | Loans and
Advances | Other
Assets | Total
Assets | Loans and
Advances | Other
Assets | Total
Assets | 2017-18 | 2018-19 | | Investment and Credit Company | 8,10,754 | 3,52,000 | 11,62,754 | 9,02,377 | 3,85,170 | 12,87,547 | 9,15,106 | 4,21,489 | 13,36,594 | 22.3 | 10.7 | | Core Investment Company | 22,601 | 2,02,725 | 2,25,326 | 29,333 | 2,59,755 | 2,89,088 | 36,498 | 3,14,225 | 3,50,723 | 19.8 | 28.3 | | Factoring - NBFC | 3,003 | 794 | 3,797 | 3,393 | 781 | 4,174 | 3,208 | 773 | 3,981 | 37.7 | 9.9 | | IDF-NBFC | 15,175 | 5,445 | 20,620 | 18,843 | 5,813 | 24,656 | 20,364 | 6,412 | 26,776 | 72.0 | 19.6 | | Infrastructure Finance Company | 7,60,240 | 52,745 | 8,12,985 | 8,91,659 | 1,00,625 | 9,92,284 | 9,25,588 | 98,575 | 10,24,162 | 39.5 | 22.1 | | NBFC-MFI | 41,444 | 9,705 | 51,149 | 51,923 | 13,917 | 65,839 | 48,435 | 12,966 | 61,401 | -4.0 | 28.7 | | Total | 16,53,217 | 6,23,414 | 22,76,631 | 18,97,527 | 7,66,061 | 26,63,588 | 19,49,198 | 8,54,439 | 28,03,637 | 27.2 | 17.0 | Note: Data are provisional.
Source: Supervisory Returns, RBI. |
| Table VI.5: Major Components of Liabilities and Assets of NBFCs-D by Activity | | (Amount in ₹ crore) | | Items | Asset Finance Companies | Loan Companies | Total NBFCs- D | | At end March 2018 | At end March 2019 | At end September 2019 | At end March 2018 | At end March 2019 | At end September 2019 | At end March 2018 | At end March 2019 | At end September 2019 | | 1 | 2 | 3 | 4 | 5 | 6 | 7 | 8 | 9 | 10 | | Deposits | 10,562 | 14,516 | 17,457 | 19,878 | 25,541 | 30,253 | 30,439 | 40,058 | 47,710 | | Borrowings | 56,065 | 68,480 | 69,704 | 1,55,584 | 2,01,674 | 2,14,183 | 2,11,649 | 2,70,154 | 2,83,886 | | Total liabilities/assets | 86,983 | 1,06,081 | 1,11,581 | 2,54,177 | 3,15,810 | 3,42,425 | 3,41,159 | 4,21,892 | 4,54,006 | | Loans and Advances | 77,431 | 93,862 | 96,050 | 2,31,811 | 2,85,211 | 3,08,963 | 3,09,242 | 3,79,072 | 4,05,013 | | Investments | 4,367 | 5,854 | 8,009 | 7,592 | 18,039 | 16,733 | 11,958 | 23,893 | 24,742 | Note: Data are provisional.
Source: Supervisory Returns, RBI. |
| Table VI.6: Sectoral Credit Deployment by NBFCs | | (Amount in ₹ crore) | | Items | At end- March 2018 | At end- March 2019 | At end- September 2019 | Percentage Variation | | 2017-18 | 2018-19 | | 1 | 2 | 3 | 4 | 5 | 6 | | I. Gross Advances | 19,62,459 | 22,76,600 | 23,54,211 | 31.8 | 16.0 | | II. Food Credit | 241 | 230 | 93 | 1856.9 | -4.7 | | III. Non-food Credit (1 to 5) | 19,62,217 | 22,76,370 | 23,54,118 | 31.7 | 16.0 | | 1. Agriculture and Allied Activities | 46,821 | 70,189 | 61,967 | 18.4 | 49.9 | | 2. Industry (2.1 to 2.4) | 11,22,496 | 12,55,317 | 13,33,811 | 30.8 | 11.8 | | 2.1 Micro and Small | 64,455 | 54,597 | 59,713 | 32.0 | -15.3 | | 2.2 Medium | 28,311 | 22,979 | 19,981 | 62.7 | -18.8 | | 2.3 Large | 5,46,041 | 6,32,795 | 6,37,698 | 29.2 | 15.9 | | 2.4 Others | 4,83,689 | 5,44,946 | 6,16,420 | 31.1 | 12.7 | | 3. Services | 3,16,872 | 3,67,167 | 3,42,481 | 35.9 | 15.9 | | Of which, | | | | | | | 3.1 Commercial Real Estate | 1,25,178 | 1,48,501 | 1,29,359 | 30.1 | 18.6 | | 3.2 Retail Trade | 27,057 | 28,976 | 27,850 | 31.2 | 7.1 | | 4. Retail Loans | 3,59,583 | 4,47,496 | 4,74,899 | 29.3 | 24.4 | | Of which, | | | | | | | 4.1 Housing Loans | 13,263 | 15,491 | 17,862 | -16.4 | 16.8 | | 4.2 Consumer Durables | 8,626 | 5,094 | 4,917 | 59.7 | -40.9 | | 4.3 Vehicle/Auto Loans | 1,64,471 | 1,99,926 | 2,08,527 | 31.3 | 21.6 | | 5. Other Non-food Credit | 1,16,445 | 1,36,201 | 1,40,959 | 44.2 | 17.0 | Note: Data are provisional.
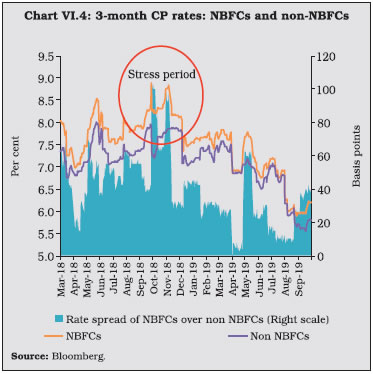
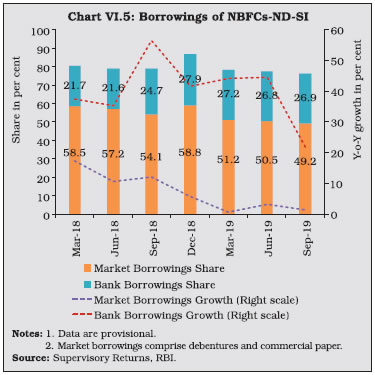
Source: Supervisory Returns, RBI. | 2.4 Resource Mobilisation VI.14 NBFCs-ND-SI mobilise around 70 per cent of their resources through bank borrowings and debentures. As investor confidence in the sector waned in 2018-19 and raising money through debentures became costlier, the reliance on bank borrowings increased. In fact, debenture issuances remained stagnant in 2018-19 whereas bank borrowings grew at a robust pace. The share of CPs declined marginally and CP issuances also decelerated in 2018-19 (Table VI.7). This happened even as the 3-month CP rates of NBFCs have been declining in the post IL&FS period barring occasional spikes (Chart VI.4). In spite of the low borrowing costs, the attractiveness of CPs as a source of borrowing for NBFCs diminished, owing to NBFCs preference for term-borrowings for better asset-liability management. VI.15 A slew of measures have been taken by the Government of India and the Reserve Bank to alleviate the liquidity stress and strengthen confidence in the sector (Box VI.1). Amidst generalised risk aversion affecting various categories of investors, banks had emerged as a stable funding alternative for NBFCs in 2018-19. In 2019-20 (up to September), bank lending to NBFCs decelerated in light of defaults by and rating downgrades of a prominent HFC and a NBFC. However, share of bank borrowings in total borrowings of NBFCs-ND-SI increased to 26.9 per cent at end-September 2019 from 24.7 per cent a year ago (Chart VI.5). | Table VI.7: Sources of Borrowings of NBFCs-ND-SI | | (Amount in ₹ crore) | | Items | At end- March 2018 | At end- March 2019 | At end- September 2019 | Percentage Variation | | 2017-18 | 2018-19 | | 1 | 2 | 3 | 4 | 5 | 6 | | 1. Debentures | 8,06,667 | 8,06,663 | 8,32,048 | 18.6 | 0.0 | | | (50.4) | (43.8) | (43.7) | | | | 2. Bank borrowings | 3,47,546 | 5,00,803 | 5,13,205 | 37.4 | 44.1 | | | (21.7) | (27.2) | (26.9) | | | | 3. Borrowings from FIs | 28,589 | 35,629 | 33,608 | 7.6 | 24.6 | | | (1.8) | (1.9) | (1.8) | | | | 4. Inter-corporate borrowings | 51,828 | 69,000 | 79,072 | 27.6 | 33.1 | | | (3.2) | (3.7) | (4.2) | | | | 5. Commercial paper | 1,29,569 | 1,36,357 | 1,04,477 | 10.3 | 5.2 | | | (8.1) | (7.4) | (5.5) | | | | 6. Borrowings from Government | 1,170 | 15,445 | 15,297 | -3.1 | 1219.9 | | | (0.1) | (0.8) | (0.8) | | | | 7. Subordinated debts | 35,493 | 45,459 | 46,115 | 6.1 | 28.1 | | | (2.2) | (2.5) | (2.4) | | | | 8. Other borrowings | 1,99,190 | 2,32,493 | 2,80,864 | 24.1 | 16.7 | | | (12.4) | (12.6) | (14.7) | | | | 9. Total borrowings | 16,00,053 | 18,41,850 | 19,04,685 | 21.9 | 15.1 | | | (100) | (100) | 100.0 | | | Notes: 1. Data are provisional.
2. Figures in parentheses indicate share in total borrowings.
Source: Supervisory Returns, RBI. |
 VI.16 While banks lend to NBFCs directly, they also subscribe to the debentures and CPs issued by NBFCs. However, given the prevailing risk-aversion, bank subscription to debentures and CPs issued by NBFCs-ND-SI has fallen in 2018-19 (Chart VI.6). In 2019-20 (up to September), direct lending by banks grew at 21.9 per cent. Box VI.1: Policy Measures for NBFC Sector NBFCs are meshed into a web of inter-linkages with banks and financial markets. Consequently, asset quality concerns relating to NBFCs constrain them to access liquidity with spill overs to financial markets. In the aftermath of the IL&FS episode in September 2018 sudden changes in sentiment, risk perceptions and asset liability mismatches surfaced. In order to restore confidence and maintain stability, the Reserve Bank and the government responded with several measures as set out below: -
The Finance Bill 2019 through amendments in the RBI Act, 1934 conferred powers on the Reserve Bank to strengthen governance of NBFCs so as to protect depositors’/creditors’ interest and secure financial stability. The amendments empowered the Reserve Bank to remove the directors of NBFCs; supersede their board and appoint administrators in order to improve governance and protect the interests of depositors and creditors; impose penalties in case of non-compliance with various requirements; and to resolve an NBFC by amalgamation, reconstruction or splitting an NBFC into different units or institutions. -
Pursuant to Budget announcements, the government amended the Companies (Share Capital and Debentures) Rules by removing Debenture Redemption Reserve (DRR) requirement for NBFCs and HFCs. The requirement of a DRR of 25 per cent of the value of outstanding debentures through public issues has been removed, which would reduce the cost of raising funds and deepen the corporate bond market. -
A Working Group constituted by the Reserve Bank to review regulatory and supervisory framework for Core Investment Companies has submitted report and recommended that the number of layers of CICs in a group should be restricted to two along with measures to strengthen the governance practice by constituting board level committees, appointing independent directors and a Group Risk Management Committee. -
End-use restrictions relating to external commercial borrowings were relaxed with eligible borrowers allowed to raise ECBs from recognised lenders (except foreign branches / overseas subsidiaries of Indian banks) of (i) a minimum average maturity period of 10 years for working capital purposes, general corporate purposes and repayment of rupee loans availed domestically for purposes of on-lending (other than capital expenditure) by NBFCs. (ii) a minimum average maturity period of 7 years for repayment of rupee loans availed domestically for capital expenditure. -
Banks were allowed to provide partial credit enhancement (PCE) to bonds issued by NBFCs-ND-SI registered with the Reserve Bank and HFCs registered with National Housing Bank, provided the tenor of the bonds is not less than three years, proceeds from such bonds shall only be utilised for refinancing existing debt of the NBFCs-ND-SI/HFCs. -
In order to encourage NBFCs to securitise/assign their eligible assets, the Reserve Bank has relaxed the minimum holding period (MHP) requirement till December 31, 2019 for originating NBFCs in respect of loans of original maturity above 5 years, subject to certain conditions. -
All scheduled commercial banks (excluding Regional Rural Banks and Small Finance Banks) were allowed to co-originate loans with NBFCs-ND-SI for the creation of eligible priority sector assets, facilitating sharing of risks and rewards. -
Asset Finance Companies, Loan Companies, and Investment Companies were merged into a new category called NBFC- Investment and Credit Company (NBFC-ICC), reducing the complexities arising from multiple categories and also providing the NBFCs greater flexibility in their operations. -
Exposures to all NBFCs excluding CICs would be risk weighted as per the ratings assigned by the rating agencies registered with the SEBI and accredited by the Reserve Bank in a manner similar to that of corporates under the existing regulations; exposure to CICs, rated as well as unrated, will continue to be risk-weighted at 100 per cent. -
Large NBFCs, with asset size of more than ₹5000 crore were required to appoint a functionally independent Chief Risk Officer (CRO) with clearly specified role and responsibilities, with involvement in the process of identification, measurement and mitigation of risks. -
The Reserve Bank has revised guidelines to raise the standard of asset-liability management (ALM) framework of NBFCs including Core Investment Companies (CICs). The revised guidelines stipulates more granular maturity buckets and tolerance limits along with adoption of liquidity risk monitoring tools, including stress testing and diversification of funding. The framework requires maintenance of a liquidity buffer in terms of a liquidity coverage ratio (LCR) starting at 50 per cent for all deposit taking NBFCs and all non-deposit taking NBFCs (NBFCs- ND) with an asset size of ₹10,000 crore and above and 30 per cent for all NBFCs-ND with an asset size of ₹5,000 crore and above but less than ₹ 10,000 crore, from December 1, 2020 to reach 100 per cent on December1, 2024. -
All NBFCs-ND-SI were advised to take appropriate action as envisaged under the interest subvention scheme for micro, small and medium enterprises (MSMEs) announced by Government of India on November 02, 2018, in which 2 per cent interest subvention for all GST registered MSMEs, on fresh or incremental loans will be given (This scheme will continue over 2018-19 and 2019-20 with SIDBI designated as the nodal agency for the purpose of channelising of interest subvention to the various lending institutions). In January 2019, a one-time restructuring of existing loans to MSMEs that were in default but ‘standard’ as on January 1, 2019 was permitted without an asset classification downgrade. -
NBFCs-ND-SI in the category of ICCs would be eligible to apply for grant of Authorised Dealer Category II licence. -
All government-owned NBFCs-ND-SI and government-owned NBFCs-D have been brought under the Reserve Bank’s on-site inspection framework and off-site surveillance commencing from the inspection cycle 2018-19. -
The Ombudsman Scheme for NBFCs-D was extended to eligible NBFCs-ND, with an asset size of ₹100 crore or above with customer interface. -
The Reserve Bank front-loaded the increase in the facility to avail liquidity for liquidity coverage ratio (FALLCR) of 0.5 per cent each of banks’ NDTL scheduled for August 1 and December 1, 2019, respectively, for incremental credit given to NBFCs and HFCs, over and above credit outstanding to NBFCs and HFCs as on July 5, 2019. Other Measures announced in the Budget -
The Government of India has rolled out the scheme to provide a one-time partial credit guarantee for the first loss up to 10 per cent to public sector banks (PSBs) for purchase of high-rated pooled assets amounting to ₹1 lakh crore from financially sound NBFCs/HFCs. -
FIIs/FPIs to be permitted to make investments in debt securities issued by Infrastructure Debt Fund– Non-Bank Finance Companies (IDF-NBFCs) to be transferred/sold to any domestic investor within the specified lock-in period. -
NBFCs, not registered as NBFCs-Factor, will be brought on the Trade Receivables Discounting System (TReDS) platform, through amendment in the Factoring Regulation Act, 2011. All NBFCs would directly participate on the TReDS platform. -
Interest on bad or doubtful debts to be taxed in the year in which the interest is actually received by NBFCs-ND-SI. |
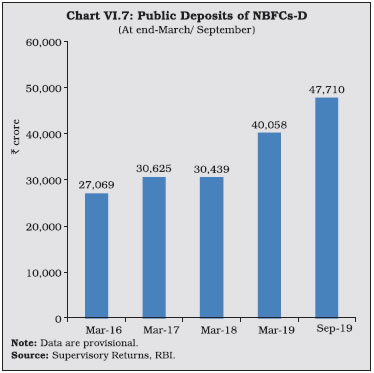
 2.5 NBFCs-D: Deposits VI.17 Deposit mobilisation by NBFCs progressed at a robust pace of 31.6 per cent in 2018-19 even though the number of companies authorised to accept deposits came down from 168 in 2017-18 to 88 in 2018-19 and 82 at end- September 2019 (Chart VI.7). 2.6 Financial Performance of NBFCs VI.18 NBFCs’ profitability deteriorated in 2018- 19, attributable to the NBFCs-ND-SI segment. Their operating expenditures and interest payments grew significantly, as reflected in their higher cost-to-income ratio. With growth in expenditure outpacing income growth, net profit remained stagnant. For NBFCs-D on the other hand, profit grew robustly in 2018-19, on the back of fund-based income, with substantial decrease in operating expenditure (Table VI.8, Appendix VI.4 and VI.5). 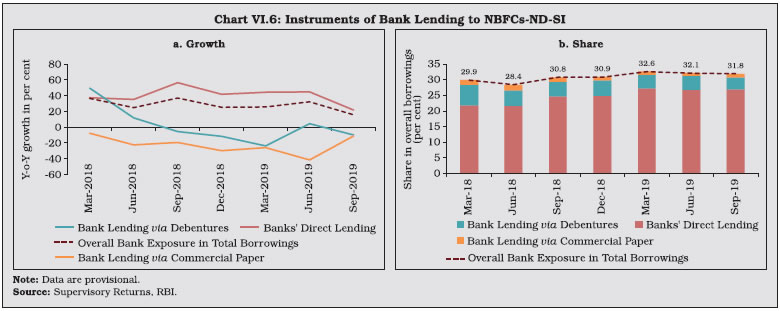
| Table VI.8: Financial Parameters of the NBFC Sector | | (Amount in ₹ crore) | | Items | 2017-18 | 2018-19 | H1 :2019-20 | | NBFCs | NBFCs- ND-SI | NBFCs-D | NBFCs | NBFCs- ND-SI | NBFCs-D | NBFCs | NBFCs- ND-SI | NBFCs-D | | 1 | 2 | 3 | 4 | 5 | 6 | 7 | 8 | 9 | 10 | | A. Income | 3,00,262 | 2,52,583 | 47,679 | 3,36,842 | 2,75,365 | 61,478 | 1,90,387 | 1,55,819 | 34,569 | | | (20.1) | (20.2) | (19.5) | (12.2) | (9.0) | (28.9) | (11.1) | (9.6) | (18.8) | | B. Expenditure | 2,40,222 | 2,03,129 | 37,092 | 2,68,968 | 2,24,288 | 44,680 | 1,52,380 | 1,26,536 | 25,844 | | | (20.6) | (21.7) | (14.8) | (12.0) | (10.4) | (20.5) | (11.8) | (10.0) | (21.8) | | C. Net Profit | 41,989 | 35,023 | 6,966 | 46,265 | 35,035 | 11,230 | 26,539 | 20,394 | 6,145 | | | (29.8) | (28.0) | (39.4) | (10.2) | (0.0) | (61.2) | (7.1) | (4.1) | (18.4) | | D. Total Assets | 26,17,790 | 22,76,631 | 3,41,159 | 30,85,480 | 26,63,588 | 4,21,892 | 32,57,642 | 28,03,637 | 4,54,006 | | | (19.7) | (19.0) | (24.2) | (17.9) | (17.0) | (23.7) | (13.2) | (13.1) | (14.1) | | E. Financial Ratios (as per cent of Total Assets) | | | | | | | | | | | (i) Income | 11.5 | 11.1 | 14.0 | 10.9 | 10.3 | 14.6 | 5.8 | 5.6 | 7.6 | | (ii) Expenditure | 9.2 | 8.9 | 10.9 | 8.7 | 8.4 | 10.6 | 4.7 | 4.5 | 5.7 | | (iii) Net Profit | 1.6 | 1.5 | 2.0 | 1.5 | 1.3 | 2.7 | 0.8 | 0.7 | 1.4 | | F. Cost to Income Ratio (Per cent) | 80.0 | 80.4 | 77.8 | 79.8 | 81.5 | 72.7 | 80.0 | 81.2 | 74.8 | Notes: 1. Data are provisional.
2. Figures in parenthesis indicate Y-o-Y growth in per cent.
Source: Supervisory Returns, RBI. | 2.7 Profitability VI.19 The profitability indicators of NBFCs– return on assets (RoA), return on equity (RoE) and net interest margin (NIM) decreased in 2018-19, reflecting the stress in the sector (Chart VI.8). The overall decrease in profitability was driven by NBFCs- ND-SI for almost all categories. For NBFCs-MFI, profitability improved considerably (Chart VI.9). However, NBFCs-ND-SI posted an improvement in profitability indicators in the current financial year till September 2019, on the back of decline in other expenses. VI.20 In the case of NBFCs-D, there was improvement in RoA and RoE in 2018-19 on account of robust growth in business. Their NIM also improved, reflecting faster expansion in interest income than that of expenses (Chart VI.10). In 2019-20 so far (up to September), profitability indicators of NBFCs-D showed overall improvements. 2.8 Asset Quality VI.21 In 2018-19, NBFCs registered a deterioration of asset quality. While the gross non-performing assets (GNPAs) ratio increased, net non-performing assets (NNPAs) ratio edged up marginally, reflecting sufficient provisioning (Chart VI.11). In 2019-20 (up to September), asset quality of the sector showed deterioration with a slight increase in GNPA ratio.
VI.22 In terms of asset composition, the proportion of standard assets declined, part of it being downgraded to the substandard category in 2018-19. In H1:2019-20, while the proportion of sub-standard assets remained unchanged, an increase in proportion of doubtful assets was observed in the period under review (Chart VI.12).
VI.23 In 2018-19, GNPA ratio of NBFCs-ND-SI deteriorated across all categories, except NBFCs-MFI, which reported significant improvement in the GNPA ratio. The improvement in the GNPA ratio of the NBFCs- MFI may be attributed to write offs of aging loans (Chart VI.13a). The NNPA ratio for NBFCs-ND-SI edged up marginally, reflecting the maintenance of adequate buffers, especially by MFIs and IFCs. On the other hand, there was a small increase in the NNPA ratio of ICCs (Chart VI.13b). In 2019-20 (up to September), the GNPA ratio of NBFCs-ND-SI exhibited an increase, while, the NNPA ratio registered no change.
VI.24 The risk aversion among NBFCs-ND -SI coupled with their inability to mobilise adequate resources was reflected in the decrease in credit growth in spite of a fall in stressed assets ratio3. However, for the services sector, stressed assets rose, reflecting the built-up stress in the real estate segment, where NBFC exposures are significant. (Chart VI.14). VI.25 In the case of NBFCs-D, decline in the GNPA was aided by buoyant growth in assets. On the other hand, the NNPA ratio showed a deterioration, pointing to inadequate provisioning (Chart VI.15). 2.9 Capital Adequacy VI.26 NBFCs are generally well capitalised, with the system level capital to risk-weighted assets ratio (CRAR) remaining well above the stipulated norm of 15 per cent, including in 2018-19 when they experienced an increase in non-performing assets (Chart VI.16). At the end of September 2019, the sector maintained the capital position although there was a deterioration in asset quality.
VI.27 The CRAR for all categories of NBFCs-ND-SI except NBFCs-MFI and IDF-NBFCs, decreased from 2017-18 levels, but it remained above the regulatory norm. For NBFCs-MFI, the CRAR improved with rising profitability. The CRAR for NBFCs-D registered a marginal improvement as growth in own funds outpaced expansion in loans and advances (Chart VI.17a and b). At end-September 2019, CRAR of NBFCs-ND-SI and NBFCs-D remained above the stipulated norm despite divergent trends.
2.10 Exposure to Sensitive Sectors VI.28 Capital market, real estate and commodities have been categorised as sensitive sectors by the Reserve Bank as prices of these assets are prone to fluctuations that may pose a risk to financial stability. By the end of March 2019, the capital market exposure of NBFCs had decreased compared to March 2018, even as real estate exposure edged down. As a result, an overall decrease in sensitive sector exposure was registered (Chart VI.18). 2.11 Residuary Non-Banking Companies (RNBCs) VI.29 RNBCs are primarily engaged in collecting deposits and deploying them in specific securities, as directed by the Reserve Bank. At present, there is only one RNBC, which is not accepting any new deposits and is solely engaged in repaying old deposits. VI.30 In sum, growth in the balance sheet of the NBFC sector decelerated in 2018-19, attributable to muted credit growth in a risk- averse climate. On the liabilities side, while market borrowings slowed down, bank borrowings continued to support the NBFC sector. Deposit mobilisation by NBFCs-D also showed an uptick. NBFCs continued to remain well-capitalised above the regulatory norm. Asset quality deteriorated across all NBFCs-ND-SI categories except that of NBFCs-MFI. Profitability of NBFCs-ND-SI waned while that of NBFCs-D registered an improvement. 2.12 Housing Finance Companies (HFCs) VI.31 Housing finance companies (HFCs) are specialised lending institutions which, along with SCBs, are the main providers of housing finance. The liquidity stress faced by the NBFC sector led to a sharp deceleration in the growth of credit extended by HFCs. On the other hand, bank credit to the housing sector picked up and grew at a robust pace in 2018-19, partially making up for the slowdown in HFC credit (Chart VI.19). VI.32 At the end of March 2019, there were 99 HFCs, of which only 18 were deposit taking entities. Non-government owned public limited companies dominate the segment with 94.4 per cent of total assets and grew at 14.5 per cent in 2018-19. The sole government HFC, with a share of 5.4 per cent in total assets, grew by an impressive 49 per cent in the same period (Table VI.9).
| Table VI.9: Ownership Pattern of HFCs | | (At end-March) | | (Amount in ₹ crore) | | Type | 2018 | 2019 | | Number of HFCs | Assets Size | Number of HFCs | Assets Size | | 1 | 2 | 3 | 4 | 5 | | A. Government Companies | 1 | 48,930 | 1 | 72,839 | | B. Non-Government Companies (1+2) | 90 | 11,10,837 | 98 | 12,72,300 | | 1. Public Ltd. Companies | 72 | 11,09,324 | 78 | 12,69,634 | | 2. Private Ltd. Companies | 18 | 1,513 | 20 | 2,667 | | Total (a+B) | 91 | 11,59,767 | 99 | 13,45,139 | Note: 1. Data are provisional,
2. In 2019, asset size pertains to 96 HFCs only.
Source: NHB. | 2.12.1 Balance Sheet VI.33 The consolidated balance sheet of HFCs showed reasonable expansion in 2018- 19, although considerably lower than in the previous year on account of moderation in credit and investment growth. On the liabilities side, bank borrowings grew at a robust pace but borrowings via market instruments like debentures and commercial paper decelerated significantly, reflecting the waning of market confidence (Table VI.10 and Chart VI.20). 2.12.2 Resource Profile of HFCs VI.34 The sources of funds for HFCs include public deposits, external commercial borrowings, commercial papers and refinance support provided by NHB, though they primarily rely on debentures and bank borrowings (Chart VI.20). The dependence of HFCs on external sources grew as domestic markets remained risk averse. | Table VI.10: Consolidated Balance sheet of HFCs | | (At end- March) | | (Amount in ₹ crore) | | Items | 2017 | 2018 | 2019 | Percentage variation | | 2017-18 | 2018-19 | | 1 | 2 | 3 | 4 | 5 | 6 | | 1. Share capital | 9,352 | 30,548 | 34,360 | 226.6 | 12.5 | | 2. Reserves and surplus | 94,283 | 1,25,922 | 1,54,807 | 33.6 | 22.9 | | 3. Public deposits* | 1,12,099 | 1,21,886 | 1,07,389 | 8.7 | -11.9 | | 4. Debentures | 3,37,199 | 4,11,317 | 4,76,297 | 22.0 | 15.8 | | 5. Bank borrowings | 1,77,877 | 2,35,958 | 3,27,500 | 32.7 | 38.8 | | 6. Borrowings from NHB | 22,732 | 28,870 | 28,287 | 27.0 | -2.0 | | 7. Inter-corporate borrowings | 2,008 | 4,013 | 35,627 | 99.9 | 787.8 | | 8. Commercial papers | 68,587 | 98,324 | 80,646 | 43.4 | -18.0 | | 9. Borrowings from Government | - | - | - | - | - | | 10. Subordinated debts | 16,279 | 20,200 | 18,595 | 24.1 | -7.9 | | 11. Other borrowings | 18,599 | 21,146 | 25,103 | 13.7 | 18.7 | | 12. Current liabilities | 24,673 | 32,052 | 14,003 | 29.9 | -56.3 | | 13. Provisions | 8,425 | 12,812 | 8,578 | 52.1 | -33.0 | | 14. Other** | 17,101 | 18,410 | 40,397 | 7.7 | 119.4 | | 15. total liabilities/ assets | 9,09,215 | 11,61,459 | 13,51,590 | 27.7 | 16.4 | | 16. Loans and advances | 7,37,461 | 9,45,149 | 11,91,727 | 28.2 | 26.1 | | 17. Hire purchase and lease assets | 2 | 4 | 0 | 121.5 | -94.6 | | 18. Investments | 55,151 | 73,877 | 90,406 | 34.0 | 22.4 | | 19. Cash and bank balances | 22,729 | 19,578 | 34,376 | -13.9 | 75.6 | | 20. Other assets*** | 93,871 | 1,22,851 | 35,082 | 30.9 | -71.4 | *Public deposits given in the table include corporate deposits of a major HFC.
**includes deferred tax liabilities and other liabilities.
***includes fixed assets, tangible and intangible assets, other assets and deferred tax asset.
Notes: 1. Data are provisional, based on Ind AS as per Annual Reports of reporting companies.
2. Information submitted by 84 out of 91 HFCs as on 31-03-2018.
3. Information submitted by 83 out of 99 HFCs as on 31-03-2019. | VI.35 Public deposits are another important source of funding for HFCs. Deposit growth accelerated in 2018-19 (Chart VI.21); however, the share of deposits in total liabilities of HFCs has been steadily declining since 2014-15. The distribution of HFC deposits shows that almost 95 per cent of the deposits is concentrated in the 6-9 per cent interest rate bracket (Chart VI.22). Furthermore, a maturity-wise analysis shows that depositors’ preference is largely for the maturity period between 24 to 48 months, though deposit mobilisation slowed for this slab in 2018-19. The acceleration in deposit growth was seen for the 12-24 months and 60 months maturities.
2.12.3 Financial Performance VI.36 Income and expenditure of HFCs grew at a faster rate in 2018-19 than a year ago. However, expenditure grew at a relatively faster pace, leading to an absolute decline in net profit (Chart VI.23). Income as a proportion to total assets grew on account of increase in fund-based earnings, while expenditure increased on account of higher financial and operating expenses. As a result, there was a significant jump in the cost to income ratio of HFCs in 2018-19. Meanwhile, the RoA deteriorated due to the decline in profits (Table VI.11). 2.12.4 Soundness Indicators VI.37 GNPA and NNPA ratios increased in 2017-18. While the GNPA ratio stabilised in 2018-19, the NNPA ratio crept up further during the year, reflecting a decrease in provisions maintained by HFCs (Chart VI.24). However compared to other NBFCs, HFCs presented better asset quality. VI.38 To sum up, in 2018-19, the liquidity stress faced by the NBFC sector also spilled over to the domain of housing finance, leading to a deceleration in credit extended by HFCs and adversely affecting their profitability. Since August 2019, HFCs have been brought under the regulatory purview of the Reserve Bank, which has taken swift measures to address governance concerns and payment defaults by a prominent HFC, thereby facilitating resolution of stress in the company and securing investors’ interest. 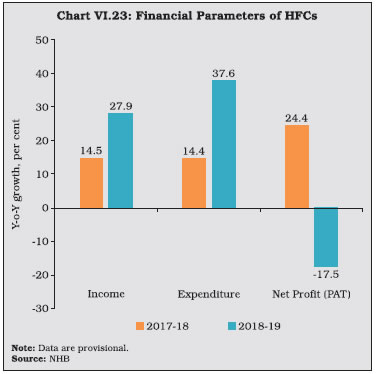
| Table VI.11: Financial Ratios of HFCs | | (As per cent of Total Assets) | | (At end-March) | | Particulars | 2015 | 2016 | 2017 | 2018 | 2019 | | 1 | 2 | 3 | 4 | 5 | 6 | | Total Income | 10.8 | 10.5 | 10.0 | 9.0 | 10.0 | | 1. Fund Income | 10.6 | 10.3 | 9.8 | 8.8 | 9.8 | | 2. Fee Income | 0.2 | 0.2 | 0.2 | 0.2 | 0.2 | | Total Expenditure | 7.8 | 7.5 | 7.4 | 6.6 | 7.9 | | 1. Financial Expenditure | 7.1 | 6.8 | 6.4 | 5.7 | 6.4 | | 2. Operating Expenditure | 0.7 | 0.7 | 0.9 | 1.0 | 1.5 | | Tax Provision | 0.9 | 0.9 | 0.8 | 0.7 | 0.7 | | Cost to Income Ratio (Total Exp./Total Income) | 72.6 | 71.6 | 73.6 | 73.6 | 79.1 | Return on Assets (RoA)
(PAT/Total Assets) | 2.0 | 2.0 | 2.1 | 2.0 | 1.4 | Note: Data are provisional.
Source: NHB. |
3. All India Financial Institutions VI.39 The Reserve Bank regulates and supervises four all India financial institutions (AIFIs), viz., Export Import Bank of India (EXIM Bank), National Bank for Agriculture and Rural Development (NABARD), Small Industries Development Bank of India (SIDBI) and the National Housing Bank (NHB). Consequent to the Reserve Bank’s divestment of its entire shareholding in NHB on March 19, 2019, it has become an entirely government-owned institution (Chart VI.25). 3.1 AIFIs’ Operations4 VI.40 Financial assistance sanctioned by AIFIs during 2018-19 increased by 7.6 per cent, whereas disbursement growth rate recorded a deceleration at 6.9 per cent in 2018-19 on the top of 21.1 per cent in 2017-18. Barring EXIM Bank, disbursement by other AIFIs expanded during the year, with the largest expansion recorded by NABARD by augmenting its line of credit under refinance and direct loans. Further, NABARD has also sanctioned and disbursed under Pradhan Mantri Awas Yojana Gramin (PMAY-G), Swachh Bharat Mission Gramin (SBM-G), Dairy Processing and Infrastructure Development Fund (DIDF) and Green Climate Fund (GCF) during the year (Table VI.12 and Appendix Table VI.6). 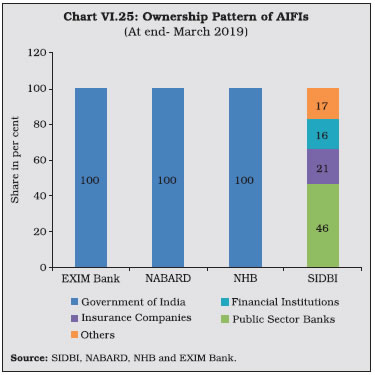
| Table VI.12: Financial Assistance Sanctioned and Disbursed by AIFIs | | (Amount in ₹ crore) | | Category | 2017-18 | 2018-19 | | S | D | S | D | | 1 | 2 | 3 | 4 | 5 | | 1. SIDBI | 59,452 | 75,386 | 59,046 | 76,011 | | 2. NABARD | 2,00,847 | 2,23,754 | 3,03,870 | 2,81,947 | | 3. NHB | 44,934 | 24,921 | 32,753 | 25,177 | | 4. EXIM BANK | 97,826 | 68,535 | 38,001 | 36,660 | | Total | 4,03,059 | 3,92,595 | 4,33,670 | 4,19,795 | S: Sanction D: Disbursement
Source: SIDBI, NABARD, NHB and EXIM Bank. | 3.2 Balance Sheet VI.41 The AIFIs’ consolidated balance sheet grew at a faster pace in 2018-19 on the back of robust expansion in loans and advances (Table VI.13). Loans and advances constituted the largest share of assets followed by investments. On the liabilities side, AIFIs’ reliance on borrowings accelerated in order to finance enhanced credit disbursements and investment activities, while their borrowings through bonds and debentures moderated. Borrowings by EXIM Bank declined in 2018-19 due to erosion in its net owned fund (NOF) in 2017-18, resulting in the EXIM Bank’s aggregate borrowings to NOF ratio exceeding the stipulated ceiling. With government’s infusion of fresh capital on March 22, 2019, the EXIM bank’s NOF has improved. VI.42 NHB accounted for more than half of the total resources raised in 2018-19, followed by NABARD and SIDBI, while the share of the EXIM Bank constituted the least. AIFIs largely rely on short-term funds for financing their activities, particularly NHB which raises over 97 per cent of its resources via this medium. However, in the case of NABARD, there was a perceptible shift towards long-term funds, while SIDBI’s reliance on short term funds increased (Table VI.14). | Table VI.13: AIFIs’ Balance Sheet | | (Amount in ₹ crore) | | Items | 2018 | 2019 | Percentage Variation | | 1 | 2 | 3 | 4 | | Liabilities | | | | | 1. Capital | 19,921 | 26,921 | 35.1 | | | (2.8) | (3.2) | | | 2. Reserves | 51,076 | 57,042 | 11.7 | | | (7.3) | (6.8) | | | 3. Bonds and Debentures | 1,85,011 | 2,09,059 | 13.0 | | | (26.3) | (25.1) | | | 4. Deposits | 2,91,301 | 3,36,914 | 15.7 | | | (41.5) | (40.4) | | | 5. Borrowings | 1,00,547 | 1,49,319 | 48.5 | | | (14.3) | (17.9) | | | 6. Other Liabilities | 54,447 | 54,300 | -0.3 | | | (7.8) | (6.5) | | | Total liabilities/assets | 7,02,302 | 8,33,554 | 18.7 | | Assets | | | | | 1. Cash and Bank Balances | 23,740 | 23,437 | -1.3 | | | (3.4) | (2.8) | | | 2. Investments | 49,529 | 61,256 | 23.7 | | | (7.1) | (7.3) | | | 3. Loans and Advances | 6,09,741 | 7,29,226 | 19.6 | | | (86.8) | (87.5) | | | 4. Other Assets | 15,542 | 17,882 | 15.1 | | | (2.2) | (2.1) | | Note: Figures in parentheses are percentages of total liabilities/assets.
Source: Audited OSMOS returns. |
| Table VI.14: Resources Mobilised by AIFIs in 2018-19 | | (Amount in ₹ crore) | | Institution | Total Resources Raised | Total Outstanding | | Long-Term | Short-Term | Foreign Currency | Total | | 1 | 2 | 3 | 4 | 5 | 6 | | 1. SIDBI | 53,670 | 47,865 | 205 | 1,01,740 | 1,31,622 | | 2. NABARD | 84,419 | 1,91,259 | 344 | 2,76,022 | 1,28,493 | | 3. NHB | 13,487 | 5,37,138 | 905 | 5,51,530 | 63,500 | | 4. EXIM BANK | - | 8,487 | 7,054 | 15,541 | 92,304 | | Total | 1,51,576 | 7,84,750 | 8,508 | 9,44,833 | 4,15,919 | Note: Long-term rupee resources comprise borrowings by way of bonds/ debentures; while short-term resources comprise CPs, term deposits, ICDs, CDs and borrowings from the term money market . Foreign currency resources largely comprise of borrowings by way of bonds, etc. in the international market.
Source: SIDBI, NABARD, NHB and EXIM Bank. |
| Table VI.15: Resources Raised by AIFIs from the Money Market | | (At end-March)# | | (Amount in ₹ crore) | | Instrument | 2017-18 | 2018-19 | | 1 | 2 | 3 | | A. Total | 1,17,049 | 1,36,577 | | i) Term Deposits | 3,931 | 5,420 | | ii) Term Money | 3,228 | 4,067 | | iii) Inter-corporate Deposits | 7,850 | 7,431 | | iv) Certificate of Deposits | 18,448 | 32,436 | | v) Commercial Paper | 83,593 | 69,363 | | Memo Items; | | | | B. Umbrella limit | 66,925 | 1,03,887 | C. Utilisation of umbrella limit*
(A as percentage of B) | 175 | 131 | #: End-June for NHB. *: Resources raised under A.
Note: AIFIs are allowed to mobilise resources within the overall ‘umbrella limit’, which is linked to the net owned funds (NOF) of the FI concerned as per its latest audited balance sheet. The umbrella limit is applicable for five instruments– term deposits; term money borrowings; certificates of deposits (CDs); commercial paper (CPs); and inter-corporate deposits.
Source: SIDBI, NABARD, NHB and EXIM Bank. |
VI.43 Resource mobilisation by the AIFIs through money market instruments like certificate of deposits, term deposits and term money increased during 2018-19. Issuances of commercial paper declined across all AIFIs. The utilisation of borrowing limits remained high (Table VI.15). The NABARD and the SIDBI together constituted around 80 per cent of resources raised by the AIFIs from the money market. 3.3 Sources and Uses of Funds VI.44 Funds raised and deployed by the AIFIs grew by 13.4 per cent in 2018-19 compared with a doubling of resources raised in the previous year. Repayment of past borrowings constituted 64.3 per cent of the resources mobilised which were essentially through internal sources (Table VI.16). 3.4 Maturity and Cost of Borrowings and Lending VI.45 The weighted average cost (WAC) of rupee resources raised by NABARD and SIDBI increased in 2018-19, while the other two financial institutions were able to borrow at similar rates (Chart VI.26a). The weighted average maturity (WAM) of rupee resources increased for all the institutions except NHB (Chart VI.26b). Thus the AIFIs elongated their average maturity period accompanied by rising long-term costs. | Table VI.16: Pattern of AIFIs’ Sources and Deployment of Funds | | (Amount in ₹ crore) | | Items | 2017-18 | 2018-19 | Percentage Variation | | 1 | 2 | 3 | 4 | | A. Sources of funds | | | | | (i) Internal | 12,88,774 | 31,32,555 | 143.1 | | | (38.2) | (82.0) | | | (ii) External | 19,48,028 | 5,99,920 | -69.2 | | | (57.8) | (15.7) | | | (iii) Others* | 1,32,572 | 87,930 | -33.7 | | | (3.9) | (2.3) | | | Total (i+ii+iii) | 33,69,374 | 38,20,405 | 13.4 | | | (100) | (100) | | | B. Deployment of Funds | | | | | (i) Fresh Deployment | 6,85,147 | 7,77,016 | 13.4 | | | (20.3) | (20.3) | | | (ii) Repayment of Past | 20,98,207 | 24,58,210 | 17.2 | | Borrowings | (62.3) | (64.3) | | | (iii) Other Deployment | 5,86,020 | 5,85,179 | -0.1 | | | (17.4) | (15.3) | | | Of which: Interest Payments | 32,248 | 42,007 | 30.3 | | | (1.0) | (1.1) | | | Total (i+ii+iii) | 33,69,374 | 38,20,405 | 13.4 | | | (100) | (100) | | *: Includes cash and balances with banks and the RBI.
Note: Figures in parentheses are percentages of total.
source: SIDBI, NABARD, NHB and EXIM Bank. |
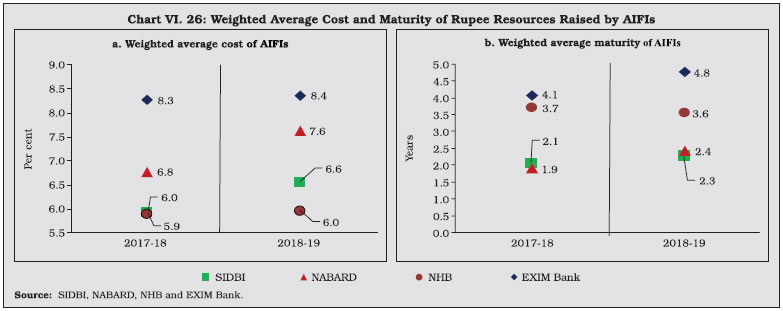
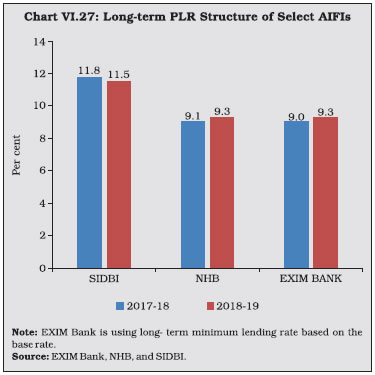 VI.46 The long-term prime lending rate (PLR) in 2018-19 marginally increased for EXIM Bank and NHB and decreased for SIDBI, reflecting that the monetary easing cycle did not lead to a reduction in the cost of funds for the former institutions (Chart VI.27). 3.5 Financial Performance VI.47 AIFIs posted robust growth in income during 2018-19, driven by substantial increase in interest income. However, expenditure expanded at a faster pace, primarily on account of interest expenses. Operating expenses decreased due to a reduction in the wage bill and as a result, net profits of AIFIs posted a robust growth during 2018-19 (Table VI.17). All financial ratios, except operating profit increased or remained unchanged in 2018-19 as compared to previous year (Chart VI.28). VI.48 During 2018-19, there was an increase in net profit per employee for all AIFIs on account of increase in interest income. This increase was more prominent for EXIM Bank. Except the SIDBI, the operating profits of all the AIFIs improved, indicating efficient utilisation of working capital (Table VI.18). VI.49 The return on assets (RoA) for all AIFI’s remained stagnant or moderated in 2018-19, except for EXIM Bank, which posted a turnaround from negative RoA to marginally positive one. However, the CRAR for all AIFIs remained higher than the stipulated norm of 9 per cent (Chart VI.29). 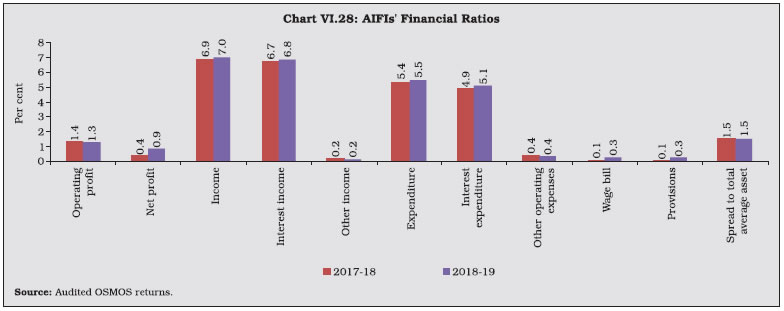
| Table VI.17 Financial Performance of AIFIs | | (Amount in ₹ crore) | | Items | 2017-18 | 2018-19 | Percentage Variation | | 2017-18 | 2018-19 | | 1 | 2 | 3 | 4 | 5 | | A) Income | 44,195 | 53,957 | 4.2 | 22.1 | | a) Interest Income | 42,988 | 52,699 | 5.1 | 22.6 | | | (97.3) | (97.7) | | | | b) Non Interest Income | 1,207 | 1,258 | -19.6 | 4.2 | | | (2.7) | (2.3) | | | | B) Expenditure | 34,468 | 42,109 | 6.3 | 22.2 | | a) Interest Expenditure | 31,646 | 39,321 | 6.2 | 24.3 | | | (91.8) | (93.4) | | | | b) Operating Expenses | 2,822 | 2,789 | 7.3 | -1.2 | | | (8.2) | (6.6) | | | | of which Wage Bill | 2,068 | 1,987 | -22.2 | -3.9 | | c) Provisions for taxation | 503 | 2,283 | -62.4 | 354.2 | | D) Profit | | | | | | Operating Profit (PBT) | 8,882 | 10,294 | 29.0 | 15.9 | | Net Profit (PAT) | 2,752 | 6,683 | -52.8 | 142.9 | Note: Figures in parentheses are percentages of total income/expenditure.
Source: Audited OSMOS returns. | 3.6 Soundness Indicators VI.50 The total amount of the AIFIs’ net NPAs as well as their net NPA ratio declined during 2018-19. There was substantial decrease in NPAs of EXIM Bank but SIDBI reported a marginal increase in its NPAs (Chart VI.30). The sharp decline in net NPA of EXIM bank was partly reflective of higher provisioning. | Table VI.18: AIFIs’ Select Financial Parameters | | Institution | Interest Income/
Average Working Funds
(per cent) | Non-interest Income/
Average Working Funds
(per cent) | Operating Profit/ Average
Working Funds
(per cent) | Net Profit per Employee
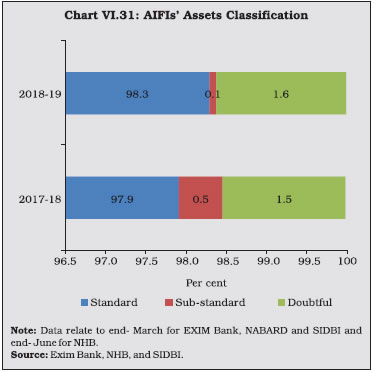
(₹ lakh) | | | 2018 | 2019 | 2018 | 2019 | 2018 | 2019 | 2018 | 2019 | | 1 | 2 | 3 | 4 | 5 | 6 | 7 | 8 | 9 | | EXIM | 7.2 | 7.8 | 0.5 | 0.3 | 1.7 | 1.9 | -860 | 23 | | NABARD | 6.5 | 6.6 | 0.1 | 0.0 | 1.2 | 1.2 | 74 | 89 | | NHB | 7.1 | 7.1 | 0.1 | 0.4 | 2.0 | 2.6 | 648 | 672 | | SIDBI | 6.9 | 6.9 | 0.5 | 0.3 | 2.2 | 1.8 | 126 | 176 | | Source: SIDBI, NABARD, NHB and EXIM Bank. | VI.51 AIFIs experienced turnaround in asset quality as some portion of sub-standard assets moved to standard assets, whereas a portion of assets experienced aging of NPAs as sub-standard assets moved to the doubtful category in 2018-19 (Chart VI.31). This was particularly true for EXIM Bank, which accounted for around 95 per cent of the doubtful assets of AIFIs. 4. Primary Dealers VI.52 As on September 30, 2019, there were 21 primary dealers (PDs) – 14 run as bank departments and 7 standalone PDs (SPDs)- registered as NBFCs under Section 45-IA of the RBI Act, 1934. 4.1 Operations and Performance of PDs VI.53 PDs are mandated to underwrite issuances of government dated securities and participate in primary auctions. They are also mandated to achieve a minimum success ratio (bids accepted as a proportion to bidding commitment) of 40 per cent in primary auctions of T-bills and Cash Management Bills (CMBs), assessed on a half-yearly basis. In 2018-19, all PDs outperformed their minimum bidding commitments. They achieved a share of 71.4 per cent in total issuance of T-Bills and CMBs during the year, higher than 66.5 per cent achieved in the previous year. In H1: 2019-20, PDs achieved a share of 73.2 per cent in total issuance of T-Bills and CMBs. The government issued dated securities with face value of ₹5,71,000 crore through auctions, as against ₹5,88,000 crore issued during the previous year. PDs’ share of allotment in the primary issuances of dated securities reduced to 50.6 per cent in 2018-19, compared to 53.7 per cent in the previous year. During H1: 2019-20, against total issuance of ₹4,42,000 crore, allotment to PDs stood at 44.8 per cent as against 46.9 per cent during H1: 2018-19 (Table VI.19). 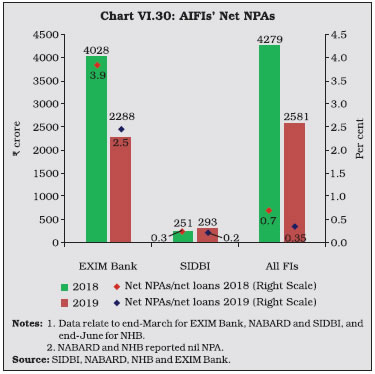
 VI.54 Partial devolvement on PDs took place on seven instances amounting to ₹14,600 crore during 2018-19 as against three instances for ₹10,297 crore in 2017-18. The underwriting commission paid to PDs during 2018-19 was considerably higher at ₹139.9 crore when compared to ₹61.3 crore in the previous year, which can be attributed to higher devolvement during the year. As a result, the average rate of underwriting commission rose in 2018-19 (Chart VI.32). The total devolvement during H1: 2019-20 aggregated to ₹3,606 crore. The underwriting commission paid to PDs during the same period amounted to ₹24.4 crore, which works out to 0.55p/₹100. | Table VI.19: Performance of PDs in the Primary Market | | (Amount in ₹ crore) | | Items | 2017-18 | 2018-19 | H1:2019-20 | | 1 | 2 | 3 | 4 | | Treasury Bills and CMBs | | | | | (a) Bidding commitment | 10,13,580 | 9,99,551 | 6,00,229 | | (b) Actual bids submitted | 49,35,246 | 37,32,398 | 21,18,241 | | (c) Bid to cover ratio | 4.9 | 3.7 | 3.5 | | (d) Bids accepted | 5,77,232 | 6,70,849 | 3,79,138 | | (e) Success ratio (d) / (a) (in Per cent) | 56.9 | 67.1 | 63.2 | | Central Government Dated Securities | | | | | (f) Notified amount | 5,88,000 | 5,71,000 | 4,42,000 | | (g) Actual bids submitted | 13,96,471 | 12,60,201 | 9,16,590 | | (h) Bid to cover ratio | 2.4 | 2.2 | 2.1 | | (i) Bids of PDs accepted | 3,15,641 | 2,88,748 | 1,97,967 | | (j) Share of PDs (i)/(f) (in per cent) | 53.7 | 50.6 | 44.8 | | Source: Returns filed by PDs. | VI.55 In the secondary market, all PDs individually achieved the required minimum annual total turnover ratio (both in outright and repo transactions). The minimum turnover targets combining repo transactions and outright transactions for G-secs is set at 5 times the average month-end stock of securities held, of which the minimum ratio to be achieved through outright transactions exclusively is 3 times. For T-Bills, the corresponding minimum targets are 10 times and 6 times, respectively. 4.2 Performance of Standalone PDs VI.56 In the secondary market, the turnover of SPDs decreased in the outright segment while it increased in the repo segment during 2018-19. The SPDs’ share in total market turnover grew marginally on account of their improved share in market repo turnover. For the period H1: 2019-20, the share of SPDs in the secondary market in the outright and repo segment was 15.0 per cent and 24.0 per cent, respectively. Total market share across both segments was 19.3 per cent (Table VI.20). | Table VI.20: Performance of SPDs in the G-secs Secondary Market | | (Amount in ₹ crore) | | Items | 2017-18 | 2018-19 | H1:2019-20 | | 1 | 2 | 3 | 4 | | Outright | | | | | Turnover of SPDs | 37,34,289 | 27,74,591 | 22,09,109 | | Market turnover | 1,13,99,881 | 93,55,007 | 1,46,85,037 | | Share of SPDs (Per cent) | 32.8 | 29.7 | 15.0 | | Repo | | | | | Turnover of SPDs | 40,45,407 | 47,57,405 | 32,00,951 | | Market turnover | 1,27,80,289 | 1,35,66,142 | 1,33,47,579 | | Share of SPDs (Per cent) | 31.7 | 35.1 | 24.0 | | Total (outright + Repo) | | | | | Turnover of SPDs | 77,79,696 | 75,31,996 | 54,10,060 | | Market turnover | 2,41,80,170 | 2,29,21,149 | 2,80,32,615 | | Share of SPDs (Per cent) | 32.2 | 32.9 | 19.3 | Notes: 1. Total turnover under outright trades is total of buy and sell.
2. Total turnover for standalone PDs for outright and repo trades includes both sides quantity that is, buy+sell.
3. In case of repo, only 1st leg is considered for SPDs’ turnover.
4. Total market turnover includes standalone PDs turnover for both outright and repo volume.
Source: Clearing Corporation of India Limited. | 4.3 Sources and Application of SPDs’ Funds VI.57 Funds mobilised by SPDs rose moderately on a year-on-year basis in 2018- 19. Borrowings remained the major source of SPDs’ funding, accounting for 89.7 per cent of the total sources of funds. The quantum of unsecured loans declined marginally, while secured borrowing increased. For the period H1:2019-20 also, borrowings continued remain the major source of funds amounting to 90 per cent of the total funding. Secured loans was the major component of total borrowings during the period (Table VI.21). VI.58 The holdings in HTM by the SPDs decreased steeply in 2018-19 due to adoption of Indian Accounting Standard (Ind-AS) in place of Indian Generally Accepted Accounting Principles (IGAAP). The largest share of SPDs funds are held in the form of current assets which increased during the year (Table VI.21). | Table VI.21: Sources and Applications of SPDs’ Funds | | (Amount in ₹ crore) | | Items | 2017-18 | 2018-19 | H1:2019-20 | Percentage Variation 2018-19 over 2017-18 | | 1 | 2 | 3 | 4 | 5 | | Sources of Funds | 47,870 | 55,133 | 68,155 | 15.2 | | 1. Capital | 1,447 | 1,609 | 1,609 | 11.2 | | 2. Reserves and surplus | 3,673 | 4,052 | 4,679 | 10.3 | | 3. Loans (a+b) | 42,749 | 49,472 | 61,867 | 15.7 | | (a) Secured | 31,581 | 38,696 | 49,108 | 22.5 | | (b) Unsecured | 11,169 | 10,776 | 12,759 | -3.5 | | Application of Funds | 47,870 | 55,133 | 68,155 | 15.2 | | 1. Fixed assets | 31 | 30 | 46 | -2.6 | | 2. HTM investments (a+b) | 2,099 | 454 | 581 | -78.4 | | (a) Government securities | 2,091 | 447 | 444 | -78.6 | | (b) Others | 7 | 7 | 136 | 0.0 | | 3. Current assets | 46,835 | 55,608 | 68,418 | 18.7 | | 4. Loans and advances | 848 | 640 | 2,619 | -24.6 | | 5. Current liabilities | 1,934 | 1,601 | 3,522 | -17.2 | | 6. Deferred tax | -6.6 | 7.5 | 17.9 | -214.1 | | 7. Others | -1.5 | -5.6 | -4.7 | 270.9 | | Source: Returns submitted by PDs. |
| Table VI.22: Financial Performance of SPDs | | (Amount in ₹ crore) | | Items | 2017-18 | 2018-19 | H1: 2019-20 | Variation 2018-19 over
2017-18 | | Amount | Per cent | | 1 | 2 | 3 | 4 | 5 | 6 | | A. Income (i to iii) | 3,042 | 3,518 | 2,924 | 476 | 15.6 | | (i) Interest and discount | 2,966 | 3,799 | 2,282 | 833 | 28.1 | | (ii) Trading profits | -2 | -344 | 619 | -342 | - | | (iii) Other income | 78 | 63 | 24 | -15 | -19.2 | | B. Expenses (i to ii) | 2,590 | 3,402 | 1,898 | 812 | 31.4 | | (i) Interest | 2,306 | 3,038 | 1,668 | 732 | 31.7 | | (ii) Other expenses including establishment and administrative costs | 285 | 363 | 230 | 78 | 27.4 | | C. Profit before tax | 452 | 444 | 874 | -8 | -1.8 | | D. Profit after tax | 292 | 304 | 667 | 12 | 4.1 | Note: Figures may not add up due to rounding-off.
source: Returns submitted by PDs. | 4.4 Financial Performance of SPDs VI.59 SPDs’ profit after tax (PAT) increased marginally in 2018-19 over a year ago (Appendix Table VI.7). A significant increase was observed in the interest and discount income due to increased holdings of treasury bills and G-secs, whereas trading profits were pulled down in a volatile yield scenario during the year. Overall, expenditure outpaced income due to an increase in interest expenses. During H1: 2019-20, PAT increased to ₹ 667 crore (Table VI.22). VI.60 Corresponding to the marginal increase in PAT, SPDs’ return on net worth also increased in 2018-19. Pulled down by decline in trading profits, however, the cost-income ratio of these SPDs deteriorated sharply in relation to the preceding year. During H1: 2019-20 however, trading profits rose sharply due to favourable market conditions for the SPDs, thereby resulting in improved cost to income ratio (Table VI.23). | Table VI.23: SPDs’ Financial Indicators | | (Amount in ₹ crore) | | Indicators | 2017-18 | 2018-19 | H1:2019-20 | | 1 | 2 | 3 | 4 | | (i) Net profit | 292 | 304 | 667 | | (ii) Average assets | 48,206 | 54,487 | 67,686 | | (iii) Return on average assets (Per cent) | 0.6 | 0.6 | 1.0 | | (iv) Return on net worth (Per cent) | 5.7 | 5.8 | 12.3 | | (v) Cost to income ratio (Per cent) | 37.7 | 75.7 | 18.3 | | Source: Returns submitted by PDs. |
VI.61 The combined CRAR for all SPDs dipped marginally in 2018-19, though remained comfortably above the mandated 15 per cent. Capital buffer position of SPDs improved in H1: 2019-20 (Chart VI.33 and Appendix Table VI.8). 5. Overall Assessment VI.62 Although the balance sheet size of the NBFCs constitutes 18.6 per cent of SCBs, it has emerged as an important pillar of the Indian financial system. The sector, which had witnessed a robust expansion in 2017-18, experienced headwinds in 2018-19 and 2019- 20 (up to September) as market sentiments turned negative post-IL&FS event and recent defaults by some companies. The Reserve Bank and the government have taken several measures to restore stability in the NBFC space. The Reserve Bank took measures to augment systemic liquidity, buttress standards of asset-liability management framework, ease flow of funds by relaxing ECB guidelines and strengthen governance and risk-management structures. The government provided additional support through the partial credit guarantee scheme, encouraging PSBs to acquire high-rated pooled assets of NBFCs. Furthermore, the Finance Bill 2019 through amendments in the RBI Act, 1934 conferred powers on the Reserve Bank to bolster governance of NBFCs. These measures are geared toward allaying investors’ apprehensions and aiding NBFCs in performing their role better. Going forward, the Reserve bank will continue to maintain constant vigil over NBFCs and take necessary steps to ensure overall financial stability.
|