Introduction 6.1 Non-banking financial institutions
(NBFIs) are an important part of the Indian financial system. A wide range of
financial institutions (FIs) have evolved in the Indian financial system over
the years, with a view to providing medium to long-term finance to different sectors
of the economy. The NBFIs at present consist of a heterogenous group of institutions,
catering to a wide range of financial requirements. The major intermediaries that
are included in the NBFI group are development finance institutions (DFIs) (which
are mostly Government-owned and have been the traditional providers of long-term
project loans), insurance companies, non-banking financial companies (NBFCs),
primary dealers (PDs) and capital market intermediaries such as mutual funds.
6.2 As on March 31, 2008 there were four development finance institutions regulated
by the Reserve Bank, viz., EXIM Bank, National Bank for Agriculture and
Rural Development (NABARD), National Housing Bank (NHB) and Small Industries Development
Bank of India (SIDBI). During 2007-08, two institutions, viz., IFCI Ltd.
and Tourism Finance Corporation of India (TFCI) Ltd, which are registered as NBFCs
with the Reserve Bank and were earlier exempted from NBFC regulations and as such
were being regulated as FIs, were restored to NBFC regulations. During 2007-08,
the Reserve Bank continued with the regulatory initiatives to further strengthen
the FIs. While financial assistance sanctioned by FIs accelerated sharply during
2007-08, the disbursements witnessed a modest deceleration. Concomitantly, their
balance sheets also expanded at a significantly higher rate. Though the net interest
income as well as non-interest income witnessed a sharp growth, the sharp rise
in operating expenses resulted in lower operating profits for the FIs. Asset quality
of FIs remained satisfactory during the year. The capital adequacy ratio, in general,
continued to be significantly higher than the minimum prescribed.
6.3Until
some years back, the prudential norms applicable to banking and non-banking financial
companies (NBFCs) were not uniform. Even within the NBFC group, the deposit taking
NBFCs (NBFCs-D) were subjected to more stringent norms as compared with non-deposit
taking NBFCs (NBFCs-ND). In recent years however, with a view to leveling the
playing field as also reducing the systemic risk in their operations, the Reserve
Bank has initiated steps to reduce the scope of ‘regulatory arbitrage’
between banks, NBFCs-D and NBFCs-ND. 6.4 The NBFCs-ND have inter-linkages
with financial markets, banks and other financial institutions. They have witnessed
substantial growth in number, product variety and size in recent years. In order
to address the systemic concerns arising from minimal regulation in the case of
non-deposit taking NBFCs, NBFCs-ND with asset size of Rs.100 crore and above have
been classified as systemically important NBFCs (NBFCs-ND-SI) and these are now
being subjected to limited regulations. A system of monthly reporting on important
parameters such as capital market exposure has been introduced. A system of asset-liability
management (ALM) reporting and additional disclosures in the balance sheet was
also introduced. With a view to further strengthening their resilience, their
CRAR has been enhanced to 12 per cent to be reached by March 31, 2009 and
further to 15 per cent by March 31, 2010. In order to address the issue of their
funding requirements, NBFCs-ND-SI have been permitted to augment their capital
funds by issuance of perpetual debt instruments (PDI) in rupees, subject to certain
conditions. In October 2008, the issue of transient liquidity strain being faced
by NBFCs-ND-SI was addressed and as a temporary measure, they were also permitted
to raise short-term foreign currency borrowings, under the approval route, subject
to certain conditions. On November 1, 2008, the facility of liquidity support,
which was earlier introduced for mutual funds, was extended to NBFCs also and
banks were allowed to avail liquidity support under the liquidity adjustment
facility (LAF) through relaxation in the maintenance of statutory liquidity ratio
(SLR) to the extent of up to 1.5 per cent of their net deposit and time liabilities
(NDTL). On November 15, 2008, the Reserve Bank announced that this special term
repo facility would continue till end-March 2009. 6.5 The assets/liabilities
of NBFCs (excluding residuary non-banking companies (RNBCs)) expanded at a much
higher rate during 2007-08 as compared with that during 2006-07. Financial performance
of NBFCs continued to improve during 2007-08. Both fund-based income (79.8 per
cent) and fee-based income (56.6 per cent) increased sharply. As a result, notwithstanding
the rise in expenditure, the operating profits and net profits also witnessed
a sharp rise. 6.6 In order to strengthen the market infrastructure of the
Government securities market and make it vibrant, liquid and broad-based, the
primary dealers (PDs) system in the Government securities market was introduced
by Reserve Bank in 1995. The PD system has developed substantially over the years
and presently it serves as an effective conduit for conducting open market operations.
Of the 19 PDs in existence at present, nine PDs are stand-alone non-bank entities.
Lehman Brothers Fixed Income Securities Private Limited (LBFISL), was authorised
to undertake PD business with effect from November 1, 2007. However, following
the filing of a petition under Chapter 11 of the US Bankruptcy code by Lehman
Brothers Holdings Inc., LBFISL was advised by the Reserve Bank not to declare
any interim dividend or remit any amount to its holding company or any other group
company without prior approval. Further, they have been advised not to undertake
transactions in Government securities as a PD in the primary market.
6.7 The Primary Dealer (PD) system continued to play a significant role in the
government securities market during the year 2007-08. Income earned by PDs declined
by 33 per cent during 2007-08, mainly due to restructuring of business by PDs.
Concomitantly however, their expenditure also declined sharply. The net profit
declined by 16 per cent during the year. However, the CRAR of stand-alone PDs
remained above the minimum requirement of 15 per cent. 6.8 The present
chapter is organised into four sections. The regulatory and supervisory initiatives,
business operations and financial performance of financial institutions are set
out in Section 2. Section 3 focuses on the policy developments and the financial
performance of NBFCs. The final section of the Chapter deals with the policy developments
relating to primary dealers and their operations. 2. Financial
Institutions 6.9 A wide range of financial institutions (FIs)
have evolved in the Indian financial sector over the years, with a view to meeting
the medium to long-term funding requirements of the different sectors of the economy.
Based on the major activity undertaken by them, FIs are classified into three
broad categories. First, there exist the term-lending institutions viz.,
EXIM Bank, whose main activity is direct lending by way of term loans and investments.
Second, there are refinance institutions such as National Bank for Agriculture
and Rural Development (NABARD), Small Industries Development Bank of India (SIDBI)
and National Housing Bank (NHB), which mainly extend refinance to banks as well
as NBFIs. In the third category are the investment institutions such as LIC, which
deploy their assets largely in marketable securities. State/regional level institutions
are a distinct group and comprise of various State Financial Corporations (SFCs),
State Industrial and Development Corporations (SIDCs) and North Eastern Development
Finance Corporation Ltd. (NEDFi). Some of these FIs have been notified as Public
Financial Institutions by the Government of India under Section 4A of the Companies
Act, 1956.
6.10 Two FIs, viz., IFCI Ltd. and TFCI
Ltd., were registered as NBFCs with the Reserve Bank. However, they were earlier
exempted from NBFC regulations and as such were being regulated as FIs. The IFCI
Ltd. with effect from August 2007 and the TFCI Ltd. with effect from November
2007 are again being treated as NBFCs and are subject to NBFC regulations.
Among others, Industrial Investment Bank of India (IIBI) is in the process of
voluntary winding up in view of its very poor financial position. As on March
31, 2008, there were four institutions, viz., EXIM Bank, NABARD, NHB
and SIDBI which were under full-fledged regulation and supervision of the Reserve
Bank. Regulatory Initiatives for Financial Institutions
6.11 In continuation with the policy initiatives undertaken by the Reserve Bank
in recent years for progressive upgradation of the regulatory norms for FIs in
convergence with the norms across the financial sector, a number of measures were
undertaken during 2007-08. Exposure of SIDBI to SFCs 6.12
A sizeable portion of exposure of SIDBI is by way of refinance to SFCs. In view
of the poor financial health of SFCs, which is likely to have spillover effect
on the financial health of SIDBI, measures were taken to strengthen the regulatory
focus of SIDBI over SFCs and the risk management guidelines, particularly, with
regard to its exposure to SFCs. The risk weight in respect of SIDBI's exposure
to SFCs was raised from 100 per cent to 125 per cent. SIDBI was instructed to
make full provisions in respect of SFCs that had defaulted even after restructuring/extension
of one-time settlement (OTS) package. SIDBI was also instructed not to sanction
refinance to SFCs that continued to show negative net worth. However, on a review,
based on the information received from the Government of India that four State
Governments had committed to provide funds to the SFCs in their jurisdiction in
a time bound manner to make the net worth of the concerned SFCs positive, it was
decided that SIDBI could provide refinance to those SFCs, as long as the concerned
State Governments kept their commitments. Furthermore, SIDBI was advised to follow
the norms applicable to banks in asset classification and provisioning in respect
of its exposure to SFCs (it involved a change to ';borrower-wise'; classification
from that of ';facility-wise'; classification applicable to FIs). SIDBI
was also advised to ensure that all SFCs follow uniform accounting standards similar
to those followed by banks. Valuation of non-SLR securities issued
by the Government of India 6.13 The Government of India has, from
time to time, issued several special securities which do not qualify for meeting
the SLR requirements of banks. Such Government securities are governed by a separate
set of terms and conditions and entail a higher degree of illiquidity spread.
At present, such special securities comprise of oil bonds, fertiliser bonds, bonds
issued to the erstwhile Unit Trust of India, IFCI Ltd., Food Corporation of India,
Industrial Investment Bank of India Ltd., the erstwhile Industrial Development
Bank of India and the erstwhile Shipping Development Finance Corporation. Currently,
the guidelines issued by Fixed Income Money Market and Derivatives Association
of India (FIMMDA) regarding the valuation of such non-SLR/Debt securities provide
that such securities be valued by applying a mark-up of 50 basis points (bps)
above the corresponding yield on Government of India securities. The issue of
valuation of such special securities was reexamined and in June 2008 FIs were
advised that, for the limited purpose of valuation, all special securities issued
by the Government of India, directly to the beneficiary entities, which do not
carry SLR status, may be valued at a spread of 25 bps above the corresponding
yield on Government of India securities from the financial year 2008–09.
Prudential guidelines on capital adequacy 6.14 The method of calculation
of Tier I capital by financial institutions was reviewed in the light of the international
best practices and FIs were advised that while complying with the capital adequacy
norms, the deferred tax assets (DTA) associated with accumulated losses and the
DTA (excluding DTA associated with accumulated losses), net of deferred tax liabilities
(DTL) should be deducted from Tier I. Where the DTL is in excess of the DTA (excluding
DTA associated with accumulated losses), the excess shall neither be adjusted
against DTA associated with accumulated losses nor added to Tier I capital.
Refinance Facility to SIDBI and NHB 615 With a view to enhancing
credit delivery to the employment intensive micro and small enterprises (MSE)
sector, it was decided on December 6, 2008 to provide refinance of Rs.7,000 crore
to SIDBI. Similar refinance facility of Rs.4,000 crore for NHB is being worked
out. (Refer Chapter II, Box II.2 for details). Operations of Financial
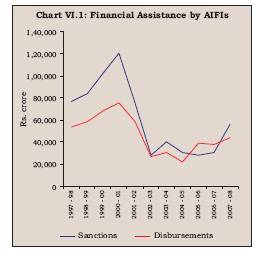
Institutions 6.16 Financial assistance sanctioned by FIs accelerated
sharply during 2007-08 as against the deceleration witnessed during the previous
year. The acceleration in sanctions was accounted for mainly by investment institutions
(especially LIC). Notwithstanding the acceleration in sanctions, the disbursements
slowed down during the year, especially by LIC (Table VI.1 and
Appendix Table VI.1).
Table
VI.1: Financial Assistance Sanctioned and Disbursed by Financial Institutions
| (Amount
in Rs. crore) | Category
| Amount
| Percentage
Variation | 2006-07 | 2007-08
| 2007-08 |
S | D | S
| D | S | D |
1
| 2 | 3 | 4
| 5 | 6 | 7 |
(i) | All-India
Term-lending Institutions* | 11,102 | 10,225 | 16,181 | 15,098 | 45.7 | 47.6 |
(ii) | Specialised
Financial Institutions# | .. | .. | .. | .. | .. | .. |
(iii) | Investment
Institutions@ | 18,862 | 27,757 | 39,617 | 28,414 | 110.0 | 2.4 |
Total Assistance by FIs (i+ii+iii)
| 29,964 | 37,982 | 55,798 | 43,512 | 86.2 | 14.6 |
S : Sanctions. D : Disbursements.*
: Relating to SIDBI and IIBI. # : Relating to IVCF and ICICI Venture.
@ :
Relating to LIC and GIC & erstwhile subsidiaries (NIA,UIIC & OIC).
.. : Not available.
Note : All data are provisional.
Data for 2006-07
has been recalculated to exclude IFCI Ltd. and TFCI Ltd. as they are being regulated
as
NBFCs as on March 31, 2008.
Source: Respective Financial Institutions.
| 6.17 On balance
thus, even though, both financial assistance sanctioned and disbursed by FIs increased
during 2007-08, the increase was more pronounced in respect of sanctions (86.2
per cent) than the disbursements (14.6 per cent) (Chart VI.1).
 Assets
and Liabilities of FIs 6.18 The
combined balance sheets of select FIs (NABARD, NHB, SIDBI and EXIM Bank) during
2007-08 expanded sharply by 19.5 per cent. On the liabilities side, the resources
raised by way of bonds and debentures (which form a major constituent with a share
of 32.5 per cent in the total liabilities) declined by 3.5 per cent during 2007-08.
However, deposits and borrowings recorded a sharp increase of 54.1 per cent and
56.7 per cent, respectively. On the assets side, loans and advances continued
to expand, while the investment portfolio continued to decline (9.3 per cent).
Cash and bank balances as well as other assets, registered a sharp turnaround
during the year (Table VI.2).
Table
VI.2: Liabilities and Assets of Financial Institutions
(As at end-March) |
(Amount
in Rs. crore) | Item | Amount
| Percentage
Variation | 2007 | 2008 | 2007-08 |
1 | 2 | 3 | 4 |
Liabilities
| |
| | 1. | Capital | 3,899.99 | 3,999.99 | 2.6 |
|
| (2.6) | (2.3) |
| 2. | Reserves | 15,852.37 | 17,137.23 | 8.1 |
|
| (10.7) | (9.6) |
| 3. | Bonds
and | |
| |
| Debentures | 59,860.85 | 57,741.16 | -3.5 |
|
| (40.2) | (32.5) |
| 4. | Deposits | 21,997.58 | 33,907.70 | 54.1 |
|
| (14.8) | (19.1) |
| 5. | Borrowings | 21,510.72 | 33,716.10 | 56.7 |
|
| (14.5) | (19.0) |
| 6. | Other
Liabilities | 25,665.40 | 31,262.82 | 21.8 |
|
| (17.3) | (17.6) |
| Total
Liabilities /Assets | 1,48,786.91 | 1,77,765.00 | 19.5 |
|
| (100.0) | (100.0) |
| Assets
| |
| |
1. | Cash
and Bank | |
| |
| Balance | 8,831.85 | 13,796.47 | 56.2 |
|
| (5.9) | (7.8) |
| 2. | Investments | 7,035.25 | 6383.30 | -9.3 |
|
| (4.7) | (3.6) |
| 3. | Loans
and Advances | 1,25,194.91 | 1,47,008.43 | 17.4 |
|
| (84.1) | (82.7) |
| 4. | Bills
Discounted/ | |
| |
| Rediscounted | 1,916.41 | 2,043.82 | 6.7 |
|
| (1.3) | (1.2) |
| 5. | Fixed
Assets | 529.64 | 539.51 | 1.9 |
|
| (0.4) | (0.3) |
| 6. | Other
Assets | 5,278.85 | 7,993.47 | 51.4 |
|
| (3.6) | (4.5) |
| Notes
:
1. Data pertain to four FIs, viz., NABARD, NHB, SIDBI
and EXIM Bank. IIBI Ltd.
was under voluntary winding up as on March
31, 2008. Data for 2007 has been
recalculated to exclude IFCI Ltd.
and
TFCI Ltd. as they are being regulated as NBFCs as onMarch 31, 2008.
2. Figures
in parentheses are percentages to total
liabilities/assets.
Source
:
Balance sheets of respective FIs.
Unaudited Off-site returns
for NHB. | Resources Mobilised by FIs 6.19
Resources raised by FIs during 2007-08 were considerably higher than those during
the previous year. While the long-term resources raised witnessed a sharp
rise during 2007-08 as compared with that a year ago, the short-term resources
raised declined. Resources raised in foreign currency increased significantly.
EXIM Bank mobilised the largest amount of resources, followed by NABARD and NHB
(Table VI.3 and Appendix Table VI.2).
Table
VI.3: Resources Mobilised by Financial Institutions |
(Amount
in Rs. crore) | Institutions | Total
Resources Raised | Long-Term | Short-Term | Foreign
Currency | Total | Total
Outstanding
(As at end-March) |
| 2006-07 | 2007-08 | 2006-07 | 2007-08 | 2006-07 | 2007-08 | 2006-07 | 2007-08 | 2007 | 2008 |
1 | 2 | 3 | 4 | 5 | 6 | 7 | 8 | 9 | 10 | 11 |
EXIM Bank | 3,212 | 6,825 | 3,249 | 2,180 | 4,159 | 5,553 | 10,620 | 14,558 | 21,662 | 29,326 |
NABARD | 10,899 | 12,198 | - | 1,422 | - | - | 10,899 | 13,620 | 31,260 | 32,630 |
NHB | 4,781 | 3,100 | 3,079 | 2,421 | - | - | 7,860 | 5,521 | 19,003 | 17,313 |
SIDBI | 572 | 4,531 | 1,,274 | 461 | 331 | 92 | 2,176 | 5,084 | 10,928 | 14,665 |
Total | 19,464 | 26,654 | 7,602 | 6,484 | 4,490 | 5,645 | 31,555 | 38,783 | 82,853 | 93,934 |
- : Nil/Negligible
Notes :
Long-term rupee resources comprise of borrowings
by way of bonds/debentures;
and short-term resources comprise of CPs, term
deposits, ICDs, CDs and borrowing from the term money.
Foreign currency resources
comprise of largely bonds and borrowings in the international market.
Source
: Respective FIs. | 6.20 Resources raised by FIs
from the money market during 2007-08 were higher than those raised during 2006-07.
FIs, utilised 22.9 per cent of the umbrella limit sanctioned to them; the utilisation
was 17.3 per cent during the previous year (Table VI.4).
Table
VI.4: Resources Raised by Financial | Institutions
from the Money Market | (Amount
in Rs. crore) | Instruments | 2005-06 | 2006-07 | 2007-08 |
1 | 2 | 3 | 4 |
A. | Total | 1,977 | 3,293 | 4,458 |
| i) | Term
Deposits | 44 | 89 | 508 |
| ii) | Term
Money | - | - | 250 |
| iii) | Inter-corporate
Deposits | - | - | - |
| iv) | Certificates
of Deposit | 2 | 663 | 2,286 |
| v) | Commercial
Paper | 1,931 | 2,540 | 1,414 |
Memo: |
| |
| |
B. | Umbrella
Limit | 15,157 | 19,001 | 19,500 |
C. | Utilisation
of Umbrella limit |
| |
| | (A
as percentage of B) | 13.1 | 17.3 | 22.9 |
- : Nil/Negligible.
Note
: Figures may not add up due to rounding off.
Source
: Fortnightly return of resource mobilised by FIs. |
Sources and Uses of Funds
6.21 Total sources/deployment
of funds of FIs increased sharply by 32.2 per cent to Rs.2,13,954 crore during
2007-08. In continuation of the pattern witnessed last year, major part of the
funds of FIs were raised externally (51.7 per cent) followed by internal sources
(47.2 per cent). ‘Other sources’ formed only a marginal part of funds
of FIs. A large part of the funds raised were used for fresh deployments (58.7
per cent) during 2007-08. The repayment of past borrowing, which constituted 32.3
per cent of the total deployment of funds, also registered a sharp rise. Other
deployments, including interest payments, too increased sharply during the year
(Table VI.5 and Appendix Table VI.3).
Table
VI.5: Pattern of Sources and Deployment
of Funds of Financial
Institutions* | (Amount
in Rs. crore) | Item | 2006-07 | 2007-08 | Percentage
Variation | 2007-08 |
1 | 2 | 3 | 4 |
A) | Sources
of Funds | |
| |
| (i+ii+iii) | 1,61,803 | 2,13,954 | 32.2 |
|
| | (100.0) | (100.0) |
| | (i) | Internal | 67,646 | 1,00,944 | 49.2 |
|
| | (41.8) | (47.2) |
| | (ii) | External | 86,860 | 1,10,604 | 27.3 |
|
| | (53.7) | (51.7) |
| | (iii) | Others@ | 7,295 | 2,406 | -67.0 |
|
| | (4.5) | (1.1) |
| B) | Deployment
of Funds | |
| |
| (i+ii+iii) | 1,61,803 | 2,13,954 | 32.2 |
|
| | (100.0) | (100.0) |
| | (i) | Fresh
Deployments | 95,221 | 1,25,522 | 31.8 |
|
| | (58.8) | (58.7) |
| | (ii) | Repayment
of past | 55,482 | 69,096 | 24.5 |
|
| Borrowings | (34.3) | (32.3) |
| | (iii) | Other
Deployments | 11,101 | 19,333 | 74.2 |
|
| | (6.9) | (9.0) |
| |
| of which : |
| |
| |
| Interest Payments | 4,801 | 6,916 | 44.1 |
|
| | (3.0) | (3.2) |
| * : Data pertain
to EXIM Bank, NABARD, NHB and SIDBI.
@ : Includes cash and balances with banks,
balances with the Reserve Bank and other banks.
Note : Figures
in parentheses are percentages to the totals.
Source: Respective
FIs. | Cost and Maturity of Borrowings
6.22 The weighted average cost of rupee resources raised by financial institutions
increased substantially during 2007-08, reflecting the general hardening of interest
rates in the domestic market (Table VI.6 and Appendix
Table VI.4). The weighted average maturity of long-term resources raised by
other all-India financial institutions, barring NHB, decreased.
| Table
VI.6: Weighted Average Cost and Maturity
of Rupee Resources
Raised by Select
Financial Instituions |
Institutions | Weighted
Average Cost (per cent) | Weighted
Average Maturity (years) |
| 2006-07 | 2007-08 | 2006-07 | 2007-08 |
1 | 2 | 3 | 4 | 5 |
EXIM Bank | 7.8 | 8.2 | 3.7 | 3.0 |
SIDBI | 6.9 | 8.2 | 6.5 | 1.0 |
NABARD | 8.7 | 9.5 | 5.0 | 4.0 |
NHB | 7.4 | 7.7 | 2.4 | 2.8 |
- : Nil/Negligible.
Note
: Data are provisional.
Source : Respective FIs. | Lending
Interest Rates
6.23 While NHB and SIDBI maintained their Prime Lending
Rates (PLR), EXIM Bank raised its PLR during the year (Table VI.7).
| Table
VI.7: Long-term PLR Structure of Select | Financial
Institutions | (Per
cent) | Effective | NHB | EXIM
Bank | SIDBI |
1 | 2 | 3 | 4 |
March 2007 | 10.5 | 12.5 | 12.0 |
March 2008 | 10.5 | 13.5 | 12.0 |
Source : Respective
FIs. | Financial Performance of Financial Institutions
6.24 Net interest income of FIs increased by 19.7 per cent
to Rs.2,642 crore during 2007-08 from Rs.2,208 crore during 2006-07. In line with
the trend in the previous years, non-interest income of FIs increased significantly
by 71.8 per cent during the year. However, in contrast with the decline in the
previous year, the operating expenses of FIs registered a sharp rise of 46.6 per
cent during the year, even though the wage bill declined substantially by 32.7
per cent. The operating profit recorded an increase of 30.1 per cent during the
year. The net profit of FIs also increased, even though provision for taxation
declined (Table VI.8).
Table
VI.8: Financial Performance of Financial Institutions* |
(Amount
in Rs. crore) | Item | 2006-07 | 2007-08 | Variation
2007-08 | Amount | Percentage |
1 | 2 | 3 | 4 | 5 |
A) | Income
(a+b) | 9,073 | 11,541 | 2,467 | 27.2 |
| a)
Interest Income | 8,138 | 9,934 | 1,796 | 22.1 |
|
| (89.7) | (86.1) |
| |
| b)
Non-Interest Income | 935 | 1607 | 671 | 71.8 |
|
| (10.3) | (13.9) |
| |
B) | Expenditure
(a+b) | 6,895 | 8,707 | 1,812 | 26.3 |
| a)
Interest Expenditure | 5,930 | 7,292 | 1,362 | 23.0 |
|
| (86.0) | (83.8) |
| |
| b)
Operating Expenses | 965 | 1414 | 450 | 46.6 |
|
| (14.0) | (16.2) |
| |
| of
which : Wage Bill | 425 | 286 | -139 | -32.7 |
C) | Provisions
for Taxation | 632 | 936 | 304 | 48.1 |
D) | Profit |
| |
| |
| Operating
Profit (PBT) | 2,178 | 2,834 | 656 | 30.1 |
| Net
Profit (PAT) | 1,546 | 1,898 | 352 | 22.7 |
E) | Financial
Ratios@ | |
| |
| | Operating
Profit (PBT) | 1.5 | 1.6 |
| |
| Net
Profit (PAT) | 1.0 | 1.0 |
| |
| Income | 6.0 | 6.5 |
| |
| Interest
Income | 5.5 | 5.6 |
| |
| Other
Income | 0.6 | 0.9 |
| |
| Expenditure | 4.6 | 4.9 |
| |
| Interest
expenditure | 4.0 | 4.1 |
| |
| Other
Operating Expenses | 0.6 | 0.8 |
| |
| Wage
Bill | 0.3 | 0.2 |
| |
| Provisions | 0.4 | 0.5 |
| |
| Spread
(Net Interest Income) | 1.5 | 1.5 |
| |
* :Data pertain to four FIs, viz.,
NABARD, NHB, SIDBI and EXIM Bank. IIBI Ltd. was under voluntary winding up as
on March 31,
2008. Data for 2007 has been recalculated to exclude IFCI Ltd.
and TFCI Ltd. as they are being
regulated as NBFCs as on March 31, 2008.
@ :
As percentage of total assets.
Note :Figures in parentheses
are percentage shares to the respective total.
Source :Annual
Accounts of respective FIs, unaudited off-site returns for NHB. |
6.25 Interest income as a percentage of working funds declined for
NABARD, while it increased for other FIs. The non-interest income as a percentage
of working funds increased for all the FIs. Operating profit as a percentage of
working funds improved for all FIs except SIDBI. Return on average assets declined
for all the FIs, except NHB. The return on average assets was highest for SIDBI
followed by NABARD, EXIM Bank and NHB. Net profit per employee was more than Rs.1
crore in case of EXIM Bank during 2007-08 (Table VI.9).
| Table
VI.9: Select Financial Parameters of Financial Institutions
| (As
at end-March) | (Per
cent) | Institutions | Interest
Income/
Average
Working Fund | Non-Interest
Income/Average
Working Fund | Operating
Profit/Average
Working Fund | Return
on
Average
Assets | Net
Profit
per employee
(Rs. crore) |
2007 | 2008 | 2007 | 2008 | 2007 | 2008 | 2007 | 2008 | 2007 | 2008 |
1 | 2 | 3 | 4 | 5 | 6 | 7 | 8 | 9 | 10 | 11 |
EXIM Bank | 8.1 | 8.2 | 0.5 | 1.3 | 1.7 | 2.5 | 1.3 | 1.1 | 1.4 | 1.5 |
NABARD | 6.8 | 6.1 | -0.2 | 0.1 | 1.8 | 2.0 | 1.6 | 1.4 | 0.2 | 0.3 |
NHB* | 6.8 | 7.3 | 0.1 | 0.3 | 0.9 | 1.0 | 0.5 | 0.6 | .. | .. |
SIDBI | 7.1 | 8.5 | 0.4 | 0.7 | 3.8 | 3.1 | 2.2 | 1.6 | 0.4 | 0.2 |
.. : Not Available. * : Position
as at end-June.
Source : Balance sheet of respective FIs,
unaudited off-site returns for NHB. | Soundness
Indicators Asset Quality 6.26 In absolute terms,
net NPAs of EXIM Bank and NABARD declined during 2007-08, while that of SIDBI
increased sharply (Table VI.10). In terms of net NPA to net
loans ratio, the asset quality of EXIM Bank improved sharply, while that of NABARD
improved marginally. Although the net NPAs to net loans ratio increased in respect
of SIDBI at end-March 2008 as compared with end-March 2007, the ratio was quite
low otherwise. Significantly, in continuation of the trend witnessed during last
few years, NHB did not have any NPAs.
Table
VI.10: Net Non-Performing Assets ofFinancial Institutions |
(As at
end-March) | (Amount
in Rs. crore) | Institutions | Net
NPAs | Net
NPAs/Net Loans
(per cent) |
| 2007 | 2008 | 2007 | 2008 |
1 | 2 | 3 | 4 | 5 |
EXIM Bank | 115 | 83 | 0.50 | 0.29 |
NABARD | 23 | 19 | 0.03 | 0.02 |
NHB* | - | - | - | - |
SIDBI | 22 | 49 | 0.15 | 0.25 |
- : Nil/Negligible. * : Position
as at end-June.
Source: Annual Accounts of respective FIs,
unaudited off-site returns for NHB. | 6.27 Reflecting the
improvement in asset quality, NPAs in the sub-standard and doubtful category of
all FIs constituted a very small share. Also none of the FIs had any assets in
the ‘loss’ category (Table VI.11).
| Table
VI.11: Asset Classification of Financial Institutions
| (Amount
in Rs. crore) | Institutions | At
end-March | Standard | Sub-Standard |
| Doubtful |
| Loss |
2007 | 2008 | 2007 | 2008 | 2007 | 2008 | 2007 | 2008 |
1 | 2 | 3 | 4 | 5 | 6 | 7 | 8 | 9 |
EXIM Bank | 22,772 | 28,728 | 108 | 41 | 7 | 42 | - | - |
| (99.5) | (99.7) | (0.5) | (0.1) | (0.03) | (0.1) |
| |
NABARD | 69,485 | 82,853 | 18 | 2 | 5 | 17 | - | - |
| (99.96) | (99.96) | (0.03) | (0.002) | (0.01) | (0.02) |
| |
NHB* | 18,917 | 18,917 | - | - | - | - | - | - |
| (100.0) | (100.0) |
| |
| |
| |
SIDBI | 15,123 | 19,927 | 17 | 24 | 5 | 25 | - | - |
| (99.87) | (99.80) | (0.1) | (0.1) | (0.03) | (0.1) |
| |
All FIs | 1,26,297 | 1,50,425 | 143 | 67 | 17 | 84 | - | - |
- : Nil/Negligible. * : Position
as at end-June.
Note :
Figures in parentheses represent
percentage share in the respective totals of each institution.
Figures may
not add up due to rounding off.
Source :
Annual Accounts
of respective FIs, unaudited off-site returns for NHB. | Capital
Adequacy 6.28 The capital adequacy ratio of all
the FIs continued to be significantly higher than the minimum stipulated norm
of 9 per cent (Table VI.12). The CRAR of SIDBI increased significantly
to 41.8 per cent at end-March 2008 as compared with 37.5 per cent at end-March
2007. The CRAR of NHB also improved marginally, while that of EXIM Bank and NABARD
declined marginally during the year.
| Table
VI.12: Capital Adequacy Ratio of Select Financial Institutions*
| (Per
cent) | Institutions | As
at end-March |
| 2001 | 2002 | 2003 | 2004 | 2005 | 2006 | 2007 | 2008 |
1 | 2 | 3 | 4 | 5 | 6 | 7 | 8 | 9 |
EXIM Bank | 23.8 | 33.1 | 26.9 | 23.5 | 21.6 | 18.4 | 16.4 | 15.1 |
NABARD | 38.5 | 36.9 | 39.1 | 39.4 | 38.8 | 34.4 | 27.0 | 26.6 |
NHB@ | 16.8 | 22.1 | 27.9 | 30.5 | 22.5 | 22.3 | 21.7 | 24.7 |
SIDBI | 28.1 | 45.0 | 44.0 | 51.6 | 50.7 | 43.2 | 37.5 | 41.8 |
* : Net of provisioning and
write offs.
@ : Position as at end-June.
Source : Annual
Accounts of respective FIs, unaudited off-site returns for NHB. |
3.Non-Banking Financial Companies
6.29 The non-banking financial companies (NBFCs) flourished in India in the decade
of the 1980s against the backdrop of a highly regulated banking sector. While
the simplified sanction procedures and low entry barriers encouraged the entry
of a host of NBFCs, factors like flexibility, timeliness in meeting credit needs
and low operating cost provided the NBFCs with an edge over the banking sector.
The flourishing NBFC sector, however, also raised some regulatory concerns. An
amendment to the Reserve Bank of India Act, 1934 was, therefore, carried out in
1997, which authorised the Reserve Bank to determine policies, and issue directions
to NBFCs regarding income recognition, accounting standards, NPAs, capital adequacy,
etc. The amended Act, inter alia, provided for compulsory registration
of all NBFCs into three broad categories, viz., (i) NBFCs accepting public
deposit; (ii) NBFCs not accepting/holding public deposit; and (iii) core investment
companies (i.e., those acquiring shares/securities of their group/ holding/subsidiary
companies to the extent of not less than 90 per cent of total assets and which
do not accept public deposit).
6.30 This section begins with an account
of the regulatory and supervisory initiatives for the NBFC sector undertaken by
the Reserve Bank during the year, followed by an analysis of the operations of
NBFCs and RNBCs which are dealt with separately in view of their diverse nature.
Considering the evolving regulatory initiatives for NBFCs not accepting public
deposits but having asset size of Rs.100 crore and above (NBFCs-ND-SI) and considering
the systemic implications of their operations, a separate section has been devoted
for an analysis of their operations. Regulatory and Supervisory
Initiatives 6.31 Until some years back, the prudential
norms applicable to banking and non-banking financial companies were not uniform.
Moreover, within the NBFC group, the prudential norms applicable to deposit taking
NBFCs (NBFCs-D) were more stringent than those for non-deposit taking NBFCs (NBFCs-ND).
Since the NBFCs-ND were not subjected to any exposure norms, they could take large
exposures. The absence of capital adequacy requirements resulted in high leverage
by the NBFCs. Since 2000 however, the Reserve Bank has initiated measures to reduce
the scope of ‘regulatory arbitrage’ between banks, NBFCs-D and NBFCs-ND
(Box VI.1). 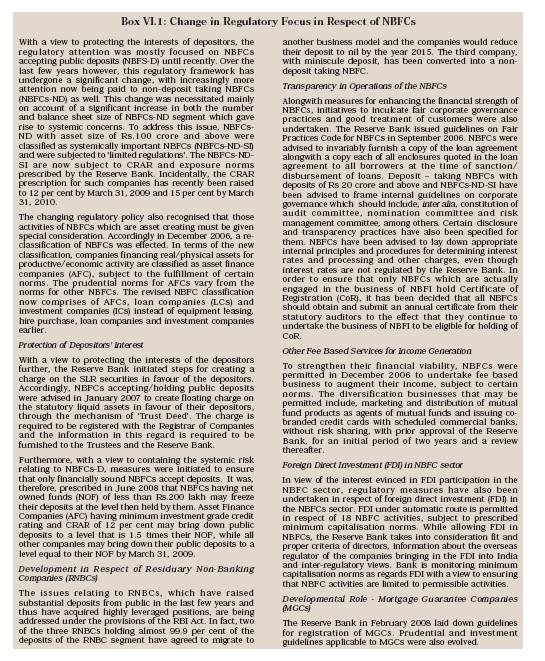
Advertisement in Electronic Media
6.32 On April 4, 2007, NBFCs were advised that it is possible that the advertisement
released by NBFCs accepting deposits purely for promoting their business may attract
deposits. Therefore, in order to ensure transparency in the interest of depositors
in the context of such advertisements, a provision was incorporated in the Non-Banking
Financial Companies Acceptance of Public Deposits (Reserve Bank) Directions, 1998,
in terms of which companies are required to state that they have a valid Certificate
of Registration issued by the Reserve Bank. However, the Reserve Bank does not
accept any responsibility or guarantee about the present position as to the financial
soundness of the company or for the correctness of any of the statements or representations
made or opinions expressed by the company and for repayment of deposits/discharge
of the liabilities by the company. Amendments to NBFC
Regulations - Ceiling on Rate of Interest 6.33 The
maximum interest rate payable on public deposits by NBFCs was revised to 12.5
per cent per annum on and from April 24, 2007. It was also clarified that this
was the maximum permissible rate an NBFC can pay on its public deposits and they
may offer lower rates. The new rate of interest would be applicable to fresh public
deposits and renewals of matured public deposits. The ceiling rate of interest
of 12.5 per cent per annum was also applicable to the deposits accepted/renewed
by miscellaneous non-banking companies (chit fund companies).
Unsolicited Commercial Communications-National Do Not Call Registry
6.34 With a view to protecting the right to privacy of the members of public and
to curb the complaints relating to unsolicited commercial communications being
received by customers/non-customers, the Telecom Regulatory Authority of India
(TRAI) framed the Telecom Unsolicited Commercial Communications (UCC) Regulations
for curbing UCC. Further, the Department of Telecommunications (DoT) has issued
relevant guidelines for telemarketers alongwith the registration procedure on
June 6, 2007. The Reserve Bank announced on November 26, 2007 that the instructions
would be equally applicable to NBFCs and accordingly they have been advised: (i)
not to engage telemarketers who do not have any valid registration certificate
from DoT, Government of India, as telemarketers; (ii) to furnish the list of telemarketers
engaged by them alongwith the registered telephone numbers being used by them
for making telemarketing calls to TRAI; and (iii) to ensure that all
agents presently engaged by them register themselves with DoT as telemarketers. FIMMDA
Reporting Platform for Corporate Bond Transactions 6.35 SEBI has permitted
FIMMDA to set up its reporting platform for corporate bonds. It has also been
mandated to aggregate the trades reported on its platform as well as those reported
on BSE and NSE with appropriate value addition. The FIMMDA platform has gone live
with effect from September 1, 2007. All NBFCs were required to report their secondary
market transactions in corporate bonds in the OTC market on FIMMDA’s reporting
platform with effect from September 1, 2007. Detailed operational guidelines in
this regard were issued separately by FIMMDA. Monitoring of Frauds
in NBFCs 6.36 In March 2008 all deposit taking NBFCs (including RNBCs)
were advised that the extant instructions with regard to monitoring of frauds
were revised and as such cases of ‘negligence and cash shortages’
and ‘irregularities in foreign exchange transactions’ were to be reported
as fraud if the intention to cheat/defraud was suspected/proved. However, in cases
where fraudulent intention was not suspected/ proved at the time of detection
but involve cash shortages of more than ten thousand rupees and cases where
cash shortages more than five thousand rupees were detected by management/auditor/inspecting
officer and not reported on the occurrence by the persons handling cash, then
such cases may also be treated as fraud and reported accordingly. Guidelines
on Registration, Operations, Prudential Norms and Investment Directions for Mortgage
Guarantee Companies 6.37 Mortgage Guarantee Companies were notified
as NBFCs by the Reserve Bank with the prior approval of the Central Government
on January 15, 2008 in exercise of the powers conferred under Section 45 I (f)(iii)
of the Reserve Bank of India Act, 1934. The guidelines on registration, operations,
prudential norms and investment directions applicable to these companies were
placed on the Reserve Bank's website on February 15, 2008. According to these
guidelines, a mortgage guarantee company was required to: (i) obtain a certificate
of registration from the Reserve Bank before commencing business of mortgage guarantee;
(ii) have a minimum net owned fund of Rs.100 crore at the time of commencement
of business; (iii) have a diversified share holding; (iv) maintain minimum capital
adequacy ratio of 10 per cent of which at least 6 per cent was to be Tier
I capital; (v) not accept public deposits, not avail external commercial borrowings
and adhere to prescribed prudential norms; (vi) create and maintain a contingency
reserve by transfer of 40 per cent of the premium or fee earned or 25 per cent
of the profit after provision or tax, whichever is higher; (vii) make good the
guarantee liability without demur on the happening of trigger event1. Moreover,
these companies were directed not to provide mortgage guarantee for a housing
loan with 90 per cent and above loan to value (LTV) ratio. 6.38 Major features
of the prudential norms for the mortgage guarantee companies are: (i) an asset
acquired from creditor institution on the happening of the trigger event shall
straightway be classified as non-performing asset; (ii) income on an asset taken
over from creditor is required to be recognised only on a cash basis, other income
would be recognised in accordance with directions applicable to non-deposit taking
NBFCs; and (iii) the premium or fee on the mortgage guarantee contracts should
be treated as income in the profit and loss account in accordance with the accounting
standards issued by the Institute of Chartered Accountants of India. 6.39
The investment directions for mortgage guarantee companies are: (i) the company
should frame a policy in line with the investment directions issued by the Reserve
Bank; (ii) the company should invest only in government securities, securities
of corporate bodies/public sector undertakings guaranteed by Government, fixed
deposit/ certificates of deposit/bonds of scheduled commercial banks/PFIs; listed
and rated debentures/bonds of corporates; fully debt oriented mutual fund units;
unquoted Government securities and Government guaranteed bonds; (iii) the company
should hold not less than 25 per cent of the total investment portfolio in Central/State
Government securities and the remaining investments with a ceiling of 25 per cent
in any one of the above categories; and (iv) all investment should be marked to
market. NDS-OM: Extension of Indirect Access to Other Entities
6.40 When the Order Matching segment on the Negotiated Dealing System (NDS-OM)
for trading in Government securities was launched in August 2005, direct access
was granted only to banks and PDs. Subsequently, the access was extended to other
NDS members such as insurance companies, mutual funds and large provident funds.
To widen the reach of the NDS-OM, in May 2007, indirect access through the constituents’
subsidiary general ledger (CSGL) route was extended to certain qualified entities,
viz., deposit-taking NBFCs, provident funds, pension funds, mutual funds,
insurance companies, co-operative banks, RRBs and the trusts maintaining gilt
accounts with NDS members. The indirect access was extended to the systemically
important non-deposit taking NBFCs in November 2007. These entities could place
orders on the NDS-OM through its direct members, i.e., banks and PDs,
using the CSGL route. Such trades get settled through the CSGL account and current
account of the NDS-OM members. In May 2008, following the announcement made in
the Annual Policy Statement for 2008-09, this indirect access was extended to
other segments of investors such as other non-deposit taking NBFCs, corporates
and FIIs. Guidelines for Securitisation Companies (SCs) and Reconstruction
Companies (RCs) 6.41 The SCs and RCs are special purpose
vehicles established under the SARFAESI Act to securitise and reconstruct financial
assets. The Reserve Bank evolved guidelines on various regulatory and supervisory
issues relating to SCs and RCs (Box VI.2). 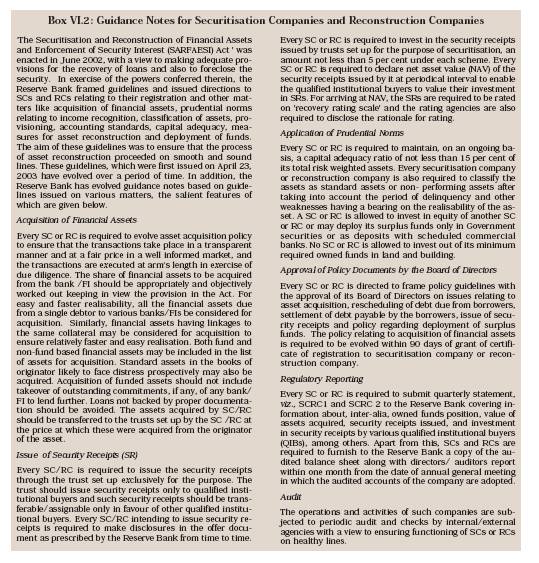
Treatment
of Deferred Tax Assets (DTA) and Deferred Tax Liabilities (DTL) for Computation
of Capital 6.42 As creation of deferred tax assets
(DTA) or DTL gives rise to certain issues impacting the balance sheet of the company,
NBFCs were advised on July 31, 2008 regarding the regulatory treatment to be given
to these issues. As per these guidelines, the balance in DTL account will not
be eligible for inclusion in Tier I or Tier II capital for capital adequacy purpose
as it is not an eligible item of capital. DTA will be treated as an intangible
asset and should be deducted from Tier I capital. NBFCs were advised to ensure
compliance with these guidelines from the accounting year ending March 31, 2009.
Prevention of Money Laundering Act, 2002 –Obligation of NBFCs
6.43 It was reiterated in August 2008 that NBFCs, as a part of transaction monitoring
mechanism, are required to put in place an appropriate software application to
throw alerts when the transactions are inconsistent with risk categorisation and
updated profile of customers. In the case of NBFCs, where all the branches are
not yet fully computerised, the Principal Officer of the NBFC should cull out
the transaction details from branches which are not computerised and suitably
arrange to feed the data into an electronic file with the help of the editable
electronic utilities of cash transaction report (CTR) and suspicious transaction
reports (STR) as have been made available by Financial Intelligence Unit-India
(FIU-IND) on their website. It was further clarified that cash transaction
reporting by branches/offices of NBFCs to their Principal Officer should invariably
be submitted on a monthly basis and the Principal Officer, in turn, should ensure
to submit CTR for every month to FIU-IND within the prescribed time schedule. Facility
of Liquidity Support for NBFCs 6.44 On October 15, 2008 the Reserve
Bank announced, purely as a temporary measure, that banks may avail of additional
liquidity support exclusively for the purpose of meeting the liquidity requirements
of mutual funds (MFs) to the extent of up to 0.5 per cent of their NDTL. Further,
it was decided, on a purely temporary and ad hoc basis, subject to review,
to extend this facility and allow banks to avail liquidity support under the LAF
through relaxation in the maintenance of SLR to the extent of up to 1.5 per cent
of their NDTL. This relaxation in SLR is to be used exclusively for the purpose
of meeting the funding requirements of NBFCs and MFs. Banks can apportion the
total accommodation allowed above between MFs and NBFCs flexibly as per their
business needs. Policy Initiatives for NBFCs-ND-SI
6.45 The number, product variety and size of NBFCs-ND-SI have witnessed substantial
growth in recent years and as a result the operations of these companies have
increasingly assumed systemic implications. As a response to these developments,
the 'minimal regulatory regime' that existed for these companies has been transformed
into 'limited regulatory regime' by the Reserve Bank. In line with the growing
focus on NBFCs-ND-SI in recent years, certain important policy initiatives were
undertaken in 2007-08. Guidelines on Capital Adequacy, Liquidity and
Disclosure Norms for NBFC-ND-SI 6.46 The Reserve Bank reviewed the
guidelines relating to NBFCs-ND-SI. In terms of the final guidelines, placed
on the Reserve Bank's website on August 1, 2008, the minimum capital to risk-weighted
assets ratio (CRAR) for each NBFC-ND-SI was raised from the existing 10
per cent to 12 per cent to be reached by March 31, 2009 and further to 15
per cent by March 31, 2010. The NBFCs-ND-SI are required to make additional disclosures
relating to CRAR, exposure to the real estate sector and maturity pattern of assets
and liabilities in their balance sheet from the year ending March 31, 2009. In
view of the possibility of leveraged investments, and asset-liability mismatches
resulting from use of short-term sources to fund NBFC activities, a system of
reporting for NBFCs-ND-SI was introduced with effect from the period ended September
30, 2008. However, to enable the NBFCs to fine tune the system, the first return
for the period ended September 2008 is required to be submitted by the first week
of January 2009. Issuance of Perpetual Debt Instruments
6.47 Taking into consideration the need for enhanced funds for increasing business
and meeting regulatory requirements, NBFCs-ND-SI were permitted to augment their
capital funds by issue of Perpetual Debt Instruments (PDI). PDIs may be issued
in Indian rupees only and the aggregate amount to be raised by issue of such instruments
has to be within the overall limits of Tier I and Tier II. The aggregate amount
is allowed to be raised in tranches. However, the minimum investment by a single
investor in each such issue/tranche has to be Rs 5 lakh. The PDI is eligible to
be treated as Tier I capital up to 15 per cent of total Tier I capital as on March
31 of the previous year. The amount of PDI in excess of amount admissible as Tier
I can qualify as Tier II capital, subject to certain conditions. The interest
payable to the investors on PDI may be either at a fixed rate or at a floating
rate referenced to a market determined rupee interest benchmark rate. NBFCs-ND-SI
can issue PDI as plain vanilla instruments only. However, NBFCs-ND-SI may issue
PDI with a 'call option'. Access to Short-Term Foreign
Currency Borrowings 6.48 As a temporary measure, NBFCs-ND-SI were
permitted to raise short- term foreign currency borrowings under the approval
route, subject to certain conditions like eligibility of borrowers and lenders,
end-use of funds, maturity, etc. The maximum amount should not exceed
50 per cent of the net owned funds (NOF) or USD 10 million (or its equivalent),
whichever is higher. The all-in-cost ceiling has been fixed at not exceeding 6
months Libor + 200 bps. The borrowings should be fully swapped into rupees for
the entire maturity. Profile of NBFCs (including RNBCs)
6.49 Total number of NBFCs registered with the Reserve Bank, consisting of NBFCs-D
(deposit-taking NBFCs), RNBCs, mutual benefit companies (MBCs), miscellaneous
non-banking companies (MNBCs) and Nidhi companies, declined from 12,968 at end-June
2007 to 12,809 at end-June 2008 (Table VI.13). The number of
NBFCs-D declined from 401 at end-June 2007 to 364 at end-June 2008, mainly due
to the exit of many NBFCs from deposit taking activity. The number of RNBCs
declined to two at end-March 2008.
| Table
VI.13: Number of NBFCs Registered with the Reserve Bank |
End-June | Number
of
Registered NBFCs | NBFCs-D |
1 | 2 | 3 |
1999 | 7,855 | 624 |
2000 | 8,451 | 679 |
2001 | 13,815 | 776 |
2002 | 14,077 | 784 |
2003 | 13,849 | 710 |
2004 | 13,764 | 604 |
2005 | 13,261 | 507 |
2006 | 13,014 | 428 |
2007 | 12,968 | 401 |
2008 | 12,809 | 364 |
6.50 Of the 364 deposit-taking NBFCs, 335 NBFCs filed annual return
for the year ended March 2008 by the cut-off date of September 30, 2008.
Even though the public deposits declined by Rs.304 crore in 2007-08 over the previous
year, partly reflecting the decline in number of reporting NBFCs, total assets
increased significantly by Rs.23,019 crore (32.1 per cent), while net owned funds
increased by Rs.3,974 crore (48.0 per cent) during the same period (Table
VI.14). The rise in total assets and net owned funds reflected partly
the restoration of IFCI Ltd. and TFCI Ltd. to the NBFC category. The share of
public deposits held by RNBCs in the total deposits of all NBFCs remained constant
at 91.6 per cent in 2007-08 as compared with 2006-07. However, the share of RNBCs
in total assets of NBFCs declined to 25.8 per cent at end-March 2008 from 32.3
per cent at end-March 2007.
Table
VI.14: Profile of NBFCs* | (Amount
in Rs.crore) | Item | As
at End-March | 2007 | 2008
P | NBFCs | of
which: RNBCs | NBFCs | of
which: RNBCs | 1 | 2 | 3 | 4 | 5 |
Total Assets | 71,725 | 23,172 | 94,744 | 24,452 |
|
| (32.3) |
| (25.8) |
Public Deposits | 24,699 | 22,622 | 24,395 | 22,358 |
|
| (91.6) |
| (91.6) |
Net Owned Funds | 8,287 | 1,366 | 12,261 | 1,714 |
|
| (16.5) |
| (14.0) |
P : Provisional * : Of the
376 registered NBFCs as on March 31, 2008, 335 filed Annual Returns by the cut-off
date of September 30, 2008.
Note :
1) NBFCs comprise
NBFCs-D and RNBCs.
2) Figures in respect of 2007-08 include 'IFCI Ltd' and
'TFCI Ltd'.
3) Figures in parentheses are percentage shares in the
respective
total of NBFCs.
Source : Annual Returns. | 6.51
The ratio of deposits of reporting NBFCs to the aggregate deposits of scheduled
commercial banks dropped to 0.73 per cent at end-March 2008 from 0.92 per cent
at end-March 2007 mainly due to the decline in deposits of reporting NBFCs. The
share of NBFC deposits in broad liquidity aggregate (L3) also declined during
the period (Chart VI.2). 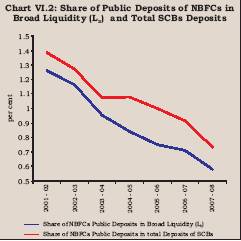
Operations
of NBFCs (excluding RNBCs) 6.52
Total assets/liabilities of NBFCs (excluding RNBCs) expanded at a much higher
rate of 44.8 per cent during 2007-08 compared with 28.4 per cent during 2006-07
(Table VI.15). Borrowings, which is the major source of funds
for NBFCs, increased by 55.3 per cent during the year, while public deposits declined
by 1.9 per cent indicating the continuing shift in the pattern of resources raised.
On the assets side, hire purchase assets witnessed a deceleration, while loans
and advances witnessed a sharp rise during 2007-08. Total investments of NBFCs
decelerated mainly due to deceleration in investments in approved securities.
Other investments, which had declined during 2006-07, increased sharply by 33.1
per cent during 2007-08.
Table
VI:15 Consolidated Balance Sheet of NBFCs-D |
(Amount
in Rs. crore) | Item | As
at End-March | Variations |
2007 | 2008
P | 2006-07 | 2007-08
P | Absolute | Per
cent | Absolute | Per
cent | 1 | 2 | 3 | 4 | 5 |
| 6 | 7 |
Liabilities
| |
| |
| |
| | 1. | Paid
Up Capital | 2,268 | 3,240 | 441 | 24.2 |
| 971 | 42.8 |
|
| (4.7) | (4.6) |
| |
| |
| 2. | Reserves
& Surplus | 5,861 | 8,630 | 236 | 4.2 |
| 2,768 | 47.2 |
|
| (12.1) | (12.3) |
| |
| |
| 3. | Public
Deposit | 2,077 | 2,038 | -370 | -15.1 |
| -40 | -1.9 |
|
| (4.3) | (2.9) |
| |
| |
| | 4. | Borrowings | 32,452 | 50,384 | 7,510 | 30.1 | | 17,932 | 55.3 |
|
| (66.8) | (71.7) |
| |
| |
| 5. | Other
Liabilities | 5,895 | 6,001 | 2,908 | 97.3 |
| 107 | 1.8 |
|
| (12.1) | (8.5) |
| |
| |
| | Total
Liabilities/Assets | 48,554 | 70,292 | 10,726 | 28.4 |
| 21,738
| 44.8
| Assets
| |
| |
| |
| |
1. | Investments | 7,412 | 11,500 | 3,086 | 71.3 |
| 4,088 | 55.2 |
|
| (15.3) | (16.4) |
| |
| |
| | i) | Approved
Securities @ | 4,287 | 7,343 | 3,995 | 1368.3 |
| 3,055 | 71.3 |
| ii) | Other
Investments | 3,125 | 4,157 | -909 | -22.5 |
| 1,033 | 33.1 |
2. | Loan
& Advances | 11,059 | 19,921 | 373 | 3.5 |
| 8,862 | 80.1 |
|
| (22.8) | (28.3) |
| |
| |
| 3. | Hire
Purchase Assets | 26,222 | 32,842 | 6,214 | 31.1 |
| 6,619 | 25.2 |
|
| (54.0) | (46.7) |
| |
| |
| 4. | Equipment
Leasing Assets | 1,365 | 1,100 | -137 | -9.1 |
| -265 | -19.4 |
|
| (2.8) | (1.6) |
| |
| |
| 5. | Bill
Business | 7 | 10 | -37 | -83.1 |
| 3 | 39.8 |
|
| (0.0) | (0.0) |
| |
| |
| 6. | Other
Assets | 2,488 | 4,919 | 1,227 | 97.3 |
| 2,430 | 97.7 |
|
| (5.1) | (7.0) |
| |
| |
| P : Provisional.
@ : SLR Asset comprises 'Approved Securities' and 'unencumbered term deposits'
in Scheduled Commercial Banks.
Note :
1) Figures in respect
of 2007-08 include 'IFCI Ltd' and 'TFCI Ltd'.
2) Figures in parentheses are
percentages to total liabilities/assets.
Source : Annual
Returns. | 6.53 Among NBFC groups, asset finance companies
(AFCs) held the largest share in total assets/liabilities (64.1 per cent), followed
by loan companies (27.5 per cent), hire purchase companies (7.5 per cent) and
investment companies (0.6 per cent) (Table VI.16). The increase
in assets / liabilities of AFCs was mainly on account of reclassification of NBFCs,
which was initiated in December 2006 and the process of which is still continuing.
On the other hand, the increase in assets / liabilities of loan companies was
mainly on account of restoration of IFCI Ltd. and TFCI Ltd. from FIs category
to the loan category of NBFCs. The share of equipment leasing companies declined
to below 1 per cent subsequent upon the re-classification of NBFCs in 2006-07.
The relative significance of various NBFC groups reflected largely the pattern
of their borrowings as deposits constituted a small share (2.9 per cent) of their
total liabilities. Of the total deposits held by all NBFCs, asset finance companies
held the largest share in total deposits of NBFCs (56.7 per cent), followed distantly
by hire purchase companies with a 26.2 per cent share and by loan companies with
a share of 15.8 per cent (Table VI.16).
Table
VI.16: Major Components of Liabilities of NBFCs-D by Classification of NBFCs |
(Amount
in Rs. crore) | Classification
of NBFCs | Liabilities | Deposits | Borrowings |
2006-07 | 2007-08
P | 2006-07 | 2007-08
P | 2006-07 | 2007-08
P | 1 | 2 | 3 | 4 | 5 | 6 | 7 |
Asset Finance | 24,718 | 45,071 | 186 | 1,156 | 19,091 | 32,461 |
| (50.9) | (64.1) | (8.9) | (56.7) | (58.8) | (64.4) |
Equipment Leasing | 325 | 156 | 43 | 8 | 128 | 69 |
| (0.7) | (0.2) | (2.1) | (0.4) | (0.4) | (0.1) |
Hire Purchase | 17,376 | 5,302 | 1683 | 533 | 10,683 | 3,516 |
| (35.8) | (7.5) | (81.0) | (26.2) | (32.9) | (7.0) |
Investment | 1,633 | 402 | 45 | 19 | 133 | 358 |
| (3.4) | (0.6) | (2.2) | (0.9) | (0.4) | (0.7) |
Loan | 4,499 | 19,362 | 117 | 321 | 2,417 | 13,980 |
| (9.3) | (27.5) | (5.6) | (15.8) | (7.4) | (27.7) |
MNBC | 2 | – | 2 | – | – | – |
| (0.0) | (0.0) | (0.1) | (0.0) | (0.0) | (0.0) |
Total | 48,554 | 70,292 | 2,077 | 2,038 | 32,452 | 50,384 |
– : Nil/Negligible. P
: Provisional.
Note:
1) Figures in respect of
2007-08 include 'IFCI Ltd' and 'TFCI Ltd'.
2) Figures in parentheses are percentage
shares in respective total.
Source : Annual Returns. |
Deposits Profile of Public Deposits of Different
Categories of NBFCs 6.54 Continuing the trend of the previous year,
public deposits held by all groups of NBFCs taken together, declined moderately
during 2007-08. This trend is indicative of the shift in preference of NBFCs from
public deposits to bank loans/ debentures. The decline in public deposits was
mainly evident in the case of equipment leasing companies and hire purchase companies,
mainly due to reclassification of some of these companies as asset finance companies.
Concomitantly, deposits of asset finance companies increased by 522.4 per cent.
The deposits of loan companies also increased by 174.3 per cent, mainly reflecting
the inclusion of IFCI Ltd. and TFCI Ltd. in this category (Table
VI.17). Size-wise Classification of NBFCs Deposits
6.55 Deposits held by NBFCs ranged from less than Rs.0.5 crore to above Rs.50
crore (Table VI.18). The deposits held by NBFCs in all deposit-groups declined
during 2007-08, except in the deposit-class 'more than Rs.2 1
Trigger event is defined as the classification of the account of the borrower
as non-performing asset in the books of the creditor institution. |