|
Abstract: The crude price shock in the 1970s sent many economies tumbling down for almost a decade. Four decades later, this shock can still jeopardise those economies which are primarily dependent on crude imports. This study looks at the quantitative impact of crude price shock on India’s three major macro-stability indicators: current account deficit (CAD), inflation and fiscal deficit. We find that if a crude price shock hits the Indian economy, the CAD to GDP ratio will rise sharply irrespective of a higher GDP growth; and a 10 USD/barrel increase in oil price will raise the inflation by roughly 49 basis points (bps) or increase the fiscal deficit by 43 bps (as a percentage of GDP) if the government decides to absorb the entire oil price shock rather than passing it to the end users.
I. Introduction
The international crude prices increased by around 12 per cent between April and September 2018. The mid-year spike in crude prices happened mainly due to spurt in demand, on the back of global growth revival, and partly due to geopolitical risks that led to supply-side shocks. This increase in crude prices was a big concern for all oil-importing2 countries, as their terms of trade showed signs of deterioration after a favourable stint since 2014. The Federal Reserve balance sheet normalisation has further added to the external sector vulnerability of these countries by putting pressure on their currency.
Since mid-November 2018, the crude prices have declined significantly but they remain volatile. Against this backdrop, we analyse the impact of a crude price shock (sudden increase) on India as it is heavily dependent on oil imports for satisfying its domestic demand. We quantify the impact of crude shock on current account deficit (CAD), inflation and fiscal situation. A high crude price directly maps into a high trade deficit and in turn a high CAD. At the same time, being an important input for the aggregate economy, a crude price shock also leads to a spike in domestic inflation. Finally, the government decides on the level of pass-through of this price shock to the domestic consumers and industry, which can decrease the inflation in the short run, but at the cost of increase in fiscal slippage.
In this paper, we first show that an increase in crude price worsens the Current Account Deficit (CAD) for India and this adverse impact cannot be significantly contained through a higher Gross Domestic Product (GDP) growth. So, a crude price shock will be followed by high CAD to GDP ratio. Second, it will increase inflation, if price increase is passed on directly to the final consumers. Under the most conservative estimate, we quantify that a USD 10/barrel increase in crude price at the price of USD 65/barrel3 will lead to a 49 basis points (bps) increase in headline inflation. A similar increase at USD 55/barrel gives around a 58 bps increase in headline inflation. Third, if the government decides upon a zero pass-through to the final consumers, a USD 10/barrel increase in the crude prices could increase the fiscal deficit by 43 bps. This zero pass-through scenario thus allows us to put an upper bound on the amount of fiscal slippage. The actual inflation and fiscal deficit will finally depend on the level of government intervention (changes in tax and subsidy) in the domestic oil market.
These results suggest that the crude price shock will continue to be a cause of concern on both domestic and external fronts in the foreseeable future. We begin the analysis by presenting the impact of crude price shock on CAD in the next section. Section III provides the main results for its impact on inflation, while Section IV gives the impact on fiscal slippage. Finally, Section V concludes.
II. Current Account Deficit (CAD)
The volume of crude imports has been rising steadily at around 4.5 per cent per annum for India4. In value terms, crude is the single largest import contributor and has consistently accounted for more than 20 per cent of India’s imports basket. Since India imports most of its crude, it remains susceptible to global crude price shocks.
The silver lining in crude imports is that currently around one-third of these imports are re-exported after refining and other value addition. There is a complete pass-through of raw crude prices into re-exports as the demand for these exports is also inelastic. Combining the above stylized facts gives us the following trade deficit equation on account of oil:
| Table 1: Impact of oil prices on CAD |
Price Crude
(USD/barrel) |
Trade Deficit Crude
(% of GDP) |
Trade Deficit Crude
(billion USD) |
| 55 |
-2.33 |
-68.9 |
| 65 |
-2.76 |
-81.4 |
| 75 |
-3.18 |
-93.9 |
| 85 |
-3.61 |
-106.4 |
Based on the above equation, we have given the deficit value on account of oil under different oil price scenarios in Table 15. In the worst case scenario, when crude prices hit USD 85/barrel (row 4 of Table 1), the deficit on account of oil balloons to USD 106.4 billion, which is 3.61 per cent of India’s GDP. As a rule of thumb, we can infer from Table 1 that every USD 10/barrel increase in crude prices leads to an additional USD 12.5 billion deficit, which is roughly 43 bps of India’s GDP. So, every USD 10/barrel increase in crude price will shoot up the CAD/GDP ratio by 43 bps.
Given the vulnerability of India’s CAD on account of global crude prices, the next obvious question is whether a high GDP growth can partially cushion the adverse impact of oil price shock? To test this, we look at changes in CAD/GDP ratio with respect to (w.r.t.) nominal GDP growth and find that a 100 bps increase in GDP growth rate can only shave off 2 bps in CAD/GDP ratio as shown in Figure 1.
In Figure 1, we have plotted CAD/GDP ratio for various crude price scenarios (Scenario 1: USD 65/barrel, Scenario 2: USD 75/barrel and Scenario 3: USD 85/barrel) 6. As crude prices increase, the CAD/GDP ratio shifts up (worsens) for a given growth level. However, for a given crude price, having a higher GDP growth does not offset the CAD/GDP ratio greatly because it hardly changes the denominator of this ratio.
To summarise, India’s external sector remains highly vulnerable to global crude price movements and it will continue to remain so in the near future. Keeping this in mind, we can now shift focus to the domestic front and analyse the impact of this shock on inflation and government budget in the next two sections.
III. Inflation
A rise in global crude prices will increase the domestic price of crude products and increase domestic inflation (Bhattacharya and Bhattacharya (2001)). This impact of crude on consumer price index (CPI) comes from two channels. First, the direct channel where crude products themselves appear as constituents in the CPI. In the short run, a change in prices of crude products will affect the CPI directly due to their weighted contribution in the index (weights are shown in Table 2). Second, over time the retail prices of all other commodities manufactured using crude as an input will also increase due to this shock and in turn affect the CPI again, which is the indirect effect. The net impact of the crude price increase on inflation is thus given by the sum of both direct and indirect effects.
The direct effect is simple and can be calculated by summing the weights corresponding to various crude products in the CPI:
In order to calculate the indirect impact, one needs to take into account the extent of dependence of other commodities on oil as an input. This information on production interdependence is captured through the input-output (I-O) table7. We further make the following assumptions to calculate this impact:
| Table 2: CPI Category and weights |
| CPI Category |
CPI Weight |
| Transport (Petrol and Diesel) |
2.4 |
| Fuel And Light (Fuel Others) |
0.1 |
| Fuel And Light (Kerosene, LPG) |
1.9 |
| Total |
4.4 |
-
Mechanical pass through of crude price shock directly into final prices without considering the possibility of input substitution in production. Therefore, our calculations reflect the upper bound of indirect effect of oil prices on the prices of non-oil CPI components.
-
The non-oil CPI components are as intensive in oil input as the rest of the economy8.
To calculate the input intensity of oil in the economy, we use a weighted average as given below:
Here, weighti is the share of sector i output in the economy, while Share Oili is the share of oil in its input mix. Both the weight and share of oil input in sector i are calculated from the I-O table. The weighti gives the importance of sector i in the overall economy and Share Oili is its dependence on oil. The weighted sum above gives the importance of oil as an input in the aggregate output of the economy.
Finally, the indirect impact of oil on inflation is captured by:
where WeightCPI Non Oil is the weight of non-oil components in the CPI that will be impacted through the indirect effect. Its product with Share Oilaggregate and % Price Change gives the total rise in input costs (on account of oil) after crude price increase. With this in hand, we can now calculate the total impact of crude price shock on inflation.
III.1 Inflation Results
Before calculating the impact of international crude price shock on domestic inflation, we adjust for the fact that a given change in international crude price does not lead to an equal percentage change in pump prices. The pump prices are what the final consumers pay. We therefore need to differentiate between the static and dynamic components of pump prices. Some components of pump prices do not change with change in prices charged by Oil Marketing Companies (OMCs) and are static over time (e.g., dealers’ commission). After correcting for these static components, we find that the pass-through of international crude prices into pump prices is only around 66 per cent if OMCs pass the whole of international price increase on to the final consumers (sample pump pricing for Delhi is shown in Table 5). We report inflation results for both 100 per cent pass-through as well as 66 per cent pass-through, but the latter provides estimates closer to reality.
Table 3 below gives the impact of increase in oil price on inflation for a USD 10/barrel increase in oil price from an initial baseline price of USD 55/barrel and USD 65/barrel. Column (1) corresponds to the CPI weights used in direct calculations. Including LPG and Kerosene increases the weight in column (1), but they are currently subsidized and will not see full pass-through of international prices.
We first look at the case where pass-through to pump prices is only 66 per cent (the top panel of Table 3). The most conservative estimate is highlighted in the first row and corresponds to the case where only transport component of CPI is taken into account for the direct impact. A USD 10 increase at USD 65/barrel will have a direct impact of 24 bps and an indirect impact of 26 bps, thus giving a total of around 49 bps impact on inflation (column (7)). It is noteworthy that the two components, direct and indirect, are roughly of the same magnitude and will have similar contribution to the headline inflation.
If we include other fuel components of CPI in inflation calculations, it increases the direct impact. However, the indirect impact remains the same. The maximum direct impact comes in the case where LPG and Kerosene components from CPI are also included in the direct impact. This scenario is presented in 3rd row of the top panel of Table 3 where the total weight of oil products in CPI under direct calculation is 4.4. The direct impact on inflation now jumps to 44 bps as seen in column (5).
Finally, we can look at the bottom panel of Table 3, which reports inflation calculation assuming a full pass-through of international prices into pump prices. Here the impact on inflation is higher due to a bigger change in pump prices under all scenarios. However, the most conservative estimates, the highlighted row in Table 3, give the most realistic estimates for the impact of crude prices on inflation in the near future.
| Table 3: Direct and indirect impact of crude prices (in bps) |
| |
CPI
Weight |
Initial Price=$55/barrel |
Initial Price=$65/barrel |
| Direct |
Indirect |
Total |
Direct |
Indirect |
Total |
| (1) |
(2) |
(3) |
(4) |
(5) |
(6) |
(7) |
| Elastictiy of pump price to international crude= 66% (Controlling for Cess) |
| CPl (Transport) |
2.4 |
28 |
30 |
58 |
24 |
26 |
49 |
| CPI (Transport+Others) |
2.5 |
30 |
30 |
60 |
26 |
26 |
51 |
| CPI (Transport+Others+LPG+Kero) |
4.4 |
52 |
30 |
82 |
44 |
26 |
70 |
| Elasticity of pump price to international crude= 100% (Ignoring Cess) |
| CPl (Transport) |
2.4 |
43 |
46 |
89 |
36 |
39 |
75 |
| CPl (Transport+Others) |
2.5 |
46 |
46 |
92 |
39 |
39 |
78 |
| CPI (Transport+Others+LPG+Kero) |
4.4 |
79 |
46 |
125 |
67 |
39 |
106 |
| Kero: Kerosene |
We will close the discussion on inflation by highlighting two other important points. First, LPG and Kerosene markets have been more sticky than Petrol or Diesel. So, the direct impact on prices of LPG and Kerosene will be less in the short run unless government decides to pass through the entire price burden on to the final consumers. Second, we have assumed the tax structure to be similar for LPG and Kerosene, leading to a 66per cent pass-through to the final prices in case of full pass-through. But the cess components of tax on LPG and Kerosene can be different, which can slightly modify the magnitude of direct impact.
III.2 Robustness: Elasticity of CPI with respect to Pump Prices
The above sub-section gives the impact of oil prices on inflation, where the direct impact comes directly from the weight of oil components in the CPI, while I-O approach gives the indirect impact. However, the indirect impact can also be calculated by estimating the elasticity of change in CPI w.r.t. the pump prices of various fuels. We estimate the following equation to assess the indirect impact:
where, Gr(CPI component) is the 3-month growth in the sub-group of CPI index (Non-Fuel, Food and Core) and Gr (PumpPrice) is the 3-month growth in pump price of petrol or diesel. Here, β1 is the coefficient of interest and captures the elasticity of CPI w.r.t. pump prices (monthly price from Delhi9). We control for seasonality and yearly variation in CPI by including quarter and year fixed effects, D(quarter) and D(year) respectively, in the above specification10.
Table 4 gives the results for the impact of petrol prices on CPI components estimated on data from January 2013-June 2018. We find that petrol prices have statistically significant impact only on core inflation11 (columns (5) and (6)), while there is no impact on other components (columns (1)-(4)). The results show that petrol prices do not have any impact on total Non-fuel or food inflation (columns (1)-(4)). Although the coefficients are positive in all these cases, the standard deviation of error is large. This mainly comes from the high error variance on the food components. Once we exclude food, the core inflation depends on petrol price in a positive and significant manner (columns (5)-(6)). Also, the impact of prices is passed within the same quarter. The price increase 3-month ago has no significant impact on core inflation as shown by its coefficient in column (5).
Our preferred estimate in column (5) of Table 4 indicates that every 100 bps increase in petrol price leads to 2.6 bps increase in core CPI index. Since a USD 10/barrel increase roughly translates to 1000 bps increase in pump prices (at crude price USD 65/barrel), it could increase core inflation by 26 bps and overall CPI inflation by 12.5 bps (core is 47 percentage of total CPI)12. This gives slightly lower estimates for indirect impact of oil on inflation compared to the one obtained from the I-O method. However, it is not surprising as the calculation of indirect effect through I-O method assumes full pass-through of input price increase into output prices.
In column (7) as a robustness check, we also include a cross product of Gr(PumpPrice) with petrol (price level) in our specification to test whether impact on inflation is different at different levels of petrol price. Here, the coefficient β1 turns negative while the cross product term remains positive. At a petrol price of Rs 70/litre, the aggregate impact of petrol price change on inflation in case of specification in column (7) is similar to the impact in case of specification in column (6). However the results are more noisy as we move away from the price of Rs 70/litre. Finally, we do not find similar impact of diesel prices on any inflation component (Table A.2 in Appendix).
| Table 4: Impact on petrol prices on CPI |
| |
Quarterly Growth Rate of CPI Components |
| Non Fuel |
Food |
Core |
| (1) |
(2) |
(3) |
(4) |
(5) |
(6) |
(7) |
| Gr(Petrol)t |
0.090 |
0.103 |
0.125 |
0.105 |
0.026** |
0.021** |
-0.400** |
| |
(0.219) |
(0.205) |
(0.220) |
(0.207) |
(0.012) |
(0.010) |
(0.171) |
| Gr(Petrol)t-3 |
-0.004 |
|
0.015 |
|
0.005 |
|
|
| |
(0.215) |
|
(0.216) |
|
(0.012) |
|
|
| Petrolt |
|
|
|
|
|
|
-0.008 |
| |
|
|
|
|
|
|
(0.031) |
| Petrolt* |
|
|
|
|
|
|
0.006 ** |
| Gr(Petrol)t |
|
|
|
|
|
|
(0.003) |
| Year FE |
Y |
Y |
Y |
Y |
Y |
Y |
Y |
| Quarter FE |
Y |
Y |
Y |
Y |
Y |
Y |
Y |
| Observations |
82 |
85 |
82 |
85 |
82 |
85 |
85 |
| R2 |
0.280 |
0.313 |
0.300 |
0.330 |
0.433 |
0.588 |
0.574 |
| Note: Monthly Data Jan-2011 to April-2018. *p<0.1; **p<0.05; ***p<0.01 |
Overall, these robustness results support our main analysis on the impact of crude price increase on inflation. The indirect effect calculated through regression results are slightly lower, but nevertheless significant. In the next section, we analyse the impact on fiscal impact in case government decides to keep the consumer prices lower through subsidy and not pass-through the crude price shock.
IV. Fiscal Deficit
The impact of an increase in crude prices on fiscal deficit would depend on several factors that include (a) pass-through of international prices to pump prices, (b) excise and custom duty, and (c) petroleum subsidy (budgeted around 0.14 of GDP for FY-19). So far, the present government has passed on the increase in international crude prices to domestic pump prices. However, going forward, if the government decides to absorb a part of the same, it could have an impact on the budget deficit.
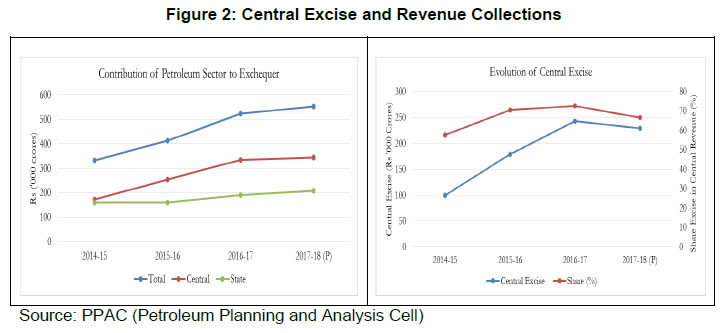
The tax revenue collection of the governments could get a push due to the petrol price increase as the ad-valorem tax component is likely to increase revenue collection (if tax rates are kept unchanged, see Table 5 for sample tax incidence on Petrol in Delhi) and vice-versa. The contribution of the petroleum sector to the exchequer went up from ₹ 3.34 billion in FY-15 to ₹ 5.53 billion in FY-18, at a time when the global crude prices moved south and touched record lows. This came primarily from an increase in central excise as global crude prices cooled down in 2014 (Figure 2). The revenue of state governments from oil products also went up during this time, but only moderately.
| Table 5: Sample tax calculations from HPCL website |
| Price Build-up of Petrol at Delhi at BPCL Retail Pump Outlets |
| Sr.No. |
Elements |
Unit |
Effective 02-Jun-18 |
| 1 |
C & F (Cost & Freight) Price (Moving Average basis) |
$/bbl |
88.83 |
| 2 |
Average Exchange Rate |
₹/$ |
67.94 |
| 3 |
Price Charged to Dealers (excluding Excise Duty & VAT) |
₹/ltr |
38.44 |
| 4 |
Add: Excise Duty |
₹/ltr |
19.48 |
| 5 |
Add: Dealer Commission (Average) |
₹/ltr |
3.63 |
| 6 |
Add:VAT (including VAT on Dealer Commission) applicable for Delhi @27% |
₹/ltr |
16.63 |
| 7 |
Retail Selling Price at Delhi (rounded) |
₹/ltr |
78.18 |
Since most states do not provide petroleum subsidy directly, the impact of any change in crude prices would mostly get reflected in the fiscal number for the central government. The exact magnitude of this additional net subsidy would mainly depend on the policy decision on excise duty and the pass-through of a change in global crude prices.
Given these various policy levers, it is difficult to pin down the exact value of fiscal deficit on account of petroleum subsidy. However, one can calculate an upper bound of the additional fiscal deficit, by abstaining from changes in tax considerations and assuming zero pass-through of any future increase in global prices to the final consumer. Using the trade equation, post adjustment for re-exports of crude products, a USD 10/barrel increase in crude prices will lead to a spending of USD 12.5 billion (see Table 1). If the central government decides to absorb this increase in global prices, ceteris paribus, it would lead to an equivalent change in fiscal deficit13. A fiscal slippage of USD 12.5 billion for every USD 10/barrel change in crude prices is around 43 bps of GDP (Figure 3).
 The actual deficit/slippage figure is likely to be lower than 43 bps, since the crude prices have decreased considerably in the last two months. In recent periods, the central government has passed on the increased prices to the public in case of petrol and diesel, while retained the subsidy on kerosene and LPG. So, it seems unlikely that additional fiscal deficit will hit this upper bound.
V. Conclusion
This study has presented broad results on the impact of oil price shock on the Indian economy from an accounting perspective. On the external side, we have shown that India will remain vulnerable to such shocks due to its high import dependence. This vulnerability can lead to episodes of sharp increase in CAD and rising GDP growth would be insufficient to counter it. On the domestic front, such episodes will lead to surge in inflation or fiscal deficit or both, depending on how much of the increased prices the fiscal authority decides to pass-through.
We note in conclusion that we have not explored the relationship between government spending and inflation. The increase in fiscal deficit can have a secondary impact on inflation over the medium to long run. While quantifying this is outside the scope of this memo, it will be a useful extension for understanding the impact of a crude price shock on inflation, through the channel of fiscal deficit.
References
Kaushik B. and Indranil Bhattacharya, “Impact of Increase in Oil Prices on Inflation and Output in India”, Economic and Political Weekly, December 22, 2001, 4735.
Appendix
Example of pass-through to pump prices
How will a 10per cent shock in international crude price reflect in final petrol/diesel prices? Table A.1 shows the calculation from baseline of USD 65/barrel. Given a pump elasticity of 66per cent, a 10per cent shock in international prices translates into 6.6per cent shock at the pump level. The inflation calculation then follows directly from the Section 3 (based on equation (2) and (4)).
| Table A.1: Example of pass-through to pump prices |
| |
Weight
(CPI) |
Weight
(Input) |
Crude increase
*Avg USD 65/barrel |
International
Shock |
Shock
(Incidence Delhi) |
Inflation
(basis points) |
| 1. CPI (Fuel+Transport) |
4.4 |
- |
$6.5 |
10% |
6.6% |
28.7 |
| 2. Other Inputs |
95.6 |
2.65 |
$6.5 |
10% |
6.6% |
16.7 |
Calculation of y-o-y inflation in case of regression (equation (5)) in Section III
| Table A.2: Impact of diesel prices on CPI |
| |
Quarterly Growth Rate of CPI Components |
| Non Fuel |
Food |
Core |
| (1) |
(2) |
(3) |
(4) |
(5) |
(6) |
| Gr(Diesel)t |
0.086 |
0.190 |
0.119 |
0.200 |
0.011 |
0.008 |
| |
(0.228) |
(0.206) |
(0.229) |
(0.208) |
(0.013) |
(0.011) |
| Gr(Diesel)t-3 |
-0.171 |
|
-0.003 |
|
-0.008 |
|
| |
(0.240) |
|
(0.241) |
|
(0.014) |
|
| Year FE |
Y |
Y |
Y |
Y |
Y |
Y |
| Quarter FE |
Y |
Y |
Y |
Y |
Y |
Y |
| Observations |
82 |
85 |
82 |
85 |
82 |
85 |
| R2 |
0.280 |
0.313 |
0.300 |
0.330 |
0.433 |
0.588 |
| Note: Monthly Data Jan-2011 to April-2018. *p<0.1; **p<0.05; ***p<0.01 |
|