|
Abstract
This paper studies the impact of increase in house rent allowance (HRA), following recommendations of the 7th Central Pay Commission (CPC), on headline inflation. It is seen, that the HRA increase pushed up measured housing inflation significantly, with a peak impact of about 35 basis points. The impact is seen across most States and Union Territories. The paper shows that, so far, the actual impact of the HRA increase on headline consumer price index has turned out to be similar to the ex-ante assessment provided by the Reserve Bank in the Fifth Bi-monthly Monetary Policy Statement, December 2017.
1. Introduction
A new era dawned in India with amendments to the Reserve Bank of India (RBI) Act on May 14, 2016, whereby RBI was given explicit mandate and objective to conduct monetary policy. Conduct of monetary policy transited to a flexible inflation targeting (FIT) framework with the primary objective to “maintain price stability while keeping in mind the objective of growth”. Price stability was defined explicitly as consumer price index (CPI) inflation of 4 per cent with a tolerance band of +/- 2 per cent.2 The decade that reeled under persistent high/double digit inflation during the initial years, saw, post adoption of FIT, inflation gliding down into the tolerance band.
Since the middle of last year, inter alia, revision in house rent allowance (HRA) for government employees, has imparted an upside push to measured inflation. This paper first explains the method of housing index compilation and demystifies the way of assessing the impact of HRA on headline inflation. Second, it measures the progress of housing inflation before and after the increase by the 7th Central Pay Commission (CPC). Finally, important implications for housing index compilation and dissemination are drawn.
2. Construction of Housing Index in CPI
Housing is a major component in CPI with a weight of 10.07 per cent. Within housing, the weight of house rent is 9.51 per cent and that of other miscellaneous housing services 0.56 per cent. Central Statistics Office (CSO) compiles housing index only for urban centres. Both rented and self-owned dwellings are considered by CSO for construction of housing index. For imputing the rent of self-owned houses, the market rent payable on rented accommodation of same type is used. This is called the rental equivalent approach.3 CSO uses state-wise shares of rented and self-owned dwellings, classified according to different number of living rooms (one, two, three and four or more), as weights to combine the rental data.4 These weights are obtained from the Survey on Housing Conditions (July-December 2012). The Survey assesses the tenurial status of dwellings, i.e., if they are self-owned or hired. For the hired dwellings, the survey further ascertains if they are employer provided or privately rented.
For compilation of house rent index, CSO conducts repeat house rent survey covering a fixed sample of 13,368 rented dwellings spread across 1,114 markets of 310 towns. The sample remains fixed with replacements taking place only at the margin when there is repeated non-response. Of these dwellings, about 13.7 per cent are government accommodations. For privately rented houses, the actual rent paid by the tenants are collected. However, in the case of government accommodation, rent includes the licence fee plus the HRA foregone by the occupant – higher the rank of the occupant, higher will be the computed rent and vice versa.4
A “chain base” method is used by CSO for compiling house rent index. As per this method, a representative sub-sample of one-sixth of the sample dwellings (i.e., 2228 in number) across all markets are surveyed each month so that the entire sample is covered in six months. Accordingly, dwellings surveyed in the month of, say, July are visited again in the following January; those surveyed in August are surveyed again in February, and so on. Since rent is not reset frequently, this method captures rental movements appropriately. While rental data are collected for one-sixth of the sample of rented dwellings each month, for compiling rent index, six months data are used. For example, for constructing housing index for December 2017, the rental data collected during the months of July-December 2017 are used.
3. The Increase in HRA Under the 7th CPC – Impact on CPI
In July 2017, revised HRA structure under the 7th CPC came into place. As per the recommendation of the 7th CPC, the basic pay of government employees rose by a factor of 2.57. Accordingly, HRA stood revised by 105.6 per cent, i.e., by more than double the pre-CPC level (Annex 1, Table 1).
Impact of HRA Increase on CPI
Under the chain base method of housing index compilation and given a sharp increase in rentals of a subset of sample dwellings, headline inflation was expected, ex ante, to gradually increase over six months, remain elevated for another six months, and peter out of the effect thereafter. Of the sample dwellings, about 13.7 per cent are government houses (Centre, States and others). If HRA of all these houses increased by 105.6 per cent, with the weight of house rent at 9.51 per cent in CPI, the peak increase in headline inflation works out to around 140 basis points (bps).5 This increase sets in gradually as one-sixth of these houses are visited each month starting July 2017 and fades out in 18 months (Table 1).
| Table 1: Impact of HRA Increase (in bps) |
| Month |
Headline Inflation$ |
| Jul-17 |
23 |
| Aug-17 |
46 |
| Sep-17 |
69 |
| Oct-17 |
92 |
| Nov-17 |
115 |
| Dec-17 |
138 |
| Jan-18 |
138 |
| Feb-18 |
138 |
| Mar-18 |
138 |
| Apr-18 |
138 |
| May-18 |
138 |
| Jun-18 |
138 |
| Jul-18 |
115 |
| Aug-18 |
92 |
| Sep-18 |
69 |
| Oct-18 |
46 |
| Nov-18 |
23 |
| $ House rent inflation will increase gradually each month by an amount β = (1/6 x 13.7/100 x 105.6) x 100 bps. Headline inflation will increase by (9.51/100 x β) bps each month. |
In July 2017, however, the HRA was increased only for Central government employees. Considering the Central government dwellings to be a fourth of total government dwellings in the sample6, under the chain base method, a sixth of these dwellings reported an increase in house rent by 105.6 per cent in July 2017. In six months, all the Central government houses in the sample were covered and each house reported such an increase. Taking this into account, the impact of the 7th CPC’s HRA award on headline inflation was expected ex ante to peak at 35 bps by December 2017; remain at that level for the next six months, and then gradually dissipate by end-2018.
In case all States (i.e., remaining three-fourth of sample government dwellings) implement HRA increase similar to the 7th CPC and the impact starts showing up from April 2018, headline inflation is expected to get pushed up further, with the impact peaking at about 100-105 bps and dissipating by end-2019 (Chart 1).
Similar quantum of increase in headline inflation, due to 7th CPC’s and States’ HRA awards, were communicated by RBI through its Monetary Policy Reports (MPRs) and policy statements (Chapter 1 in MPRs of April 2016, October 2016, April 2017, October 2017 and April 2018; Fourth Bi-monthly Monetary Policy Statement, 2017-18 – Para 15; Fifth Bi-monthly Monetary Policy Statement, 2017-18 – Para 19; and First Bi-monthly Monetary Policy Statement, 2018-19 – Para 18).
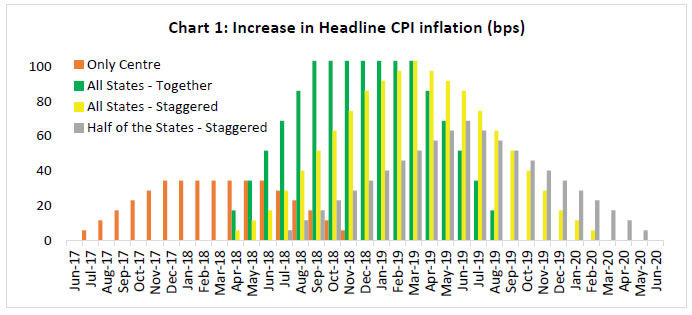 State HRA increase is likely to happen different from the scenario discussed above (shown in the green bars in Chart 1). If, for instance, States implement 7th CPC-like increase in a staggered manner, with a third effecting an increase every quarter starting April 2018, the increase will be more gradual and spread out (the yellow bars in Chart 1). Alternatively, if only half of the States award similar HRA increase (and others do not), in a staggered manner – half of which from July 2018 and remaining from January 2019 – lower impact will show up on headline inflation (the grey bars in Chart 1).
4. Evolution of CPI Housing Inflation – Trend and Progress
Housing inflation, which was in high single digit in 2012, gradually decelerated and averaged 5 per cent in 2015 and 2016. The recent trough in housing inflation was in June 2017 at 4.7 per cent. Since July 2017, housing inflation started increasing sharply and reached 8.3 per cent in 2018 (Chart 2 and Table 2).
| Table 2: Average Housing Inflation |
| Year |
Inflation (YoY %) |
| 2012 |
9.2 |
| 2013 |
8.1 |
| 2014 |
6.1 |
| 2015 |
4.8 |
| 2016 |
5.3 |
| 2017:H1 |
4.9 |
| 2017:H2 |
6.5 |
| 2018:Jan-Mar |
8.3 |
| Note: H1 is January-June and H2 is July-December |
The contribution of housing in headline inflation was close to the weight of housing in CPI at 10 per cent during July-March 2013-2017. Due to sharp increase in housing inflation, following the increase in HRA for the Central government employees, the percentage contribution of housing during July-March rose significantly (from 10 per cent to 17.7 per cent) and housing became one of the major drivers of headline CPI in 2017-18.
5. HRA Impact as it Unfolds in CPI
Since July 2017, housing index in CPI is inclusive of the impact of the 7th CPC’s HRA increase. To segregate this impact, CPI is reconstructed by replacing the housing index with an estimated index using the previous year’s trend. The gap between observed inflation and inflation from reconstructed index shows that over six months, the HRA increase gradually pushed up headline inflation by 35 bps and the impact remained till the latest data print of March 2018.7 The corresponding impact was more than double in CPI excluding food and fuel as house rent has a weight of 20.1 per cent in it (Chart 3).8
The ex-ante assessment made by RBI in MPRs and monetary policy statements used information as discussed in Section 3. The HRA impact based on ex-post analysis, as above, shows that inflation evolved close to the RBI’s assessment.
RBI has communicated that for policy purposes, the statistical direct effects of HRA award should be looked through. However, indirect effects through resetting of inflation expectations, e.g., may require monetary policy response. Hence, isolating and projecting the HRA impact precisely is important.
6. A Note for Data Producers
With CPI facing its first CPC revision, it must be challenging for the producers to address analysts’ and policy makers’ queries regarding the actual impact of HRA increase on CPI. Given that explicit primary objective of monetary policy now is ‘to maintain price stability while keeping in mind the objective of growth’ and given that price stability is measured using CPI, the need to understand and segregate the impact of HRA increase is more pronounced now than earlier when wholesale price index was the main inflation metric used by RBI.
Limitations of Estimation of HRA Impact
This note highlights the sensitivity of CPI inflation to changes in HRA under CPC awards. However, the analysis has some limitations as it presupposes that the rental behaviour of other than government houses remains unchanged. In absence of breakup of housing index into government (Central and others) and others, precise estimation of HRA impact on CPI inflation cannot be obtained, even ex post, from the published data. For analysts to assess the true impact of HRA, following observations are made:
Coverage of Government Housing in CPI Requires Attention
Several State governments such as Rajasthan, Tamil Nadu, Assam and Delhi have announced increase in pay and allowances for their employees similar to that of the 7th CPC. These four States, for instance, together have a weight of 17.3 per cent in CPI.9 Given this weight and given the timings of increase in HRA for these States, the headline CPI should have got further pushed up by 11-12 bps by December 2017. However, up to March 2018, there appears to be no impact on CPI inflation due to State governments’ pay and allowances revisions. This may be due to several reasons. First, administrative delays may lead to a lag between announcements and actual disbursals of allowances. Second, the disbursals may be partial or dispersed over a period depending on the States’ discretions/constraints and may, therefore, show a muted impact on CPI.
Third, even if disbursements have been made, the actual impact will depend on the share of State government houses in that State’s housing sample. For instance, the housing inflation in case of Delhi has fallen (Annex 2). Actual housing stock in Delhi is expected to consist of a fair number of Central and Delhi State government accommodations.10 A decline in housing inflation between June 2017 and March 2018 in Delhi suggests either absence or low coverage of government houses in Delhi’s sample of dwellings; or a sharp decline in ‘other-than-government’ houses, which, however, is not possible to assess with the existing CPI data.
Thus, the knowledge of when and by how much the States are implementing their pay and allowances award alone is not sufficient to estimate its impact on inflation. Adequate representation of State government dwellings, in the housing sample is an important factor to assess the impact. Data producers may consider keeping representative government houses while finalising the sample of dwellings (spread across all 1114 markets in 310 towns) for the rent survey, so as to adequately reflect the actual share of Central and State government houses in the States.
Need for Separate Indices
Since the sample of dwellings surveyed by CSO includes employer provided accommodation, CSO could consider producing separate housing indices for government housing and for others. This will facilitate analysis and inform monetary policy about the evolving trends in private/market rentals and the trends in government housing.
7. Concluding Remarks
Increase in HRA by the Centre from July 2017, pushed up housing inflation significantly with concomitant impact on headline inflation. This note studies the impact of increase in HRA on CPI inflation and comes up with the following conclusions:
-
Ex-post analysis of CPI shows that the 7th CPC’s HRA increase pushed up headline inflation prints gradually from July 2017, with a peak impact of about 35 bps.
-
While some States have implemented similar revision in pay and allowances for their employees, the impact is not showing up in the data due to several reasons. First, there may be administrative delays between announcement and actual disbursals. Second, the disbursals may be partial/staggered at States’ discretion. Third, even if disbursements have been made, the representation of State government houses in the sample of dwellings may not be adequate to capture the impact.
-
RBI, through the Monetary Policy Reports and the bi-monthly monetary policy statements, gave its ex-ante assessment of the impact of increase in 7th CPC’s HRA. The unfolding of data thus far, endorses this assessment.
Since proper assessment and understanding of HRA impact is important for policy analysis, it is suggested that the producers of CPI may consider the following: (i) for the future base revisions, while preparing fixed sample of dwellings for each State for collecting house rent data, representative share of government houses that reflect the actual share of Central and State government houses in the States may be kept; and (ii) as States’ impact unfolds going forward, for the existing series, housing index may be published separately for the government dwellings and other dwellings.
Annex 1
| Table 1: Effective HRA increase under the 7th CPC |
Cities
(Population) |
HRA as % of basic pay under 6th CPC |
Increase in basic pay under 7th CPC |
HRA as % of revised basic under 7th CPC |
New HRA as % of previous basic |
Actual Increase in HRA in 7th CPC over 6th CPC |
| (1) |
(2) |
(3) |
(4) |
(5)=(3)*(4) |
(6)=((5)-(2))/(2) |
X
(> 50 lakh) |
30 |
2.57 |
24 |
61.7 |
105.6 |
Y
(5-50 lakh) |
20 |
16 |
41.1 |
105.6 |
Z
(Below 5 lakh) |
10 |
8 |
20.6 |
105.6 |
| Average increase in HRA over the 6th CPC HRA |
105.6 |
Annex 2
HRA impact across States
The impact of HRA on housing inflation was seen across most States and Union Territories (UTs). The sharpest rise is witnessed in the UTs of Lakshadweep, Andaman and Nicobar Islands, and Chandigarh where the share of Central government dwellings in housing stock is expected to be high (Chart 1). This increase across States is not a reflection of implementation of pay and allowance increase by States but, most likely, emanates from the increase in HRA of Centre’s accommodations in these States following the 7th CPC’s HRA increase.
|