by Harshita Yadav, Aayushi Khandelwal, Kovuri Akash Yadav, Rachit Solanki, Anoop K Suresh, Samir Ranjan Behera and Atri Mukherjee^ The gross fiscal deficit as per cent of budget estimates moderated in H1:2024-25 over H1:2023-24 in case of both Centre and States, primarily on account of robust receipts, deceleration in their revenue expenditure growth and decline in capital expenditure. This provides fiscal room to them to boost capex in the latter half of 2024-25 which would aid in sustaining the post pandemic gains in expenditure quality and support medium-term growth prospects. Several States have announced sops in their 2024-25 Budgets; such spending may divert resources away from critical social and economic infrastructure development. Introduction The Union Budget 2024-25 chalked out a medium-term road map for Indian economy by presenting a detailed trajectory for the pursuit of Viksit Bharat. With its special focus on employment, skilling, micro, small and medium enterprises (MSMEs) and the middle class, the budget aimed at maintaining high growth rate while ensuring allocation of adequate resources for developmental needs. Continuing the thrust on infrastructure development, the Budget 2024-25 had provisioned ₹11.11 lakh crore (3.4 per cent of GDP) for capital expenditure which is higher than 3.2 per cent of GDP achieved in 2023-24 (provisional accounts, PA). On the other hand, revenue expenditure was budgeted to decline marginally from 11.8 per cent of GDP in 2023-24 (PA) to 11.4 per cent of GDP in 2024-25 (budget estimates, BE) thereby enhancing the overall quality of government expenditure. Further, towards incentivising States’ capital spending, allocation under the scheme – Special Assistance to States for Capital Investment - was enhanced. Overall, the Union Budget aimed at fiscal consolidation in 2024-25 in line with the medium-term target of GFD below 4.5 per cent of the GDP by 2025-26. The States too have endeavoured for fiscal consolidation in 2024-25, budgeting a consolidated GFD of 3.2 per cent of the GDP in 2024-25. The Centre’s revenue collections comprising both tax and non-tax sources were buoyant in H1:2024-25, primarily driven by income tax, goods and service tax (GST) and higher surplus transfer by the Reserve Bank. On account of robust receipts and relatively flat government spending, Centre’s GFD as per cent of BE during H1:2024-25 was the lowest in the last one decade. The growth in States’ revenue receipts during H1:2024-25 was driven by tax revenues, while there was a contraction in non-tax revenues and grants from the Centre. On the expenditure front, States sustained the pace of revenue expenditure during H1:2024-25, while their capital expenditure declined.1,2 The rest of the article is structured as follows: Section II analyses the receipt and expenditure of the Centre and States (at a quarterly frequency) for H1:2024-25. Section III deals with the outcomes in terms of key deficit indicators and their financing for the Centre as well as States. Section IV presents estimates on General government (Centre plus States) finances for H1 of 2024-25. Section V sets out concluding observations. II. Fiscal Outcomes in Q1 and Q2 During H1:2024-25, the Central government collected more than 50 per cent of its total budgeted receipts, in line with the trend witnessed during the recent past. On a year-on-year (y-o-y) basis, total receipts during H1:2024-25 rose by 15.5 per cent. On the other hand, the Centre’s total expenditure was contained below 50 per cent of the BE in H1:2024-25, in line with the pattern observed during the past three years (Chart 1a). States’ GFD stood at 43.9 per cent of the BE in H1:2024-25, marginally lower than the previous year mainly attributable to a slowdown in total expenditure as the States expended 39.8 per cent of BE vis-à-vis 40.1 per cent of BE in H1:2023-24 (Chart 1b). a. Receipts Revenue receipts of the Central government remained strong with a y-o-y growth of 16.1 per cent during H1:2024-25. In Q1:2024-25, the growth in the revenue receipts was 41.0 per cent on account of robust tax collections as well as the large surplus transfer of ₹2.1 lakh crore by the Reserve Bank. During Q2:2024-25, the revenue receipts contracted by 2.0 per cent, attributable to a fall in direct tax collections (Chart 2a). The performance of the non-debt capital receipts was subdued in Q1:2024-25, but recorded improvement in Q2:2024-25 (Chart 2b).3 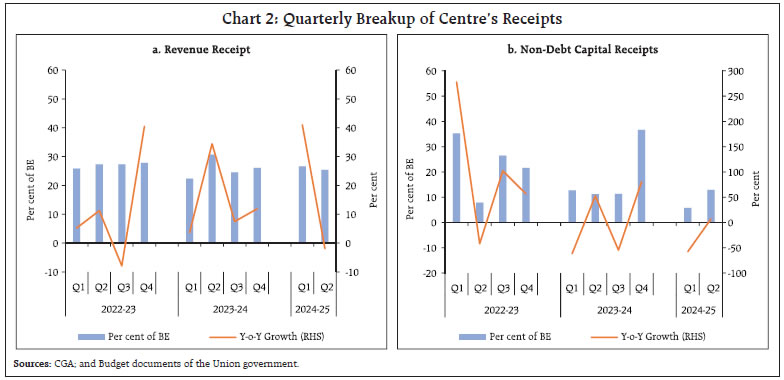
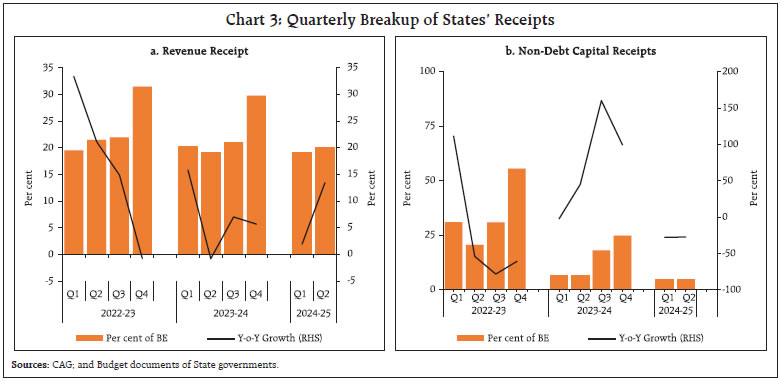 States’ revenue receipts clocked a y-o-y growth of 7.5 per cent in H1:2024-25 (7.1 per cent in H1:2023-24), with growth in Q1 and Q2 at 1.9 per cent and 13.4 per cent, respectively. Tax revenue, which accounted for 85.7 per cent of the revenue receipts during H1:2024-25, exhibited a growth of 16.4 per cent and 7.4 per cent in Q1:2024-25 and Q2:2024-25, respectively. States’ non-debt capital receipts4 contracted in both Q1 and Q2 of 2024-25 (Chart 3a and b). The Centre’s direct tax collection grew by 14.4 per cent on y-o-y basis in H1:2024-25, primarily led by a growth of 25.0 per cent in income tax collections with corporate tax collections registering a tepid growth of 2.3 per cent (Chart 4a). Similar to the pattern witnessed in H1:2023-24, income tax collections exceeded the corporate tax collections in H1:2024-25, reflecting, inter alia, measures towards improving taxpayers’ compliance and broadening the tax base. Moreover, within direct tax collection, receipts from security transaction tax have been robust in recent years with increased volume of trading in the Indian stock market (Box A). Box A: Security Transaction Tax - Indian Experience Security transaction tax (STT) is a direct tax levied on the buying and selling of securities in stock exchanges. It was introduced in India during 2004-05 with the objective of augmenting revenue generation, eliminate tax evasion, level the playing field for all the participants in the stock market and reduce the volatility in the market by driving away noise traders/speculators. Several G-20 economies such as United Kingdom, Russia, France, Italy, Turkey, South Korea, India, Indonesia, China, and South Africa have imposed some sort of tax on the financial transactions carried out by their residents (Matheson, 2012). On the other hand, some advanced economies, viz., Portugal, Netherlands, Sweden, Japan, Italy, and Germany have repealed financial transaction taxes, attributable to competitive pressures emanating from technological changes and liberalisation that have enabled shifting trading to other markets less costly (Hillman and Ashford, 2012; Burman et al., 2016).  The revenue mobilisation from STT has witnessed a rising trend, both in absolute terms and as per cent of GDP on account of buoyant equity market as well as the increased volume of trading in the Indian stock market over the past few years (Chart A.1a and 1b). As on November 10, 2024, the STT collections have registered a y-o-y growth of 90.0 per cent achieving 97 per cent of its BE for 2024-25 (Chart A.1c). The share of STT in direct taxes collections of Centre has increased in the post-pandemic period (Chart A.1d). References Burman, L. E., Gale, W. G., Gault, S., Kim, B., Nunns, J. and Rosenthal, S. (2016). Financial Transaction Taxes in Theory and Practice. National Tax Journal, 69(1), 171-216, March. Hillman, D. and Ashford, C. (2012). Financial Transaction Tax: Myth-Busting. Stamp Out Poverty, London, UK. Matheson, T. (2012). Security Transaction Taxes: Issues and Evidence. International Tax and Public Finance, 19(6), 884–912. | States’ own direct tax collection (comprising of land revenue and receipts from stamp duty and registration fees) performed well during H1:2024-25 with a growth of 13.2 per cent (12.2 per cent in Q1 and 14.2 per cent in Q2) (Chart 4b). The Centre’s indirect tax collection grew by 8.9 per cent (y-o-y) in H1:2024-255, led by GST. During Q1:2024-25, the indirect tax collections grew by 5.6 per cent (8.9 per cent Q1:2023-24), supported by 9.1 per cent growth in GST collections (11.5 per cent growth during Q1:2023-24). On the other hand, customs and excise duty collections witnessed a contraction in Q1:2024-25. In Q2:2024-25, buoyed by the festive demand, GST collections posted a growth of 11.8 per cent (6.0 per cent a year ago). Customs and excise duty collections recovered in Q2 with a growth of 15.6 per cent and 5.7 per cent, respectively. The GST collection (Centre plus States) in H1:2024-25 amounted to ₹10.9 lakh crore, registering a y-o-y growth of 9.5 per cent (11.1 per cent growth recorded in H1:2023-24), with average monthly collections in Q1 and Q2 of ₹1.86 lakh crore and ₹1.77 lakh crore, respectively (Chart 5). In the case of States, the growth in tax revenues in H1:2024-25 was supported by States GST (SGST) and tax devolution from the Centre. Strong growth in SGST reflected rising demand, higher tax rates and greater compliance. In H1:2024-25, the assignment to States recorded a growth of 19.6 per cent over the corresponding period of the previous year (Chart 6a and b). Centre’s non-tax revenue witnessed a contraction of 5.7 per cent y-o-y in Q2:2024-25, as higher dividends and profits as well as interest receipts6 were offset by a fall in revenue from economic services.7 Disinvestment receipts remained muted in H1:2024-25 with 6.3 per cent of the budgeted amount being raised (11.4 per cent in H1:2023-24) (Chart 7).8
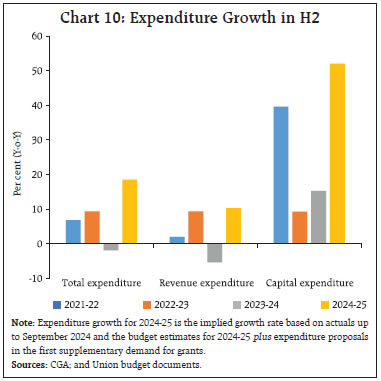
b. Expenditure In 2024-25 (BE), the total expenditure of the Central government has been budgeted to grow by 8.5 per cent over 2023-24 (PA), with revenue expenditure growth budgeted at 6.2 per cent and capital expenditure growth at 17.1 per cent.9 In H1:2024-25, revenue expenditure as per cent of BE remained broadly in line with previous years trends while capital expenditure registered moderation. The relatively lower share of budgeted expenditure realised during H1:2024-25 is, inter alia, attributable to the model code of conduct imposed during the general elections in Q1:2024-25 (Chart 8). 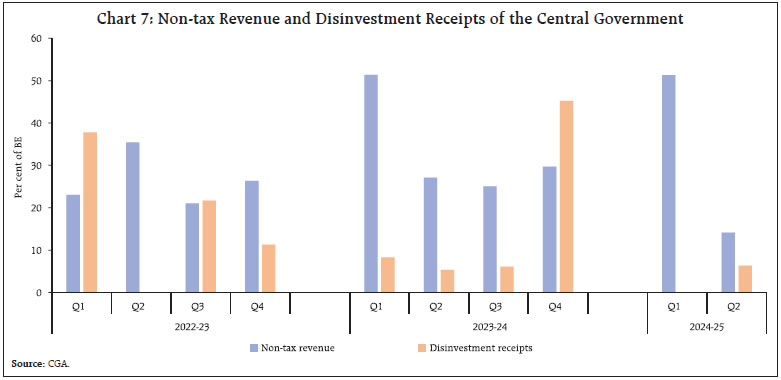 Capital expenditure of the top 6 ministries,10 which comprise 95 per cent of the total budgeted capex for 2024-25, fell to 37.3 per cent of BE during H1:2024-25 (vis-à-vis 51.8 per cent of BE in H1:2023-24) (Chart 9). Similarly, the expenditure under the scheme for ‘Special Assistance to States for Capital Investment’ fell to ₹30,040 crore during H1:2024-25 (vis-à-vis ₹53,541 crore during H1:2023-24).11 In September 2024, the Ministry of Finance (MoF), Government of India (GoI) eased the cash management guidelines which should boost public spending12 including capital expenditure in H2:2024-25. Further, the Union government had also proposed the first batch of supplementary demand for grants for 2024-25 during the winter session of parliament which involves a net cash outgo of ₹44,143 crore (Chart 10).  The outgo of the Central government on major subsidies, comprising food, fuel and fertilisers, moderated to 56.3 per cent of BE in H1:2024-25 from 55.1 per cent of BE in H1:2023-24, primarily attributable to lower y-o-y expenditure on nutrient based subsidy on account of a fall in international fertiliser prices (58.2 per cent of BE in H1:2024-25 vis-à-vis 95.9 per cent of BE in H1:2023-24). Food and fertiliser subsidies accounted for 56.6 per cent and 41.7 per cent of total outgo on major subsidies in H1:2024-25 vis-à-vis 46.1 per cent and 53.4 per cent, respectively, in the corresponding period of the previous year (Chart 11). 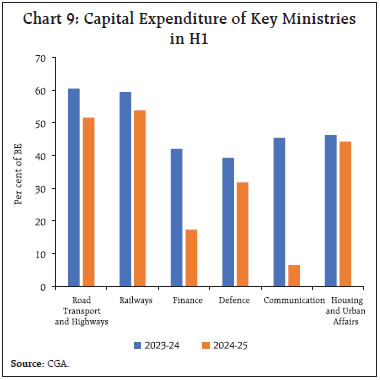
 India is transitioning from women’s development to women led development.13 The Centre’s expenditure for schemes for the welfare of women and empowerment of women has grown from ₹81,249 crore in 2015-16 to ₹3,27,158 crore in 2024-25 (BE). The share of the gender budget in the total Union Budget has increased to 6.8 per cent in 2024-25 (BE), the highest since the introduction of gender budget statements (GBS) in 2005-06 (Box B). 
Box B: Twenty Years of Gender Budgeting in India Gender budgeting utilises fiscal policy to promote gender equality and support the development of girls and women (IMF, 2016). It aids policy formulation by detailing gender responsiveness of budgetary practices. Gender budgets reflect policy efforts to promote gender equality - a recognised sustainable development goal (SDG). Ostry et al. (2018) estimated that removing barriers to female labour force participation could yield significant output and welfare gains. Since its initiation by Australia in 1984, gender budgeting has been adopted by over 100 countries (UN Women, 2023), exhibiting varied practices in origins, fiscal policy components, legal provisions, levels of governments involved, and the role of non-government organisations (Stotsky, 2016). South Africa, an early adopter in 1995, established Gender Responsive Planning, Budgeting, Monitoring, Evaluation and Auditing Framework (GRPBMEAF) in 2019, providing a legal basis for comprehensive institutional accountability to gender equality commitments and promoting gender responsive policy across all tiers of government. In Brazil, civil society has played a crucial role in enhancing government accountability towards gender sensitive budgeting (Raes, 2006). In China, few local governments have initiated the incorporation of gender budgeting as a public finance management tool (Alonso et al., 2021). Belgium legally mandates ministries to maintain sex-disaggregated data and develop gender indicators to track progress. Finland focuses on ex-ante analysis, requiring ministries to report the expected gender impact of budget proposals (Elomaki and Ylostalo, 2021). India introduced its first GBS in the Union Budget 2005-06 and established Gender Budgeting Cells across ministries in 2007 to promote and report gender-responsive practices. Odisha was the first State to adopt gender budgeting in 2004-05.14 During 2024-25, 11 States presented GBSs. Centre’s Gender Budget is classified into three parts: Part A comprises schemes with 100 per cent allocation to the welfare of women; Part B includes schemes where at least 30 per cent of allocations are directed towards women’s welfare; and Part C, introduced in 2024-25, encompasses schemes allocating less than 30 per cent towards women’s welfare. The share of gender budget in total expenditure increased from 4.5 per cent in 2014-15 to 6.8 per cent in 2024-25 (BE), with Part A schemes becoming increasingly significant. The sharp rise in average expenditure under Part A during 2021-25 is primarily driven by increased allocations towards the Pradhan Mantri Awaas Yojana and LPG connections for poor households. For 2024-25 (BE), ₹3.27 lakh crore has been allocated to the gender budget, marking an 18.9 per cent increase over the revised estimates for 2023-24 (Chart B.1a). Between 2022-23 to 2024-25, Part A primarily focused on housing, promoting self-employment, and providing clean cooking fuel to households. Among the 19 ministries in Part A, the top three - rural development (63.7 per cent); housing and urban affairs (23.3 per cent); and petroleum and natural gas (8.1 per cent) - account for over 95 per cent of the budgeted expenditure in 2024-25 (BE). Part B features more dispersed expenditure of around 27 ministries, focusing on education and health related expenditures, provision of clean drinking water, and livelihood security of rural women (Chart B.1b and c). Part C, introduced in 2024-25, consists of the Pradhan Mantri Kisan Samman Nidhi (PM-KISAN) with a budgeted outlay of ₹15,000 crore for the current financial year.  Gender budgeting has prompted changes in India’s fiscal policies for education, health, and infrastructure, advancing gender-oriented goals in India (Stotsky, 2016). A global survey identified India among 23 countries with prominent gender budgeting efforts (Stotsky, 2016). Establishing clear mechanisms to classify expenditures and transparent criteria to assign weights under the gender budget could further enhance transparency. Additionally, creating a legal provision, such as the Gender Budgeting Act proposed by the NITI Aayog in 2022, could provide a robust framework to guide these efforts. References Elomaki, A. and Ylostalo, H. (2021). Gender Budgeting in the Crossroad of Gender Policy and Public Financial Management: The Finnish case. Public Money and Management. Alonso, V. A., Curristine, T. R., Preston, G., Soler, A., Tchelishvili, N., Weerathunga, S. (2021). Gender Budgeting in G20 Countries. IMF Working Papers, 2021/269, International Monetary Fund. Stotsky, J. G. (2016). Gender Budgeting: Fiscal Context and Current Outcomes. IMF Working Paper, No. 16/149, July. Explainer: What is Gender Responsive Budgeting? (November 2023). UN Women. Ostry, J., Alvarez, J., Espinoza, R. and Papageorgiou, C. (2018). Economic Gains from Gender Inclusion: New Mechanisms, New Evidence. Staff Discussion Notes. Raes, F. (2006). What Can We Expect from Gender Sensitive Budgets? Strategies in Brazil and Chile in a Comparative Perspective’, Network Women in Development Europe – WIDE. | States’ revenue expenditure growth in Q1 and Q2 of 2024-25 at 8.9 per cent and 11.4 per cent, respectively, was higher than the growth registered in the corresponding quarters of 2023-24. States exhausted 41.6 per cent of their budgeted revenue expenditure in H1:2024-25 (41.3 per cent in H1:2023-24). On the other hand, their capital expenditure contracted by 6.9 per cent in H1:2024-25, with decline of 20.1 per cent in Q1:2024-25 and an increase of 1.8 per cent in Q2:2024-25 (Chart 12a and b). Greater focus on outcomes can enhance expenditure efficiency (Box C). 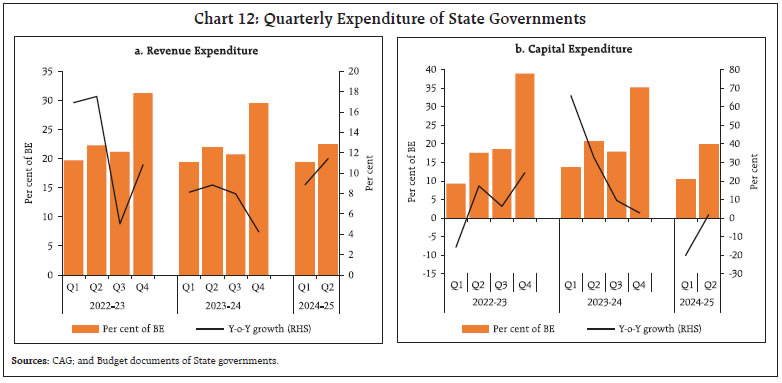
Box C: Outcome Budgeting for Enhanced Expenditure Effectiveness Social sector expenditure by Indian states has increased significantly from 5.4 per cent of GDP in 2005-06 to 8.1 per cent in 2024-25 (BE), with growing prioritisation of education, health, and other critical social services. However, the effectiveness of this spending depends on how well it translates into tangible outcomes. Ensuring ‘value for money’ from public resources is crucial for the sustainable development of any economy (Jena, 2013). The NITI Aayog and the Fourteenth and Fifteenth Finance Commissions advocated performance-linked budgeting to optimise resource utilisation (Kundu, 2024). Inter-State variations in the cost-effectiveness of social sector expenditure highlight the need for greater focus on outcomes. For instance, States with higher improvement in Human Development Index (HDI) with relatively lower spending are more cost-effective. The marginal returns on social sector spending, in terms of HDI improvement, vary significantly, ranging from 0.003 per cent to 0.102 per cent (per cent improvement in HDI index for a per cent increase in social sector expenditure) [Chart C.1a]. Similarly, increased spending on health does not uniformly translate into improved outcomes. For example, reductions in the Infant Mortality Rate (IMR) exhibit significant inter-State disparities in the marginal returns on health sector expenditure (Chart C.1b). These variations underscore the necessity of moving beyond budgetary outlays to focus on outcome-oriented public spending. Outcome Budgeting (OB) addresses this challenge by linking public expenditure to measurable developmental outputs and outcomes. Unlike traditional budgets that focus on inputs, OB emphasises results, fostering greater transparency, accountability, and alignment with developmental priorities. Introduced at the Union level in 2005, OB has since been adopted by 11 States (CBGA, 2021). The Development Monitoring and Evaluation Office (DMEO), an attached office of NITI Aayog has developed an Output-Outcome Monitoring Framework and several State governments have created their own outcome-based budgets. The implementation and the framework of outcome budgets varies across the States. However, challenges persist, including the need for capacity building, increased transparency, and enhanced monitoring mechanisms. 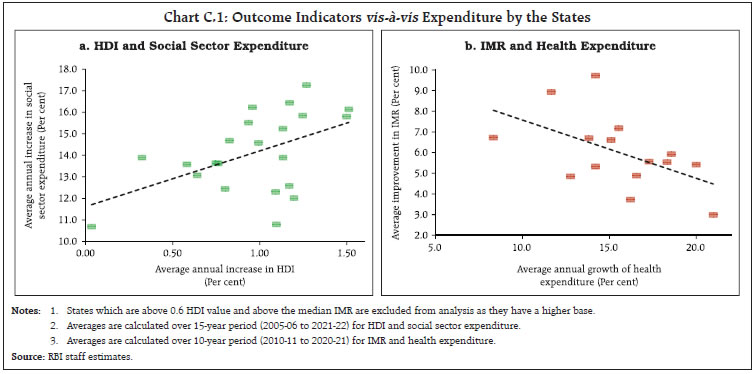 Scaling up OB across all States and sectors, aligning its frameworks with SDG benchmarks, and investing in robust data systems are critical for institutionalising expenditure efficiency. Additionally, capacity building at the district level and collaborative knowledge sharing among States can enhance the implementation and effectiveness of OB. Institutionalising OB across all the States may facilitate the achievement of sustainable development and maximising the impact of public spending. References Kundu, P. (2024). Issues and Trends in Public Expenditure. Economic and Political Weekly, Volume 59, Issue No. 33. August 17, 2024. Rawal, S and Gupta, M. (2024). Need for SDG-linked outcome budgeting in India: A case of Assam. Down to Earth, February 21, 2024. Jena, P.R. (2013) Improving Public Financial Management in India: Opportunities to Move Forward, NIPFP Working Paper No 2013–123, April. CBGA (2021). Outcome Budgeting in India: The Efforts being made at the Union and State Levels. Centre for Budget and Governance Accountability (CBGA). | III. Fiscal Deficit and its Financing Central Government a. Fiscal Deficit The Union government budgeted for a GFD of 4.9 per cent of GDP in 2024-25 as compared with 5.6 per cent in 2023-24 (PA), in line with the glide path to achieve medium term GFD target of below 4.5 per cent of GDP by 2025-26. During H1:2024-25, GFD of the Union government stood at 29.4 per cent of the BE, down from 39.3 per cent during the corresponding period of 2023-24, and the proportion was at its lowest in a decade (Chart 13a and b). Similar reductions were seen in revenue deficit and primary deficit in H1:2024-25. b. Financing of GFD In H1:2024-25, the Union government completed 52.8 per cent of the budgeted market borrowings for 2024-25, which financed the major chunk of its GFD during the first half of the year. The government has decided to adhere to its borrowing target for H2:2024-25.
State Government a. Fiscal Deficit The States had budgeted a consolidated GFD of 3.2 per cent of GDP for 2024-25, as against 2.9 per cent in 2023-24 (PA). During 2024-25, the States have exhausted a lower proportion of their budgeted GFD in Q1 and Q2 compared to the previous year. Correspondingly, the fiscal space available to States in the latter half of 2024-25 is 56.1 per cent of their budgeted GFD, above 55.6 per cent for the corresponding period of the previous year (Chart 14a and b). The revenue expenditure to capital outlay (RECO) ratio of the Centre rose to 4.7 in H1:2024-25 from 3.9 a year ago, given the contraction in capital outlay. During the same period, the ratio for States also rose to 8.3 from 6.6 (Chart 15a and b).
b. Financing of GFD The net market borrowings by States during H1:2024-25 registered a growth of 13.2 per cent over the same period in the previous year. During this period, States utilised 32.1 per cent of their budgeted net market borrowings (32.2 per cent in the corresponding period of 2023-24). Thirteen States utilised a higher proportion of their budgeted net borrowings compared to the same period in the previous year. Gross market borrowings increased by 7.7 per cent over the previous year, representing 34.5 per cent of the budgeted amount (Chart 16a and b). The financial accommodation availed by States through various facilities provided by the Reserve Bank increased by 36.6 per cent in H1:2024-25 over the corresponding period in the previous year. The ways and means advances (WMA) limits were revised effective July 1, 2024. The aggregate WMA limit for States/UTs now stands at ₹60,118 crore, an increase of 27.9 per cent over the earlier limit of ₹47,010 crore. Consequently, States utilised 9.6 per cent of the permissible WMA limit in Q1:2024-25 and 8.8 per cent in Q2. The average utilisation by States under WMA and the special drawing facility (SDF) rose by 21.9 per cent and 45.1 per cent, respectively, while the usage under the overdraft (OD) facility increased by 9.8 per cent in H1:2024-25 (Chart 17a and b). IV. General Government Finances The GFD for the general government (Centre and States combined) is budgeted lower at 7.6 per cent of the GDP in 2024-25 (BE) from 9.0 per cent of GDP in 2023-24 (RE). In Q1:2024-25, the GFD-GDP ratio was lower on account of muted growth in total expenditure of the Centre and States along with robust tax collection. As the expenditure of the Centre and States picked up in Q2:2024-25, the GFD-GDP ratio increased in line with its previous trends (Chart 18).
V. Conclusion The Centre recorded higher tax collections, both direct and indirect, and the buoyancy is expected to continue. Non-tax revenues of the Centre were boosted by the large surplus transfer by the Reserve Bank. The government spending, both Centre and States, was dampened in H1:2024-25 reflecting, inter alia, the impact of model code of conduct for general elections and is expected to pick up pace in H2:2024-25. Overall, the Centre has achieved more than half of its budgeted revenue in H1:2024-25 while containing its expenditure to less than half of what it had projected for the entire financial year. This augurs well for the Centre to meet its GFD target of 4.9 per cent of GDP for 2024-25. Several States have announced sops in their 2024-25 Budgets including free electricity to agriculture and households, free transport, allowances to unemployed youth and monetary assistance to women. Such spending may divert resources away from critical social and economic infrastructure development.
Appendix Tables | Table I: Budgetary Position of the Central Government during April-September | | Item | (₹ thousand crore) | (Per cent) | | Actuals | Budget Estimates | Percent of BE | Y-o-Y Growth Rate | | 2024-25 | 2023-24 | 2024-25 | 2023-24 | 2024-25 | 2023-24 | 2024-25 | 2023-24 | | (1) | (2) | (3) | (4) | (5) | (6) | (7) | (8) | (9) | | 1. Revenue Receipts | 1622.4 | 1397.1 | 3129.2 | 2632.3 | 51.8 | 53.1 | 16.1 | 19.5 | | 1.1. Net Tax Revenue | 1265.2 | 1160.3 | 2583.5 | 2330.6 | 49.0 | 49.8 | 9.0 | 14.7 | | 1.2. Non-Tax Revenue | 357.2 | 236.8 | 545.7 | 301.7 | 65.5 | 78.5 | 50.9 | 50.2 | | 1.3. Interest Receipts | 20.4 | 17.3 | 38.2 | 24.8 | 53.3 | 69.7 | 17.6 | 38.7 | | 2. Capital Receipts | 14.6 | 20.2 | 78.0 | 84.0 | 18.7 | 24.0 | -27.6 | -41.0 | | 2.1. Recovery of Loans | 11.4 | 13.2 | 28.0 | 23.0 | 40.8 | 57.5 | -13.5 | 37.7 | | 2.2. Other Receipts | 3.2 | 7.0 | 50.0 | 61.0 | 6.3 | 11.4 | -54.4 | -71.7 | | 3. Total Receipts (1+2) | 1637.0 | 1417.3 | 3207.2 | 2716.3 | 51.0 | 52.2 | 15.5 | 17.7 | | 4. Revenue Expenditure | 1696.5 | 1628.5 | 3709.4 | 3502.1 | 45.7 | 46.5 | 4.2 | 10.0 | | of which | | | | | | | | | | (i) Interest Payments | 515.0 | 484.3 | 1162.9 | 1080.0 | 44.3 | 44.8 | 6.3 | 10.9 | | 5. Capital Expenditure | 415.0 | 490.6 | 1111.1 | 1001.0 | 37.3 | 49.0 | -15.4 | 43.1 | | of which | | | | | | | | | | (i) Loans and Advances | 55.4 | 74.8 | 192.4 | 163.8 | 28.8 | 45.7 | -25.9 | 217.5 | | 6. Total Expenditure (4+5) | 2111.5 | 2119.1 | 4820.5 | 4503.1 | 43.8 | 47.1 | -0.4 | 16.2 | | 7. Revenue Deficit (4-1) | 74.2 | 231.4 | 580.2 | 869.9 | 12.8 | 26.6 | -68.0 | -25.6 | | 8. Fiscal Deficit (6-3) | 474.5 | 701.9 | 1613.3 | 1786.8 | 29.4 | 39.3 | -32.4 | 13.2 | | 9. Gross Primary Deficit {8-4 (i)} | -40.5 | 217.5 | 450.4 | 706.8 | -9.0 | 30.8 | -118.6 | 18.8 | | Source: Office of Controller General of Accounts, Ministry of Finance, Government of India. |
| Table II: Quarterly Position of Central Government Finances | | Item | (₹ thousand crore) | (Per cent) | | Actuals | Per cent of BE | Y-o-Y Growth Rate | | Q1 | Q2 | Q1 | Q2 | 2024-25 | | 2024-25 | 2023-24 | 2024-25 | 2023-24 | 2024-25 | 2023-24 | 2024-25 | 2023-24 | Q1 | Q2 | | (1) | (2) | (3) | (4) | (5) | (6) | (7) | (8) | (9) | (10) | (11) | | 1. Revenue Receipts | 829.7 | 588.6 | 792.7 | 808.5 | 26.5 | 22.4 | 25.3 | 30.7 | 41.0 | -2.0 | | 1.1. Net Tax Revenue | 549.6 | 433.6 | 715.5 | 726.7 | 21.3 | 18.6 | 27.7 | 31.2 | 26.8 | -1.5 | | 1.2. Non-Tax Revenue | 280.0 | 155.0 | 77.2 | 81.8 | 51.3 | 51.4 | 14.1 | 27.1 | 80.7 | -5.7 | | 1.3. Interest Receipts | 11.7 | 9.5 | 8.6 | 7.8 | 30.6 | 38.5 | 22.6 | 31.3 | 22.7 | 11.3 | | 2. Capital Receipts | 4.5 | 10.7 | 10.1 | 9.5 | 5.8 | 12.7 | 12.9 | 11.3 | -57.8 | 6.5 | | 2.1. Recovery of Loans | 4.5 | 6.5 | 6.9 | 6.7 | 16.1 | 28.1 | 24.7 | 29.3 | -30.2 | 2.5 | | 2.2. Other Receipts | 0.0 | 4.2 | 3.2 | 2.7 | 0.0 | 6.9 | 6.3 | 4.5 | -99.9 | 16.5 | | 3. Total Receipts (1+2) | 834.2 | 599.3 | 802.8 | 818.0 | 26.0 | 22.1 | 25.0 | 30.1 | 39.2 | -1.9 | | 4. Revenue Expenditure | 788.9 | 772.2 | 907.7 | 856.3 | 21.3 | 22.0 | 24.5 | 24.5 | 2.2 | 6.0 | | of which | | | | | | | | | | | | (i) Interest Payments | 264.1 | 243.7 | 251.0 | 240.6 | 22.7 | 22.6 | 21.6 | 22.3 | 8.3 | 4.3 | | 5. Capital Expenditure | 181.1 | 278.5 | 233.9 | 212.1 | 16.3 | 27.8 | 21.1 | 21.2 | -35.0 | 10.3 | | of which | | | | | | | | | | | | (i) Loans and Advances | 30.0 | 44.6 | 25.4 | 30.2 | 15.6 | 27.2 | 13.2 | 18.4 | -32.7 | -16.0 | | (ii) Capital Outlay | 151.0 | 233.9 | 208.5 | 181.9 | 16.4 | 27.9 | 22.7 | 21.7 | -35.4 | 14.6 | | 6. Total Expenditure (4+5) | 969.9 | 1050.7 | 1141.6 | 1068.5 | 20.1 | 23.3 | 23.7 | 23.7 | -7.7 | 6.8 | | 7. Revenue Deficit (4-1) | -40.8 | 183.6 | 115.0 | 47.8 | -7.0 | 21.1 | 19.8 | 5.5 | -122.2 | 140.5 | | 8. Fiscal Deficit (6-3) | 135.7 | 451.4 | 338.8 | 250.5 | 8.4 | 25.3 | 21.0 | 14.0 | -69.9 | 35.3 | | 9. Gross Primary Deficit {8-4 (i)} | -128.3 | 207.7 | 87.9 | 9.9 | -28.5 | 29.4 | 19.5 | 1.4 | -161.8 | 790.3 | | Source: Office of Controller General of Accounts, Ministry of Finance, Government of India. |
| Table III: Budgetary Position of the State Governments during April-September | | Item | (₹ thousand crore) | (Per cent) | | Actuals | Budget Estimates | Per cent of BE | Y-o-Y Growth Rate | | 2024-25 | 2023-24 | 2024-25 | 2023-24 | 2024-25 | 2023-24 | 2024-25 | 2023-24 | | (1) | (2) | (3) | (4) | (5) | (6) | (7) | (8) | (9) | | 1. Revenue Receipts | 1508.4 | 1403.2 | 3869.1 | 3573.7 | 39.0 | 39.3 | 7.5 | 7.1 | | 1.1. Tax Revenue | 1292.7 | 1156.6 | 3044.1 | 2686.9 | 42.5 | 43.0 | 11.8 | 14.6 | | 1.2. Non-Tax Revenue | 83.9 | 91.3 | 276.8 | 245.5 | 30.3 | 37.2 | -8.1 | 18.5 | | 1.3. Grants-in-aid and Contributions | 131.8 | 155.2 | 548.2 | 641.2 | 24.0 | 24.2 | -15.1 | -30.7 | | 2. Capital Receipts | 2.4 | 3.3 | 25.8 | 24.2 | 9.3 | 13.6 | -27.3 | 16.9 | | 2.1. Recovery of Loans and Advances | 2.3 | 3.2 | 20.2 | 17.8 | 11.5 | 18.0 | -27.6 | 17.8 | | 2.2. Other Receipts | 0.1 | 0.1 | 5.6 | 6.4 | 1.2 | 1.3 | -16.6 | -9.5 | | 3. Total Receipts | 1510.8 | 1406.5 | 3894.9 | 3597.9 | 38.8 | 39.1 | 7.4 | 7.1 | | 4. Revenue Expenditure | 1681.0 | 1525.0 | 4038.9 | 3695.9 | 41.6 | 41.3 | 10.2 | 8.5 | | 4.1 Interest Payments | 220.8 | 194.1 | 503.2 | 459.2 | 43.9 | 42.3 | 13.7 | 12.5 | | 5. Capital Expenditure | 233.8 | 251.1 | 777.2 | 734.9 | 30.1 | 34.2 | -6.9 | 44.4 | | 5.1 Capital Outlay | 202.5 | 230.3 | 706.1 | 658.9 | 28.7 | 34.9 | -12.1 | 51.5 | | 6. Total Expenditure | 1914.8 | 1776.1 | 4816.1 | 4430.8 | 39.8 | 40.1 | 7.8 | 12.5 | | 7. Revenue Deficit (4-1) | 172.6 | 121.8 | 169.7 | 122.3 | 101.7 | 99.6 | 41.7 | 27.5 | | 8. Fiscal Deficit (6-3) | 404.0 | 369.6 | 921.2 | 833.0 | 43.9 | 44.4 | 9.3 | 38.6 | | 9. Gross Primary Deficit (8 - 4.1) | 183.2 | 175.5 | 418.0 | 373.8 | 43.8 | 46.9 | 4.4 | 86.7 | Note: Data pertains to 22 States.
Sources: Comptroller and Auditor General of India; and Budget documents of the States. |
| Table IV: Quarterly Position of State Government Finances | | Item | (₹ thousand crore) | (Per cent) | | Actuals | Budget Estimates | Y-o-Y Growth Rate | | Q1 | Q2 | Q1 | Q2 | 2024-25 | | 2024-25 | 2023-24 | 2024-25 | 2023-24 | 2024-25 | 2023-24 | 2024-25 | 2023-24 | Q1 | Q2 | | (1) | (2) | (3) | (4) | (5) | (6) | (7) | (8) | (9) | (10) | (11) | | 1. Revenue Receipts | 736.7 | 722.8 | 771.7 | 680.4 | 19.0 | 20.2 | 19.9 | 19.0 | 1.9 | 13.4 | | 1.1. Tax Revenue | 652.7 | 560.5 | 640.0 | 596.1 | 21.4 | 20.9 | 21.0 | 22.2 | 16.4 | 7.4 | | 1.2. Non-Tax Revenue | 40.5 | 35.9 | 43.4 | 55.4 | 14.6 | 14.6 | 15.7 | 22.6 | 12.8 | -21.7 | | 1.3. Grants-in-aid and Contributions | 43.4 | 126.4 | 88.3 | 28.9 | 7.9 | 19.7 | 16.1 | 4.5 | -65.6 | 206.0 | | 2. Capital Receipts | 1.2 | 1.7 | 1.2 | 1.6 | 4.6 | 6.8 | 4.6 | 6.7 | -27.5 | -27.1 | | 2.1. Recovery of Loans and Advances | 1.2 | 1.6 | 1.2 | 1.6 | 5.8 | 8.9 | 5.7 | 9.0 | -26.9 | -28.3 | | 2.2. Other Receipts | 0.0 | 0.1 | 0.0 | 0.0 | 0.6 | 1.0 | 0.6 | 0.3 | -45.3 | 67.8 | | 3. Total Receipts | 737.9 | 724.5 | 772.9 | 682.0 | 18.9 | 20.1 | 19.8 | 19.0 | 1.9 | 13.3 | | 4. Revenue Expenditure | 776.3 | 713.1 | 904.7 | 811.9 | 19.2 | 19.3 | 22.4 | 22.0 | 8.9 | 11.4 | | 4.1 Interest Payments | 95.3 | 80.8 | 125.5 | 113.3 | 18.9 | 17.6 | 24.9 | 24.7 | 17.9 | 10.8 | | 5. Capital Expenditure | 79.7 | 99.7 | 154.1 | 151.4 | 10.3 | 13.6 | 19.8 | 20.6 | -20.1 | 1.8 | | 5.1. Capital Outlay | 68.5 | 88.5 | 134.0 | 141.8 | 9.7 | 13.4 | 19.0 | 21.5 | -22.6 | -5.5 | | 6. Total Expenditure | 855.9 | 812.8 | 1058.8 | 963.3 | 17.8 | 18.3 | 22.0 | 21.7 | 5.3 | 9.9 | | 7. Revenue Deficit | 39.6 | -9.7 | 133.0 | 131.5 | 23.3 | -8.0 | 78.3 | 107.6 | -506.8 | 1.1 | | 8. Fiscal Deficit (6-3) | 118.1 | 88.3 | 285.9 | 281.3 | 12.8 | 10.6 | 31.0 | 33.8 | 33.7 | 1.7 | | 9. Gross Primary Deficit (8 - 4.1) | 22.8 | 7.5 | 160.4 | 168.0 | 5.4 | 2.0 | 38.4 | 44.9 | 203.7 | -4.5 | Note: Data pertains to 22 States.
Sources: Comptroller and Auditor General of India; and Budget documents of the States. |
|