Households are the main suppliers of the financial resources to other sectors of the economy. Consequently, movement in financial assets and liabilities of households can provide an understanding of the dynamics of growth in the Indian economy. This article updates the March 2018 pilot exercise and consolidates information on households’ financial assets and liabilities for twelve quarters extending to March 2020. Both financial assets and liabilities of households remain bank-centric, with some shift in favour of mutual funds and insurance in recent quarters. Introduction In India, the household sector contributes around 60 per cent of gross savings in the Indian economy, and thus remains the major supplier of financial resources for gross investment. Annual data on household saving are published by the National Statistical Office (NSO), with the latest annual estimates released on January 31, 20201 showing that financial saving of the household sector declined to 6.5 per cent of GDP in 2018-19 from 7.7 per cent in 2017-18 and 7.4 per cent in 2016-17. Data for 2019-20 would be available on January 29, 2021. Annual information on financial assets and liabilities of the household sector was published in the July 2019 issue of the RBI Bulletin2 on an instrument wise ‘from whom to whom’ basis. For the first time, this article provides quarterly data up to March 2020, bridging the 10 months lag in the availability of official annual estimates of household financial saving. Data relating to the overlap period - Q1 and Q2:2017-18 - have been revised to incorporate the latest available information. With this release, India joins a select band of countries that publish household savings on a quarterly basis3. The rest of the article is divided into three sections. Section II discusses estimates of quarterly financial assets and liabilities of the household sector at the aggregate level. Section III examines the instrument-wise composition of financial assets and liabilities. Section IV sets out concluding remarks. Methodology, data sources/limitations and a tabular presentation of instrument-wise estimates of household financial assets and liabilities are given in the Annex. II. Financial Assets and Liabilities of Households Net financial assets of Indian households moderated in 2018-194, reflecting higher consumption expenditure by households. In 2019-20, however, they have gathered pace touching the levels reached in 2017-18, i.e., 7.7 per cent of GDP (Table 1). This improvement has occurred due to moderation in household bank borrowings being sharper than that in bank deposits, except in the fourth quarter of 2019-20 due to COVID-19 related economic disruptions. The quarterly data also reveal large fluctuations in the flow of resources from this sector which are not captured in the annual data (Chart 1). Households’ gross financial liabilities turned negative in Q1:2019-20 owing mainly to contraction in borrowings from commercial banks, but picked up thereafter and peaked in Q4:2019-20, reflecting apart from the seasonal uptick, higher borrowings induced by COVID-19 related hardships. Several studies show that households tend to save more during a slowdown and income uncertainty [Mody et al., 2012; Chakrabarti et al., 2011; Nahmias, 2010; Levanon and Franco, 2011]. | Table 1: Financial Assets and Liabilities of Households | | (Amount in ₹ lakh crore) | | | 2017-18 | 2018-19 | 2019-20 | | Q1 | Q2 | Q3 | Q4 | Annual | Q1 | Q2 | Q3 | Q4 | Annual | Q1 | Q2 | Q3 | Q4 | Annual | | Net Financial Assets (A-B) | 2.78 | 3.59 | 2.48 | 4.45 | 13.29 | 2.76 | 2.29 | 2.13 | 6.56 | 13.73 | 3.48 | 3.68 | 3.36 | 5.09 | 15.62 | | | (6.9) | (8.6) | (5.7) | (9.7) | (7.7) | (6.1) | (4.9) | (4.4) | (13.2) | (7.2) | (7.1) | (7.5) | (6.5) | (9.6) | (7.7) | | A. Gross Financial Assets | 3.85 | 5.77 | 3.42 | 7.56 | 20.60 | 3.58 | 4.82 | 3.52 | 9.31 | 21.23 | 3.31 | 5.06 | 5.52 | 7.73 | 21.63 | | | (9.6) | (13.8) | (7.9) | (16.5) | (12.0) | (7.9) | (10.4) | (7.3) | (18.8) | (11.1) | (6.7) | (10.3) | (10.7) | (14.5) | (10.6) | | B. Financial Liabilities | 1.08 | 2.18 | 0.94 | 3.11 | 7.31 | 0.83 | 2.53 | 1.38 | 2.75 | 7.50 | -0.18 | 1.38 | 2.16 | 2.64 | 6.01 | | | (2.7) | (5.2) | (2.2) | (6.8) | (4.2) | (1.8) | (5.5) | (2.9) | (5.6) | (3.9) | (-0.4) | (2.8) | (4.2) | (5.0) | (2.9) | Note: (i) Figures in parenthesis are as per cent to GDP.
(ii) Data for Q1 and Q2:2017-18 stand revised from those published in RBI Bulletin, March 2018.
Source: Staff calculations. | III. Instrument-wise Portfolio of Household Financial Assets and Liabilities Households allocate their financial assets and liabilities among various instruments involving varying degrees of liquidity and risk. Financial assets are held in currency, bank deposits, debt securities, mutual funds, insurance, pension funds and small savings. Financial liabilities are primarily held in the form of loans and borrowings from banks, non-banking financial companies (NBFCs) and housing finance companies (HFCs). III.1 Household Assets Currency and deposits with banks accounted for bulk of total financial assets (66 per cent), followed by insurance funds and mutual funds (Chart 2). The trends in the composition of outstanding financial assets of households in terms of select instruments, viz., currency, commercial bank deposits, cooperative bank deposits, life insurance funds and mutual funds provide some interesting insights (Annex II; Table 3). Deposits with banks, which had declined persistently starting from Q3:2016-17, recorded an uptick starting from Q4:2018-19 as banks competed aggressively to raise resources, especially private banks (RBI, 2019a). The steady increase in insurance and mutual fund products pointed to a growing appetite for alternative financial instruments. The share of currency in total outstanding assets has broadly remained constant. 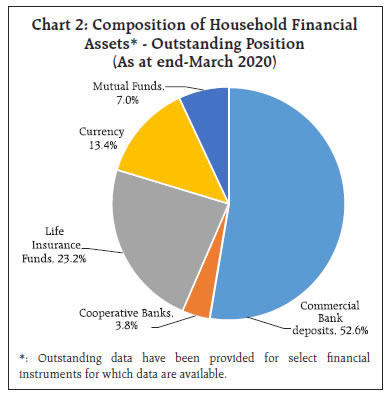 A clear seasonal pattern is discernible in at least two financial assets, namely, bank deposits and currency (Chart 3). Deposits with the banking system typically contract in the first quarter and expand in the last quarter of the financial year, while currency holdings of households peak in the first quarter and contract in the second quarter. Banks tend to boost credit delivery and deposit mobilisation in the last quarter of the financial year, i.e. they window dress5 to meet the year-end targets6 and to improve their asset quality indicators (RBI, 2013b; Rajpathak, 2019). Currency patterns are associated with festivals, rabi procurement and kharif sowing, and tourism related demand (RBI, 2019c). Moderate seasonality is also seen in insurance products - peaks in the fourth quarter to get income deductions. III.2 Household Liabilities Borrowings from commercial banks have the highest share in households’ financial liabilities. At the end of Q4:2019-20, outstanding loans availed by households from commercial banks accounted for the bulk of their total financial liabilities (75.9 per cent), followed by the HFCs, NBFCs, cooperative banks and credit societies (Chart 4). Acquisition of financial liabilities also reveals a seasonal pattern; they generally peak during the fourth quarter and then moderate in the first quarter - by and large, an outcome of seasonality in the disbursement of credit by the banking sector, as discussed in the previous section. Borrowings by households from NBFCs, which contracted during Q3:2018-19 due to the liquidity strains triggered by the Infrastructure Leasing and Financial Services Limited (IL&FS) crisis, rebounded in subsequent quarters (Chart 5). The contraction of loans from HFCs during Q3:2019-20 points to depressed demand for real estate, which is also evident in moderation of real estate housing sales. Acquisition of liabilities in the form of bank credit contracted to 1.5 per cent of GDP in Q1:2019-20 followed by an uptick in the subsequent quarters of the year. The significant contraction in the households borrowing from the banking sector in Q1:2019-20 caused by the seasonal factors, seems to have got accentuated by uncertainty about future income growth in a slowing economy, and also due to growing risk aversion among banks in view of asset quality concerns. IV. Conclusion The household sector is the most sustainable and self-reliant source of financing for the Indian economy. Its role is likely to become critical in the context of the policy effort gathering critical mass to lift the Indian economy from the vice-like grip of a slowdown and, more recently the life-threatening COVID-19 pandemic. Households continue to rely heavily on the banking sector for borrowing and investing their surpluses, although the share of bank deposits in their financial assets has undergone a secular decline. A recent shift is visible in favour of financial assets in mutual funds and insurance. On the liabilities side, a significant decline in the share of borrowings from the banking sector in total liabilities during 2019-20 reflected the economic slowdown and risk aversion of banks. COVID-19 related uncertainties, have resulted in an outflow from mutual funds and a flight to currency holdings. Going forward, a spike in net financial assets of households is likely in the first quarter of 2020-21 on account of a sharp drop in lockdown induced consumption. Lags in the pickup of economic activity may cause the financial surplus of households to taper off in subsequent quarters. With construction activity at a standstill, there is a possibility of a shift by households from physical to financial assets. References Chakrabarti, Rajashri, Donghoon Lee, Wilbert van der Klaauw, and Basit Zafar (2011), “Household Debt and Saving During The 2007 Recession”, NBER Working Paper Series, National Bureau of Economic Research, April 2011. Das, M. R. (2012), “Window-dressing of Deposits By Banks: Some Truths”, Business Standard, September 13, 2012, https://www.thehindubusinessline.com/money-and-banking/Window-dressing-of-deposits-by-banks-Some-truths/article20505189.ece FSB (2018), “Financial Crisis and Information Gaps, Second Phase of the G20 Data Gaps Initiative (DGI-2) Third Progress Report” International Monetary Fund and Financial Stability Board. Government of India (2018), “Report of the Committee on Financial Sector Statistics”, Central Statistical Organisation, Ministry of Statistics & Programme and Implementation, Government of India. Levanon, Gad and Lynn Franco (2011), “The Great Recession and Household Savings”, The Conference Board, February 2011. Mody, Ashoka, Franziska Ohnsorge and Damiano Sandri (2012), “Precautionary Savings in the Great Recession”, IMF Working Paper, WP/12/42, February 2012. Nahmias, Laurent (2010), “The Financial Crisis and Household Savings Behaviour in France”, Economic Research – BNP PARIBAS, France. OECD (2017), “Understanding Financial Accounts”, Edited by Peter Van De Ven and Daniele Fano, OECD Publishing, Paris. Prakash, Anupam, Avdhesh Kumar Shukla, Anand Prakash Ekka and Kunal Priyadarshi (2018), “Quarterly Estimates of Households’ Financial Assets and Liabilities”, RBI Bulletin, March 2018. Prakash, Anupam, Avdhesh Kumar Shukla, Anand Prakash Ekka, Kunal Priyadarshi and Chaitali Bhowmick (2019), “Financial Stocks and Flows of the Indian Economy 2011-12 to 2017-18”, RBI Bulletin, July 2019. Rajpathak, Rajashree, Sanjay Singh and Srijashree Sardar (2019), “Seasonality in India’s Key Economic Indicators”, RBI Bulletin, March 2019. Rangarajan, C. (2009), “Report of the High Level Committee on Estimation of Savings and Investment”, Reserve Bank of India. RBI (2019a), “Report on Trend and Progress of Banking in India 2018-19”, Reserve Bank of India. ___ (2013b), “Financial Stability Report”, Reserve Bank of India, June, 2013 ___ (2019c), “Annual Report 2018-19”, Reserve Bank of India. ___ (2019d), “Reserve Bank of India Imposes Monetary Penalty on Indian Bank”, Press Release, Reserve Bank of India, November 20, 2019. Rebello, Joel (2019), “In Deposit War, Private Sector Banks Win Hands Down”, The Economic Time, February 27, 2019, https://economictimes.indiatimes.com/industry/banking/finance/banking/in-deposit-war-private-banks-win-hands-down/articleshow/68177391.cms?from=mdr
Annex I
Data Sources and Methodology From a statistical point of view, it is important to note that data on households are derived from a horizontal balancing procedure (OECD 2017). In this process, data of households are based on information available in counterparty sectors. For example, data of households loan liability are derived from information available from balance sheet of other institutions such as commercial banks, NBFCs, insurance companies, general government sector and non-financial corporates (Table A). This procedure is generally used across countries in the absence of adequate coverage and non-availability of requisite data at regular frequencies from household surveys. As pointed out by the OECD “fully capturing financial and non-financial behavior of households via surveys is not straight forward, whereas counterparty information is usually well defined and well observed” (OECD, 2017). | Table A: Summary of Data Sources for Financial Assets and Liabilities | | Financial Assets | | Instrument | Definition | Assets | | Currency | Currency issued by the RBI | Residual item estimated following Rangrajan (2009) | | Deposits | Current, saving and time deposits regardless of maturity | Counterpart data from commercial banks, co-operative banks, NBFCs, HFCs, etc. | | Debt securities, listed shares, mutual fund units | Debt securities comprise commercial papers, treasury securities, government bonds, publicly issued debentures by financial and non-financial corporates, shares issued by financial and non-financial corporation through public issues | Reports of the Reserve Bank of India and Securities Exchange Board of India. Prospectus and issue related documents | | Life insurance | Actuarial reserves and other technical reserves for entitlements relating to individual life insurance policies | Data from insurance companies and public disclosure statements | | Pension / provident funds | Entitlements relating to funded retirement benefits for government sector and non-government sector employees | Government budget documents, reports of employee provident funds organization, pension fund regulatory and development authority, and other pension provident fund trust | | Liabilities | | Loans | Housing loans, consumer loans, crop loans and business loans from financial institutions, viz., commercial banks, credit societies, NBFCs, HFCs etc. | Counterparty information reported in various annual and quarterly reports of the Reserve Bank and National Housing Bank | | Trade credits | Net trade payables | Reports of non-financial corporate sector | | Note: In addition to above instruments, Indian households may also own financial assets, viz., financial derivatives, loans and trade credit to trading counterparts, and financial liabilities, viz., trade credit from non-corporate sector. We have not discussed these instruments due to paucity of data. |
Annex II | Table 1: Gross Financial Assets of Households | | (As per cent of GDP) | | Item | 2017-18 | 2018-19 | 2019-20 | | Q1 | Q2 | Q3 | Q4 | Annual | Q1 | Q2 | Q3 | Q4 | Annual | Q1 | Q2 | Q3 | Q4 | Annual | | Gross Financial Assets | 9.6 | 13.8 | 7.9 | 16.5 | 12.0 | 7.9 | 10.4 | 7.3 | 18.8 | 11.1 | 6.7 | 10.3 | 10.7 | 14.5 | 10.6 | | of which: | | | | | | | | | | | | | | | | | 1. Total Deposits (a)+(b) | -1.6 | 5.9 | -1.2 | 8.6 | 2.9 | -1.2 | 6.5 | 0.5 | 10.2 | 4.0 | -0.7 | 5.9 | 2.1 | 7.1 | 3.6 | | (a) Bank Deposits | -1.8 | 5.9 | -1.4 | 8.6 | 2.8 | -1.4 | 6.3 | 0.3 | 10.2 | 3.8 | -1.0 | 5.6 | 2.0 | 7.2 | 3.4 | | i. Commercial Bank Deposits | -1.5 | 5.7 | -1.5 | 8.6 | 2.8 | -1.4 | 6.2 | 0.2 | 9.9 | 3.7 | -1.1 | 5.5 | 1.2 | 7.1 | 3.2 | | ii. Cooperative Banks | -0.3 | 0.2 | 0.1 | 0.1 | 0.0 | -0.1 | 0.1 | 0.0 | 0.3 | 0.1 | 0.0 | 0.1 | 0.8 | 0.1 | 0.3 | | (b) Non-Bank Deposits | 0.2 | 0.1 | 0.2 | 0.0 | 0.1 | 0.2 | 0.2 | 0.2 | 0.1 | 0.2 | 0.4 | 0.3 | 0.1 | 0.0 | 0.2 | | 2. Life Insurance Funds | 1.9 | 2.3 | 3.1 | 0.9 | 2.0 | 1.5 | 2.1 | 1.1 | 3.1 | 1.9 | 2.0 | 0.8 | 2.1 | 1.8 | 1.7 | | 3. Provident and Pension Funds (including PPF) | 2.3 | 2.2 | 2.1 | 2.1 | 2.2 | 2.2 | 2.1 | 2.1 | 2.1 | 2.1 | 2.2 | 2.2 | 2.1 | 2.1 | 2.2 | | 4. Currency | 4.8 | 1.0 | 2.6 | 3.0 | 2.8 | 2.5 | -0.7 | 2.1 | 1.9 | 1.5 | 1.3 | -0.5 | 1.7 | 3.0 | 1.4 | | 5. Investments | 1.3 | 1.5 | 0.4 | 1.1 | 1.1 | 1.7 | -0.8 | 0.5 | 0.3 | 0.4 | 0.6 | 0.5 | 1.3 | -0.8 | 0.4 | | of which: | | | | | | | | | | | | | | | | | Mutual Funds | 1.2 | 1.3 | 0.0 | 0.8 | 0.8 | 1.5 | -1.0 | 0.4 | 0.2 | 0.3 | 0.2 | 0.4 | 1.3 | -0.9 | 0.2 | | 6. Small Savings (excluding PPF) | 1.0 | 0.9 | 0.9 | 0.8 | 0.9 | 1.1 | 1.1 | 1.1 | 1.0 | 1.1 | 1.4 | 1.4 | 1.3 | 1.3 | 1.3 | | Source: Staff calculations. |
| Table 2: Gross Financial Liabilities of Households | | (As per cent of GDP) | | Item | 2017-18 | 2018-19 | 2019-20 | | Q1 | Q2 | Q3 | Q4 | Annual | Q1 | Q2 | Q3 | Q4 | Annual | Q1 | Q2 | Q3 | Q4 | Annual | | Gross Financial Liabilities | 2.7 | 5.2 | 2.2 | 6.8 | 4.2 | 1.8 | 5.5 | 2.9 | 5.6 | 3.9 | -0.4 | 2.8 | 4.2 | 5.0 | 2.9 | | Loans (Borrowings) from | | | | | | | | | | | | | | | | | A. Financial Corporations (i+ii) | 2.7 | 5.2 | 2.2 | 6.8 | 4.2 | 1.8 | 5.5 | 2.9 | 5.6 | 3.9 | -0.4 | 2.8 | 4.2 | 5.0 | 2.9 | | (i) Banking Sector | 0.7 | 3.8 | 0.9 | 5.7 | 2.8 | 1.0 | 3.7 | 2.9 | 4.7 | 3.1 | -0.8 | 2.4 | 3.9 | 0.0 | 1.4 | | of which: | | | | | | | | | | | | | | | | | Commercial Banks | 0.7 | 3.8 | 0.9 | 5.5 | 2.7 | 0.9 | 3.7 | 2.9 | 4.5 | 3.0 | -1.5 | 2.3 | 3.4 | 4.9 | 2.3 | | (ii) Other Financial Institutions | 2.0 | 1.4 | 1.2 | 1.1 | 1.4 | 0.8 | 1.8 | -0.1 | 0.9 | 0.9 | 0.4 | 0.4 | 0.3 | -0.2 | 0.2 | | (a) Non-Banking Financial Companies | 0.8 | 0.8 | 0.6 | 0.5 | 0.7 | 0.2 | 1.1 | -0.1 | 0.6 | 0.5 | 0.0 | 0.2 | 0.6 | -0.3 | 0.1 | | (b) Housing Finance Companies | 1.1 | 0.6 | 0.6 | 0.6 | 0.7 | 0.5 | 0.6 | 0.0 | 0.3 | 0.3 | 0.3 | 0.2 | -0.3 | 0.1 | 0.1 | | (c) Insurance Companies | 0.1 | 0.1 | 0.0 | 0.0 | 0.1 | 0.1 | 0.1 | 0.0 | 0.0 | 0.0 | 0.1 | 0.0 | 0.0 | 0.0 | 0.0 | | B. Non-Financial Corporations (Private Corporate Business)* | 0.0 | 0.0 | 0.0 | 0.0 | 0.0 | 0.0 | 0.0 | 0.0 | 0.0 | 0.0 | 0.0 | 0.0 | 0.0 | 0.0 | 0.0 | | C. General Government* | 0.0 | 0.0 | 0.0 | 0.0 | 0.0 | 0.0 | 0.0 | 0.0 | 0.0 | 0.0 | 0.0 | 0.0 | 0.0 | 0.0 | 0.0 | *: Negligible.
Source: Staff calculations. |
| Table 3: Outstanding Position of Assets and Liabilities of Households : Select Instruments | | (₹ crore) | | Item | 2017-18 | 2018-19 | 2019-20 | | Q1 | Q2 | Q3 | Q4 | Q1 | Q2 | Q3 | Q4 | Q1 | Q2 | Q3 | Q4 | | Gross Financial Assets | | of which: | | | | | | | | | | | | | | 74,06,499 | 76,51,681 | 75,92,300 | 79,88,459 | 79,23,991 | 82,16,181 | 82,28,953 | 87,32,543 | 86,82,099 | 89,57,299 | 90,61,181 | 94,43,347 | | a. Bank Deposits (i+ii) | | i. Commercial Bank Deposits | 68,48,812 | 70,86,130 | 70,23,386 | 74,16,181 | 73,54,407 | 76,43,889 | 76,54,524 | 81,45,229 | 80,92,560 | 83,60,743 | 84,24,434 | 88,02,081 | | ii. Cooperative Banks | 5,57,687 | 5,65,552 | 5,68,914 | 5,72,278 | 5,69,584 | 5,72,291 | 5,74,428 | 5,87,315 | 5,89,540 | 5,96,556 | 6,36,747 | 6,41,266 | | b. Life Insurance Funds | 29,44,884 | 30,38,077 | 31,70,213 | 32,07,898 | 32,70,270 | 33,64,359 | 34,10,441 | 35,59,920 | 36,50,999 | 36,86,887 | 37,92,633 | 38,81,446 | | c. Currency Funds | 13,77,115 | 14,19,187 | 15,31,963 | 16,67,814 | 17,82,923 | 17,50,789 | 18,53,445 | 19,49,222 | 20,10,843 | 19,84,738 | 20,71,582 | 22,32,230 | | d. Mutual Funds | 9,46,249 | 10,18,110 | 10,61,206 | 10,65,882 | 11,93,501 | 11,50,709 | 11,93,246 | 12,42,184 | 12,65,871 | 12,79,311 | 13,85,427 | 11,62,078 | | Total (a+b+c+d) | 1,26,74,748 | 1,31,27,055 | 1,33,55,682 | 1,39,30,053 | 1,41,70,686 | 1,44,82,037 | 1,46,86,085 | 1,54,83,870 | 1,56,09,812 | 1,59,08,234 | 1,63,10,822 | 1,67,19,100 | | As per cent to GDP | | a. Bank Deposits (i+ii) | 46.2 | 45.9 | 43.9 | 43.5 | 43.5 | 44.2 | 42.7 | 44.1 | 44.1 | 45.5 | 43.8 | 44.3 | | i. Commercial Bank Deposits | 42.7 | 42.5 | 40.6 | 40.4 | 40.4 | 41.1 | 39.7 | 41.1 | 41.1 | 42.5 | 40.7 | 41.3 | | ii. Cooperative Banks | 3.5 | 3.4 | 3.3 | 3.1 | 3.1 | 3.1 | 3.0 | 3.0 | 3.0 | 3.0 | 3.1 | 3.0 | | b. Life Insurance Funds | 18.4 | 18.2 | 18.3 | 17.5 | 18.0 | 18.1 | 17.7 | 18.0 | 18.6 | 18.7 | 18.3 | 18.2 | | c. Currency Funds | 8.6 | 8.5 | 8.9 | 9.1 | 9.8 | 9.4 | 9.6 | 9.8 | 10.2 | 10.1 | 10.0 | 10.5 | | d. Mutual Funds | 5.9 | 6.1 | 6.1 | 5.8 | 6.6 | 6.2 | 6.2 | 6.3 | 6.4 | 6.5 | 6.7 | 5.5 | | Total | 79.1 | 78.7 | 77.2 | 75.8 | 77.8 | 77.9 | 76.2 | 78.1 | 79.3 | 80.8 | 78.8 | 78.5 | | Gross Financial Liabilities | | Loans (Borrowings) from | | A. Financial Corporations (i+ii) | 4615356 | 4833287 | 4927278 | 5238596 | 5321128 | 5574435 | 5712769 | 5988080 | 5970123 | 6108168 | 6323974 | 6587943 | | (i) Banking Sector | 3725782 | 3884176 | 3924504 | 4183990 | 4228869 | 4399440 | 4540490 | 4771461 | 4733895 | 4850254 | 5050922 | 5323469 | | of which: | | | | | | | | | | | | | | Commercial Banks | 3487301 | 3646121 | 3684863 | 3939323 | 3982324 | 4152097 | 4293543 | 4517329 | 4445666 | 4557895 | 4735661 | 4998267 | | Cooperative Banks & Credit Societies | 238115 | 237677 | 239251 | 244265 | 246138 | 246931 | 246529 | 253708 | 287801 | 291925 | 314821 | 324762 | | (ii) Other Financial Institutions | 889574 | 949111 | 1002774 | 1054606 | 1092259 | 1174995 | 1172278 | 1216619 | 1236228 | 1257914 | 1273053 | 1264474 | | of which: | | | | | | | | | | | | | | Non-Banking Financial Companies | 280643 | 312603 | 337693 | 359583 | 370545 | 422575 | 418860 | 447496 | 446982 | 458506 | 487403 | 472061 | | Housing Finance Companies | 511319 | 536379 | 563004 | 591058 | 614618 | 642947 | 642160 | 656279 | 673312 | 681405 | 665695 | 670179 | | As per cent to GDP | | A. Financial Corporations (i+ii) | 28.8 | 29.0 | 28.5 | 28.5 | 29.2 | 30.0 | 29.6 | 30.2 | 30.3 | 31.0 | 30.6 | 30.9 | | (i) Banking Sector | 23.2 | 23.3 | 22.7 | 22.8 | 23.2 | 23.7 | 23.6 | 24.1 | 24.1 | 24.6 | 24.4 | 25.0 | | of which: | | | | | | | | | | | | | | Commercial Banks | 21.8 | 21.8 | 21.3 | 21.4 | 21.9 | 22.3 | 22.3 | 22.8 | 22.6 | 23.2 | 22.9 | 23.5 | | Cooperative Banks & Credit Societies | 1.5 | 1.4 | 1.4 | 1.3 | 1.4 | 1.3 | 1.3 | 1.3 | 1.5 | 1.5 | 1.5 | 1.5 | | (ii) Other Financial Institutions | 5.5 | 5.7 | 5.8 | 5.7 | 6.0 | 6.3 | 6.1 | 6.1 | 6.3 | 6.4 | 6.2 | 5.9 | | of which: | | | | | | | | | | | | | | Non-Banking Financial Companies | 1.8 | 1.9 | 2.0 | 2.0 | 2.0 | 2.3 | 2.2 | 2.3 | 2.3 | 2.3 | 2.4 | 2.2 | | Housing Finance Companies | 3.2 | 3.2 | 3.3 | 3.2 | 3.4 | 3.5 | 3.3 | 3.3 | 3.4 | 3.5 | 3.2 | 3.1 | Note: The outstanding position for household investment in pension and provident funds is not being published as the latest available data from Employee’ Provident Fund Organization (EPFO), which constitute around 70 per cent of this segment, pertains to 2016-17.
Source: Staff calculations. |
|