The article examines recent developments in India’s external debt profile and external vulnerability indicators. Although the size of India’s external debt has increased since 2017-18, it has remained about 20 per cent of GDP. While the increase in external debt was largely due to borrowings by non-government sector, the share of short-term debt (on residual maturity basis) in total debt increased since 2017-18 driven by non-resident deposits, commercial borrowings, and short-term trade credit. India’s external vulnerability, in terms of reserve adequacy indicators, remained low compared to earlier years. Empirical analysis suggests that the movements in the US dollar against Indian rupee and major currencies influence the size of India’s external debt while the impact of current account deficit (CAD) is not statistically significant. Introduction Countries with chronic current account deficits generally take recourse to foreign equity and debt capital for its financing. By bridging the gap between domestic saving and investment, foreign capital fosters investment and growth in these countries. Excessive external indebtedness, however, is considered detrimental to growth as it increases vulnerability of a country to external shocks and crises. A prudent management of external debt, therefore, is essential for macroeconomic stability of emerging market economies (EMEs). India has been running current account deficit (CAD) persistently since 2004-05. External debt flows, such as external commercial borrowings (ECB), non-resident deposits, and short-term trade credit, have supplemented equity flows in financing India’s persistent CAD. These flows have also helped India build-up necessary foreign exchange reserve buffer to mitigate risks emanating from adverse external developments (such as during taper tantrum in 2013). Since the major economic reforms initiated in early 1990s following the balance of payments (BoP) crisis in 1991, India has managed its external debt prudently and has kept it at sustainable level. India’s other external sector policies have also helped keep its external vulnerability low. Against this backdrop, the article examines recent developments in India’s external debt profile and reserve-related external vulnerability indicators from debt sustainability and vulnerability perspective. The remainder of the article is organised as follows: The next section sets out major developments in India’s external debt at end-September 2019. Third section assesses India’s external debt sustainability and vulnerability for the period from end-March 2015 to end-September 2019. Fourth section analyses the role of valuation effect on India’s external debt. Fifth section assesses reserve adequacy and India’s external vulnerability. Sixth section discusses India’s external debt position and vulnerability vis-à-vis its EME peers, followed by the conclusion. II. India’s External Debt as at end-September 2019: A Snapshot India’s CAD increased to 2.1 per cent of GDP in 2018-19 from 1.8 per cent of GDP a year ago. It, however, narrowed to 1.5 per cent of GDP in H1 of 2019-20. India’s external debt, despite the higher CAD, expanded modestly in 2018-19 as there was outflow of foreign portfolio investors (FPI) investment from the debt segment of domestic capital market. The increase in external debt in 2018-19 and H1 of 2019-20 was primarily due to higher inflows of ECB, non-resident deposits, and short-term trade credit. At end-March 2019, India’s external debt witnessed an increase of US$ 13.9 billion (i.e., 2.6 per cent) over its level a year ago and was placed at US$ 543.2 billion. It further expanded by US$ 14.3 billion (i.e., 2.6 per cent) to US$ 557.5 billion at end-September 2019. The valuation gains resulting from appreciation of the US dollar against Indian rupee and other major currencies (viz., SDR1, euro, and pound sterling) partially offset the increase in India’s external debt at end-September 2019. The valuation gains in external debt were of the order of US$ 4.6 billion, implying that the increase in external debt (excluding the valuation effect) would have been US$ 19.0 billion instead of US$ 14.3 billion (including the valuation effect) at end-September 2019 over end-March 2019. Notwithstanding an increase in absolute value terms, external debt as percentage of GDP edged up marginally from 19.8 per cent at end-March 2019 to 20.1 per cent at end-September 2019. Reflecting lower repayments of commercial borrowings, debt service to current receipts ratio declined to 6.2 per cent at end-September 2019 from 6.4 per cent at end-March 2019. At end-September 2019, commercial borrowings remained the largest component of external debt with a share of 38.8 per cent, followed by non-resident deposits (23.8 per cent) and short-term trade credit (18.6 per cent). Short-term debt (on original maturity basis) increased by 0.7 per cent over its level at end-March 2019 and was placed at US$ 109.1 billion at end-September 2019; however, its share in total debt declined to 19.6 per cent from 20.0 per cent during the same period. On residual maturity basis, short-term debt was placed at US$ 239.4 billion at end-September 2019, witnessing an increase of 1.7 per cent over its level at end-March 2019. Its share in total external debt, however, declined to 42.9 per cent at end-September 2019 from 43.4 per cent at end-March 2019. Similarly, short-term debt (on residual maturity basis) as percentage of reserves declined to 55.2 per cent from 57.0 per cent during the same period, indicating an improvement in reserve cover for short-term external obligations. The currency composition shows that the US dollar denominated debt continued to be the largest component of India’s external debt with a share of 51.9 per cent at end-September 2019, followed by the Indian rupee (34.4 per cent), yen (5.2 per cent), SDR (4.6 per cent) and euro (3.0 per cent). The borrower sector-wise classification shows that the share of outstanding debt of nonfinancial corporations in total debt was the highest at 41.7 per cent, followed by deposit-taking corporations (except the central bank) (29.1 per cent), general government (19.2 per cent) and other financial corporations (6.7 per cent). The instrument-wise classification shows that the loans were the largest component of external debt with a share of 34.5 per cent, followed by currency and deposits (24.4 per cent), trade credit and advances (19.1 per cent) and debt securities (17.7 per cent). III. India’s External Debt: Sustainability and Vulnerability Perspective The assessment of current external debt position is important from the perspective of examining the evolution of external debt position in future and debt sustainability. An analysis of external debt sustainability provides important information about a debtor country whether it is solvent and/or faces liquidity problems. Furthermore, the analysis is crucial in identifying debt associated vulnerabilities and preventing potential crises. In this context, the evolution of debt stock, behaviour of debt to GDP ratio, maturity structure, currency and sectoral composition, debt service, and instrument-wise classification are the pertinent aspects and therefore analysed from an intertemporal perspective. In this section, these aspects of India’s external debt will be analysed for the period from end-March 2015 to end-September 2019. 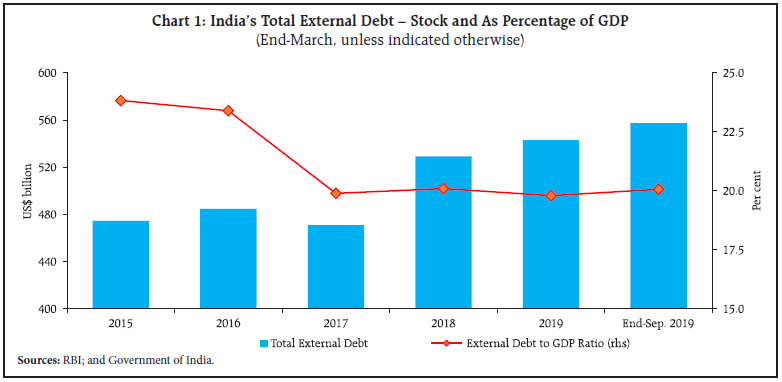 From external debt sustainability perspective, the evolution of external debt stock of a country is generally assessed in relation to its capacity to discharge debt obligations. In this context, external debt to GDP ratio is a standard measure used to gauge a country’s solvency and potential to shift its production to exports so as to enhance its debt repayment capacity.2 External debt may not necessarily be considered harmful for a country provided the size of its economy grows in tandem and/or there is a desired compositional shift in domestic production in favour of exports. III.1. India’s External Debt: Stock and As Percentage of GDP The stock of India’s external debt has increased since 2017-18 following a fall in 2016-17. The stock of external debt which increased from US$ 474.7 billion at end-March 2015 to US$ 484.8 billion at end-March 2016, decreased to US$ 471.0 billion at end-March 2017 (Chart 1). Thereafter, it increased to US$ 529.3 billion at end-March 2018 and to US$ 543.2 billion at end-March 2019. It increased further to US$ 557.5 billion at end-September 2019. The increase in external debt since 2017-18 was primarily driven by ECB, non-resident deposits, and short-term trade credit. Notwithstanding an increase in absolute value terms, India’s external debt stock remained at around 20 per cent of GDP3 since 2017-18, falling from 23.8 per cent and 23.4 per cent in 2014-15 and 2015-16, respectively. The decline and stability of external debt to GDP ratio may be attributed to higher average growth of GDP than external debt (Chart 2). III.2. Debt Service Ratio In addition to the stock-based debt burden indicators, external debt sustainability and vulnerability is assessed on the basis of flow-based indicators. These indicators are used to assess external debt sustainability from liquidity perspective. For instance, debt service ratios are flow-based indicators. Debt service (i.e., amortisation and interest payments) provides information on the requirement of resources of a country to servicing its debt and potential crowding out of financial resources and hence is useful to compare repayment capacity of a country over the years. High and unstable debt service ratios are clear indication of debt servicing difficulties and distress, and increased likelihood of unsustainable debt and vulnerability. 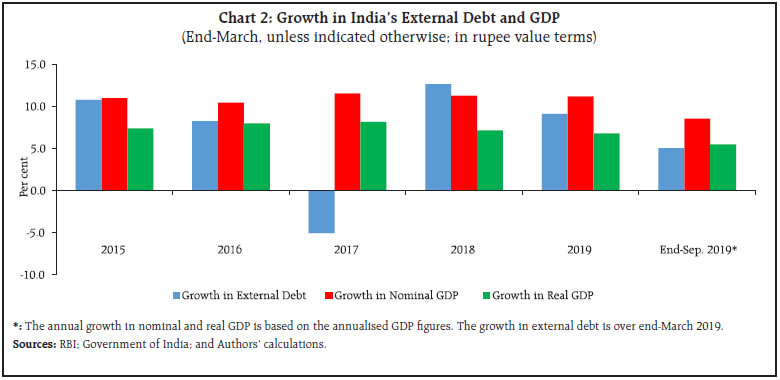 In the Indian case, debt service is generally compared to current receipts. India’s debt service ratio witnessed a gradual decline from its level of 8.8 per cent since 2015-16, reflecting primarily an improvement in current receipts (Chart 3.a). During 2018-19 and H1 of 2019-20, the quarterly debt service ratio remained lower than 7 per cent (Chart 3.b). III.3. India’s External Debt by Component On original maturity basis, commercial borrowings continued to be the largest component of India’s external debt, followed by non-resident deposits, and short-term debt. At end-September 2019, the share of commercial borrowings in total debt was 38.8 per cent, while non-resident deposits and short-term debt comprised 23.8 per cent and 19.6 per cent of total debt, respectively (Chart 4). Commercial bank loans and FPI investments have been the two major components of commercial borrowings which together accounted for about 76 per cent of total outstanding commercial borrowings at end-September 2019. Notably, the share of commercial bank loans in commercial borrowings has witnessed a decline, while that of ECB raised through securitised instruments (including FCCB4) and banks’ overseas borrowings have increased between end-March 2015 and end-September 2019. The share of commercial bank loans in commercial borrowings which was 56 per cent at end-March 2015, stood at 47 per cent at end-September 2019. In contrast, the share of ECB through securitised instruments (including FCCB) increased from 7 per cent at end-March 2015 to 16 per cent at end-September 2019. The share of FPI investments in debt instruments remained in the range of 28 to 35 per cent during the same period. NR(E)RA deposits have been the largest component of non-resident deposits, followed by FCNR(B) and NRO deposits.5 The share of NR(E)RA deposits in total non-resident deposits has increased and that of FCNR(B) deposits declined remarkably between end-March 2015 and end-September 2019. The share of NR(E)RA deposits in total non-resident deposits which was 54 per cent at end-March 2015, increased to 70 per cent at end-September 2019. In contrast, the share of FCNR(B) deposits declined from 37 per cent to 18 per cent during the same period. The decline in the share of FCNR(B) deposits reflects redemption of lumpy deposits in 2016-17. 6 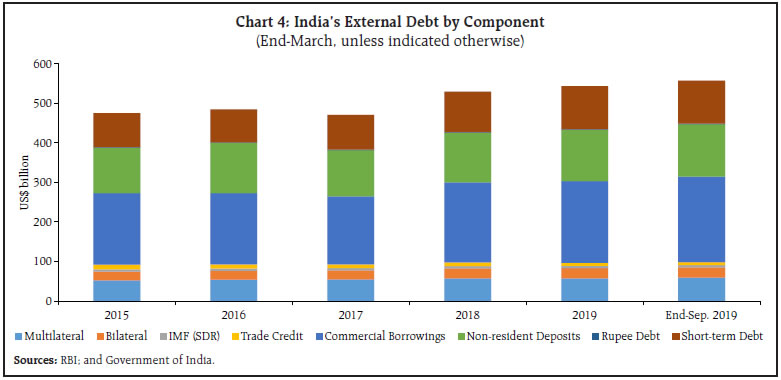
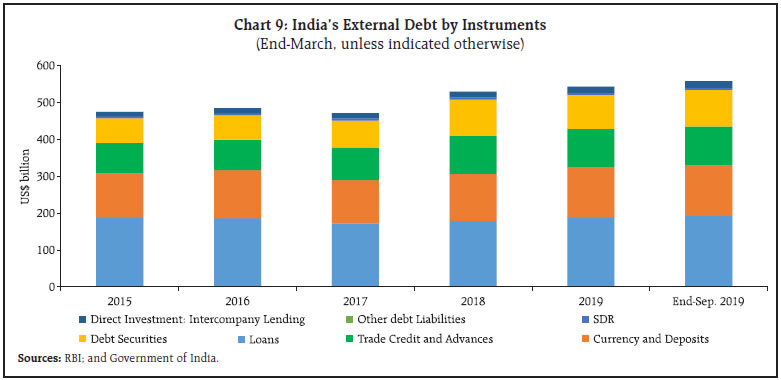
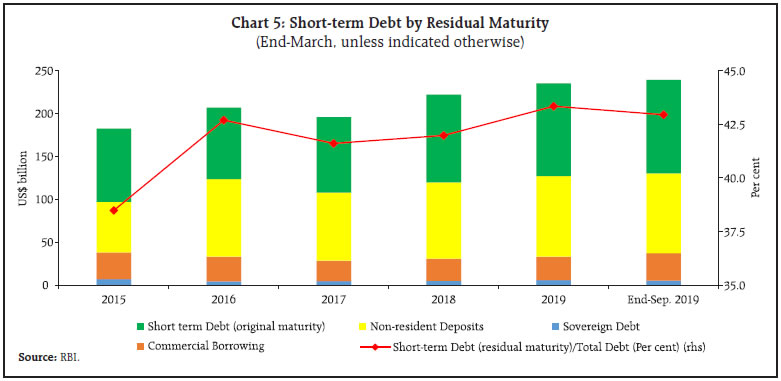 Short-term trade credit with a share of 95-98 per cent has been the largest component of short-term debt since 2014-15. The trade credit for tenor of 6 months to 1 year has been the largest component of short-term trade credit. Notably, the share of trade credit for tenor of 6 months to 1 year in short-term trade credit has witnessed a gradual decline from 65 per cent to 51 per cent between end-March 2015 and end-September 2019. It reflected sapping of short-term trade credit flows after the discontinuation of Letters of Undertaking (LoUs) and Letters of Comfort (LoCs) for trade credits since March 2018 (see also Annex I). III.4. Short-term Debt by Residual Maturity Short-term debt by residual maturity is a measure of debt obligations (both long- and short-term by original maturity) due for payment within next one year and serves as an important indicator in assessing liquidity risks. Short-term debt (by residual maturity) comprised 42.9 per cent of total external debt at end-September 2019 as compared with 38.5 per cent at end-March 2015. Of the total short-term debt at end-September 2019 which is due for repayment in next one year, 46 per cent was originally raised with a maturity period of up to one year (Chart 5). During the same period, the share of non-resident deposits by residual maturity was the highest at about 44 per cent at end-March 2016, reflecting redemption of lumpy FCNR(B) deposits during September to November 2016. The share of non-resident deposits by residual maturity was about 39 per cent at end-September 2019. The share of commercial borrowings and sovereign debt in short-term debt by residual maturity was 13 per cent and 2 per cent, respectively, at end-September 2019. III.5. Sectoral Composition External debt sustainability of a country depends on the balance sheets and revenue-expenditure balances of different sectors – government, banking and non-banking financial sectors, and corporate and household sectors – which are interlinked by actual and contingent liabilities (IMF, 2002). Since end-June 2019, the Reserve Bank has adopted the International Monetary Fund’s (IMF) 2013 External Debt Statistics (EDS) Guide which provides more disaggregated data on India’s external debt (Annex II). 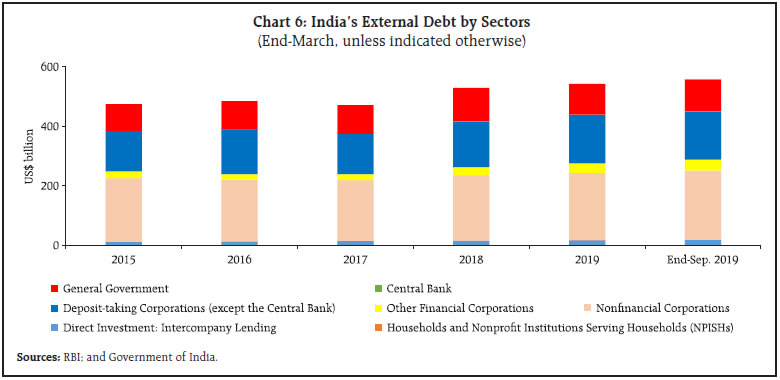 The share of outstanding debt of nonfinancial corporations in total debt has been the highest, followed by deposit-taking corporations (except the central bank), general government, other financial corporations, and intercompany lending between FDI7 companies. The share of nonfinancial corporations which was 45 per cent at end-March 2015, declined to 42 per cent at end-September 2019 (Chart 6). The share of deposit-taking corporations (except the central bank) and general government remained the same at about 29 per cent and 19 per cent, respectively, during the same period. The share of outstanding debt of other financial corporations increased from 5 per cent at end-March 2015 to 7 per cent at end-September 2019. Similarly, the share of intercompany lending between FDI companies rose marginally from 2 per cent to 3 per cent during the same period. Both government and non-government debt as percentage of GDP declined between end-March 2015 and end-September 2019. The government debt which was 4.5 per cent of GDP at end-March 2015, declined to 3.9 per cent at end-September 2019 (Chart 7). Similarly, the non-government debt fell from 19.3 per cent to 16.2 per cent during the same period. III.6. Currency Composition The changes in exchange rates impact cash flows and balance sheets of borrowers – a large swings in exchange rates may severely affect their cash flows and balance sheets. An assessment of currency composition of external debt, therefore, is important from the perspective of debt sustainability and vulnerability. The US dollar denominated debt has been the largest component of India’s external debt over the years. Between end-March 2015 and end-September 2019, however, the share of US dollar denominated debt declined, while that of INR denominated debt increased. The share of US dollar denominated debt which was 58 per cent at end-March 2015, declined to 52 per cent at end-September 2019 (Chart 8). In contrast, the share of INR denominated debt increased from 28 per cent to 34 per cent during the same period. III.7. Instrument-wise Classification Loans have been the largest component of India’s external debt, followed by currency and deposits, trade credit and advances, and debt securities. Of these major instruments, the share of loans declined, while that of debt securities increased between end-March 2015 and end-September 2019. Loans which constituted 40 per cent of total debt at end-March 2015, decreased to 35 per cent at end-September 2019 (Chart 9). In contrast, the share of debt securities rose from 14 per cent at end-March 2015 to 18 per cent at end-September 2019. The share of currency and deposits declined marginally from 25 per cent to 24 per cent during the same period. The share of trade credit and advances increased marginally from 18 per cent at end-March 2015 to 19 per cent at end-September 2019. IV. Valuation Effect of Exchange Rate Movements on India’s External Debt The US dollar is used as numeraire currency for the valuation of stock of external debt in most of countries. The movements in currencies in which debt is denominated, therefore, also impact, among others, the level of external debt (Box I). The weakening (strengthening) of the US dollar vis-à-vis currencies in which debt is denominated enlarges (reduces) the value of external debt in US dollar terms. In the case of India, the valuation effect is largely driven by movements of major currencies, viz., INR, yen, euro, and SDR. Of these currencies, the contribution of movements of the INR vis-à-vis US dollar in valuation effect has been the largest in recent years. 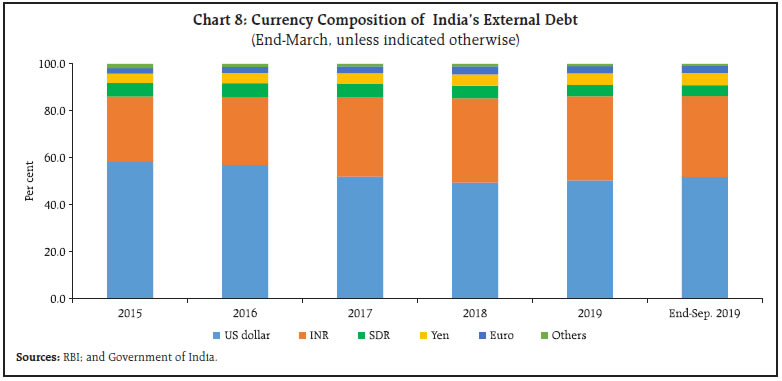
Box I: Impact of Movements in the US Dollar on India’s External Debt The movements of the US dollar vis-à-vis major currencies (viz., INR, yen, euro, and SDR) largely impact the valuation of India’s external debt measured in US dollar terms. The appreciation (depreciation) in the US dollar reduces (increases) the value of debt. The role of valuation changes on external account position is well emphasised by the IMF (see IMF, 2009). Tille (2003) has investigated the impact of exchange rate movements on external debt for the US. The Box presents an empirical investigation of the impact of movements in the US dollar vis-à-vis major currencies on the US dollar value of India’s external debt. The empirical study uses quarterly data for the period from 2000-01 to 2018-19. During this period, the average share of US dollar and other major four currencies denominated debt in total debt was about 53 per cent and 55 per cent, respectively. Given a large share of major non-US dollar currencies denominated debt, a priori, the movements of US dollar vis-à-vis these currencies are likely to impact the valuation of debt significantly. In order to estimate the impact of movements of the US dollar vis-à-vis major currencies on India’s external debt stock, the composite nominal effective exchange rate (NEER) indices for the basket of four major currencies were computed. The exchange rates of major currencies against the US dollar were weighted by their respective shares in India’s external debt to compute these indices. The year 2000 was selected as base year for these indices. An increase (decrease) in the NEER index implies the appreciation (depreciation) of the US dollar against the basket of these major currencies. The study considers a regression model where the stock of external debt (in US dollars) is the dependent variable, and the NEER index of the US dollar and CAD (in US dollars) are the explanatory variables. CAD is used as a control variable as it may induce higher borrowing for its financing in certain circumstances. All variables have been taken in the logarithmic form. The unit root test results confirm that these variables are I(1). And, the Johansen cointegration test suggests these variables to be cointegrated. Accordingly, the vector error correction (VEC) estimates were obtained for the model. The results are set out in the following table: | Table I.1: Impact of Movements of US Dollar on India’s External Debt – VEC Estimates9 | | Dependent variable: LD | | ECT | Cointegrating equation | R2 | Adj. R2 | | LNEER | LCAD | C | | -0.07* | -2.17* | -0.08 | -14.03 | 0.86 | 0.83 | LD: Log (external debt stock); LNEER: Log (NEER); LCAD: Log (CAD); ECT: Error correction term; and C: Constant.
*Significant at 1 per cent level.
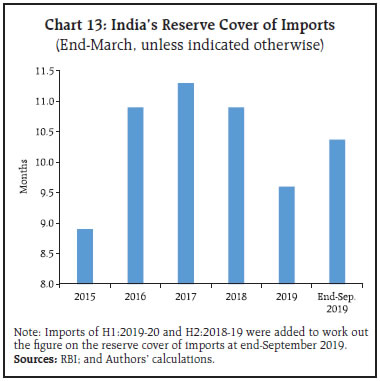
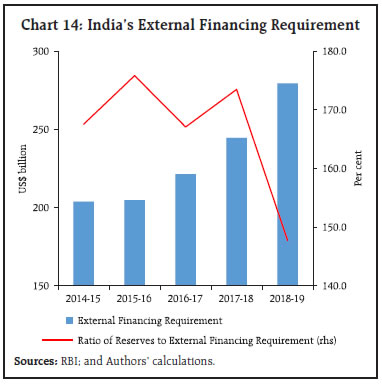
Source: Authors’ estimates. | The results confirm that the appreciation of the US dollar vis-à-vis the basket of major currencies (including Indian rupee) reduces the stock of external debt in US dollar terms significantly. A one per cent appreciation of the US dollar is associated with about 2 per cent fall in the stock of external debt. However, the CAD does not come out to be significant driver of India’s external debt. The potential reason of an insignificant impact of India’s CAD on external debt is the financing pattern of India’s CAD. India receives a large amount of equity and other flows (such as foreign direct and portfolio equity investments) that finance India’s CAD significantly. These flows constituted about 50 per cent of capital flows (on net terms) during the sample period. In addition to equity and other flows, reserves have also financed CAD when net capital flows fell short of the requirement. For instance, CAD was partially financed by reserves during 2008-09, 2011-12 and 2018-19 (Chart I.1). Notably, during 2008-09, capital flows (on net terms) of US$ 7.4 billion were insufficient to finance CAD to the tune of US$ 27.9 billion, and, therefore, there was a net depletion of US$ 20.1 billion in reserves. Similarly, CAD of 4.3 per cent of GDP, which was above the sustainable level of India’s CAD, was partially financed by capital flows, resulting in depletion of US$ 12.8 billion of reserves during 2011-12. 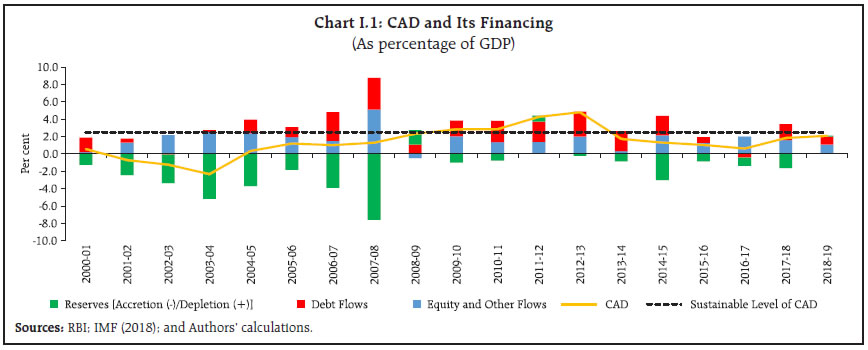 | Reflecting the exchange rate movements, there were valuation gains in India’s external debt at end-March 2015, 2016 and 2019, and end-September 2019 when external debt including valuation effect stood lower than external debt excluding valuation effect (Chart 10). In contrast, valuation losses were recorded at end-March 2017 and 2018. During the period from end-March 2015 to end-September 2019, the highest valuation gains of US$ 16.7 billion were recorded at end-March 2019, followed by US$ 16.1 billion and US$ 5.8 billion at end-March 2015 and 2016, respectively (Chart 11.a). These valuation gains were largely contributed by the valuation changes in the INR denominated debt on account of strengthening of US dollar vis-à-vis INR (Chart 11.b). V. Reserve Adequacy and India’s External Vulnerability In addition to assessing a country’s external vulnerability on the basis of debt-related indicators, vulnerability is assessed on the basis of measures of reserve adequacy. Reserves are held for several reasons. The primary among these are ensuring self-insurance and liquidity buffers against external shocks and crisis. In addition, the accumulation of reserves boosts confidence in authorities’ commitment to the timely discharge of external obligations and helps preserve the value of domestic currency. Reserve adequacy indicators are useful predictor of incidence and depth of crisis (IMF, 2000). India’s prudent external sector management policies following the balance of payments crisis of 1991 have ensured maintaining sufficient cover of reserves for meeting financing requirement of CAD as well as external debt obligations. V.1. Reserve Cover of External Debt India’s reserves have increased since 2014-15, except in 2018-19 when they depleted to finance CAD (Chart 12.a). Nevertheless, reserves have provided sufficient cushion for external debt obligations (both short-term and total debt). Reserves which provided cover of 72 per cent of total external debt at end-March 2015, increased its cover to 80.2 per cent at end-March 2018. However, thereafter, the reserve cover of total external debt declined to 76 per cent at end-March 2019, reflecting the depletion of reserves. With recouping of reserves in H1 of 2019-20, however, the reserve cover of total external debt increased to 77.8 per cent at end-September 2019. Another indicator that is useful in assessing the liquidity pressure and external vulnerability of a debtor country is the reserve cover of short-term debt, particularly on a residual maturity basis. A lower reserve cover of short-term debt (on residual maturity basis) is associated with a greater incidence and depth of external crisis (IMF, 2000). The “Greenspan-Guidotti” rule recommends at least 100 per cent of reserve cover of short-term debt (on residual maturity basis); and the rule is widely followed as a measure of reserve adequacy and liquidity buffers against external shocks in EMEs. At end-September 2019, the reserves provided sufficiently high cover for India’s short-term debt – which was 181.2 per cent and 397.4 per cent for short-term debt on residual and original maturity basis, respectively (Chart 12.b). V.2. Reserve Cover of Imports Reserve cover of imports is an important external liquidity indicator to assess external vulnerability of a country. It provides information on the number of months a country’s reserves can finance its imports if all external inflows cease. India’s reserves provided cover for more than 9.5 months of imports since 2015-16, which is higher than the conventional rule of reserve cover of imports of 3 months (Chart 13). V.3. Reserve Cover of External Financing Requirement In addition to the aforementioned conventional indicators, another indicator that is useful in assessing liquidity pressure and vulnerability of a debtor country is the external financing requirement (Box II). It is a measure of requirement of a country to finance its CAD and debt obligations maturing in a year (i.e., short-term debt by residual maturity). By this measure as well, the reserve cover remained at sufficiently high level to the tune of more than 145 per cent during 2014-15 to 2018-19 (Chart 14). 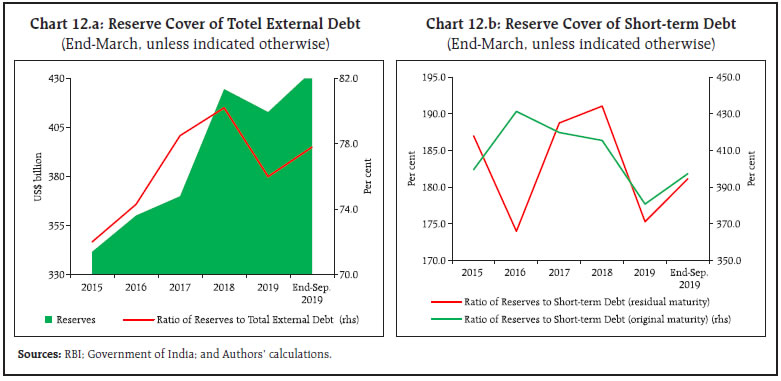
Box II: External Vulnerability Index for India To assess the external vulnerability of an economy, a range of indicators related to reserves, external liabilities, debt-equity ratio, and maturity profile of debt are employed. The movements in these indicators provide information about the rise or fall in the level of external vulnerability; however, with varied and divergent movements in these indicators, it is difficult to assess the level of vulnerability of an economy at a point in time. For instance, while worsening of external debt related indicators indicate rising vulnerability, the concomitant improvement in reserve cover of imports may reflect lower vulnerability. Therefore, it is useful to construct a composite index of external vulnerability using key macroeconomic indicators to assess the level of vulnerability of an economy at any point in time. The Box presents the methodology of construction of external vulnerability index for India. Following Catão and Milesi-Feretti (2013), a panel probit model of key macroeconomic indicators is employed to compute the composite index. The probit model estimates the relative impact of each of the vulnerability indicators on the probability of crisis. The panel includes India and its major EME peers, viz., Argentina, Brazil, Chile, Malaysia, Mexico, Russia, South Africa, and Turkey for the sample period from 1991 to 2018 which faced crisis at various points of time. The dependent variable of the probit model is binary that takes value 1 for the probability that a crisis will occur, otherwise it takes value 0. The model considers six key macroeconomic variables as explanatory variables that are considered to be important from external vulnerability and crisis perspective [see, for instance, Catão and Milesi-Feretti (2013); Goyal (2012)]. These variables are ratio of net international investment position (IIP) to GDP, ratio of external financing requirement to reserves, share of short-term debt (residual maturity) in total external debt, growth differential as measured by the ratio of per capita real income of a country included in the sample to that of the US, global liquidity, and government effectiveness index. Prior to the empirical estimation, following Eichengreen and Bordo (2002), the crisis years were identified by computing exchange market pressure based on changes in exchange rate, reserves, and short-term interest rate. The computation of exchange market pressure provided identification of 25 crisis years for the panel. The empirical results suggest that a rise in net international liabilities to GDP ratio and share of short-term debt in total external debt significantly increase the probability of crisis, while an improvement in growth prospects significantly lowers the probability of crisis (Table II.1). Government effectiveness significantly lowers the probability of crisis. A rise in the ratio of external financing requirement to reserves increases the probability of crisis. The time series of estimated probabilities of crises was used to construct the composite external vulnerability indices for India. The indices were constructed against a base value of probability of crisis which represents the threshold beyond which a rise in the probability implies an increase in the vulnerability of a country to external shocks and crisis. The unconditional probability of crisis, i.e., the threshold, was estimated to be 0.096 (or 9.6 per cent). By equating the unconditional probability of crisis to 100, the series of probabilities of crises was transformed into external vulnerability indices. An economy may be considered vulnerable to external shocks and crisis if external vulnerability index is at 100 or above. | Table II.1: Probit Estimates of Crisis Probability | | Explanatory Variable | Coefficient | | Net IIP to GDP ratio | 2.34*** | | External financing requirement to reserves ratio | 0.23* | | Share of short-term debt in total external debt | 3.20*** | | Government effectiveness index | -0.68** | | Global liquidity | 0.06 | | Growth differential (-1) | -5.15*** | | McFadden R2 | 0.26 | | LR Statistic | 30.60 | ***, **, and * denote significant at 1 per cent, 5 per cent and 10 per cent levels.
Source: Goyal (2019). | The constructed series of external vulnerability index to a large extent capture past episodes of stress in India’s external sector (Chart II.1). Over the sample period, the level of external vulnerability of India was measured to be the highest during the balance of payments crisis episode of early 1990s, followed by the episode of global financial crisis in 2008-09. India’s external vulnerability index remained above threshold during 2012-15, reflecting a sharp rise in India’s CAD and impact of taper tantrum and monetary policies of major central banks on India’s external sector during the period. In 2018, index was marginally above the threshold as share of short-term debt in total external debt and ratio of external financing requirement to reserves edged up. Importantly, most of external vulnerability indicators (particularly reserve-related indicators), however, have improved in 2019. | VI. Cross-country Analysis In terms of stock of external debt at the end of 2018, India was the third most externally indebted county preceded by China and Brazil. India’s external debt was US$ 521.2 billion, while that of China and Brazil stood at US$ 1,965.2 billion and US$ 665.8 billion. In terms of external debt to GDP ratio, however, India is better placed as compared to its peer EMEs – its external debt to GDP ratio was lower than its major peers, except China (Chart 15). In terms of reserve cover of total external debt, India fares better than Brazil, Malaysia, Mexico, Indonesia, South Africa, Argentina, and Turkey. Although India’s reserves were higher than its short-term debt liabilities on residual maturity basis, its cover was higher than that of only few of its peers (viz., South Africa, Malaysia, Turkey, and Argentina). 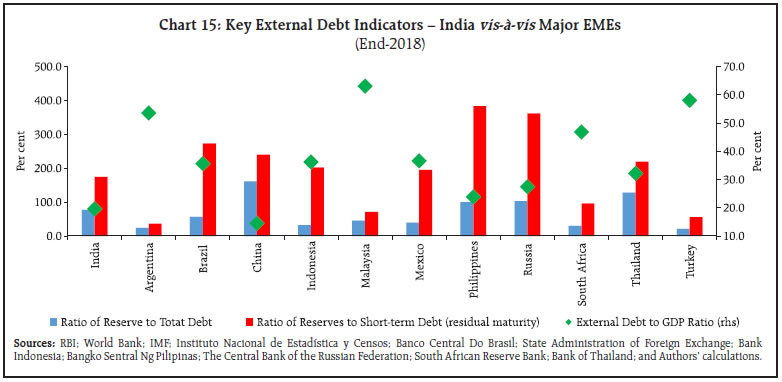 Sectoral composition of external debt shows the governments in most of major EMEs have larger share in total external debt than that in India (Chart 16). These countries include Turkey, Brazil, South Africa, the Philippines, Mexico, Indonesia, and Argentina. Notably, the governments in Argentina, Indonesia, the Philippines, and South Africa are more involved in external borrowing activity and higher externally indebted than other sectors. Among non-government sectors, the share of debt of India’s other sectors (including other financial corporations, nonfinancial corporations, and NPISHs) in total debt is the highest. It is the second highest level after Mexico among select major EMEs. Deposit-taking corporations (except the central bank) in China, Malaysia, and Turkey have higher share than that in India. The share of intercompany lending between FDI companies in most of select major EMEs is higher than that in India. 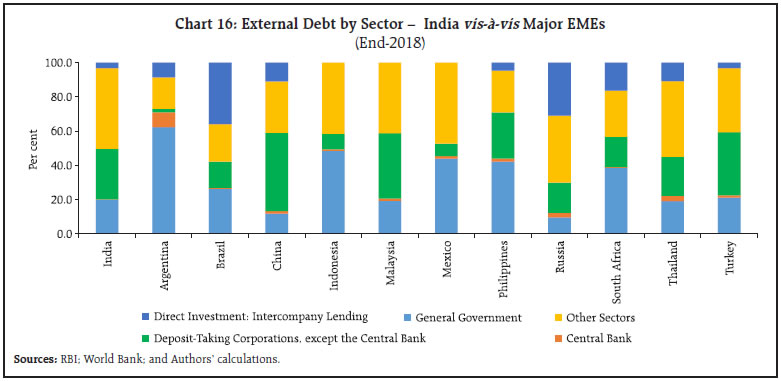 Instrument-wise classification of external debt shows that loans, like in India, have the highest share in the Philippines, Turkey, Indonesia, Thailand, and Russia (Chart 17). Currency and deposits, and trade credit and advances which are the second and third largest components, respectively, in India’s external debt, have higher share only in China than that in India. Debt securities in all countries, except Russia, have higher share than that in India. Notably, loans and debt securities in most major EMEs constitute more than 50 per cent of their total external debt. Among major EMEs, loans have the highest share in the Philippines, while debt securities have the highest share in Mexico. External debts in all major EMEs, except in South Africa, are more denominated in foreign currencies than that in India. In terms of reserve cover of external financing requirement, India was better placed than few of its peers, such as South Africa, Malaysia, Turkey, and Argentina, in 2018 (Chart 18). However, in terms of debt service ratio, India ranked better than most of its peers.
VII. Conclusion India’s stock of external debt has increased since 2017-18 after a fall in 2016-17. Nevertheless, external debt as percentage of GDP after averaging 23.6 per cent during 2014-15 to 2015-16 remained lower at about 20 per cent in the subsequent years. This may be attributed to higher growth of Indian economy than that of external debt. India’s prudent external sector management policies have kept its external vulnerability low – reserves have provided adequate cover for short-term debt obligations (residual maturity), imports, and external financing requirement; and debt service ratio has remained low. India fares better than its EME peers in terms of external debt to GDP ratio and debt service ratio. Most of India’s peers, however, surpass its level of reserve cover of short-term debt (residual maturity) and external financing requirement. Nevertheless, this is not of much concern as India’s reserves have provided more than 100 per cent of cover for short-term debt (residual maturity) and external financing requirement. The empirical investigation of impact of movements of the US dollar on India’s external debt has confirmed that the appreciation (depreciation) of the US dollar vis-à-vis major currencies in which India’s external debt is denominated reduces (increases) the value of India’s external debt in US dollar terms. CAD, however, does not contribute significantly in increasing external debt as a large part of it is financed by non-debt flows as well as reserves during periods of moderate capital flows as was the case in 2008-09, 2011-12 and 2018-19. The article also presents the methodology of construction of external vulnerability index for India. The constructed series of external vulnerability indices to a large extent capture the past episodes of stress in India’s external sector. The external vulnerability indices suggest the level of vulnerability to be the highest during the episode of balance of payments crisis in early 1990s, followed by the episodes of global financial crisis in 2008-09, and a sharp rise in India’s CAD and impact of taper tantrum and monetary policies of major central banks during 2012-15. References Catão, L.A.V. and G.M. Milesi-Feretti (2013), “External Liabilities and Crises”, IMF Working Paper No. 13/113. Eichengreen, B. and M.D. Bordo (2002), “Crises Now and Then: What Lessons from the Last Era of Financial Globalization?”, NBER Working Paper Series 8716. Goyal (2012), “Sustainable Level of India’s Current Account Deficit”, RBI Working Paper Series No. WPS (DEPR): 16/2012, Reserve Bank of India. International Monetary Fund (2000), “Debt- and Reserve-related Indicators of External Vulnerability”, Prepared by the Policy Development and Review Department, International Monetary Fund. International Monetary Fund (2009), Balance of Payments and International Investment Position Manual, International Monetary Fund. International Monetary Fund (2011), “Assessing Reserve Adequacy”, Prepared by Monetary and Capital Markets, Research, and Strategy, Policy, and Review Departments, International Monetary Fund. International Monetary Fund (2014), External Debt Statistics: Guide for Compilers and Users, International Monetary Fund. International Monetary Fund (2018), “2018 Article IV Consultation – Press Release; Staff Report; And Statement by The Executive Director for India”. Retrieved from https://www.imf.org/en/Publications/CR/Issues/2018/08/06/India-2018-Article-IV-Consultation-Press-Release-Staff-Report-and-Statement-by-the-Executive-46155. International Monetary Fund, “International Financial Statistics”, Retrieved from https://data.imf.org/?sk=4C514D48-B6BA-49ED-8AB9-52B0C1A0179B. International Monetary Fund, “World Economic Outlook Database”, Retrieved from https://www.imf.org/en/Publications/SPROLLs/world-economic-outlook-databases#sort=%40imfdate%20descending. Lane, P.R. and G.M. Milesi-Ferretti (2017), “International Financial Integration in the Aftermath of the Global Financial Crisis”, IMF Working Paper No. 17/115. Reserve Bank of India (1998), Report of the Technical Group on External Debt, Reserve Bank of India. Tille, C. (2003), “The Impact of Exchange Rate Movements on U.S. Foreign Debt”, Current Issues in Economic and Finance, Vol. 9, No. 1, Federal Reserve Bank of New York. World Bank Group, “DataBank”, Retrieved from https://databank.worldbank.org/home.aspx.
Annex I: India’s External Debt Management – Major Policy Developments during 2018-19 and 2019-20 so far External Commercial Borrowings (ECB) November 2018: The Reserve Bank, in consultation with the Government of India, decided to reduce the mandatory hedge coverage from 100 per cent to 70 per cent for ECB raised under Track I of the ECB framework by eligible borrowers for a maturity period between 3 and 5 years. January 2019: In order to rationalise the extant framework for ECB and Rupee Denominated Bonds (RDBs), the Reserve Bank, in consultation with the Government of India, decided to merge Tracks I and II as “Foreign currency denominated ECB” and Track III and RDBs framework as “Rupee Denominated ECB”. It was decided to include all entities eligible to receive FDI as eligible borrowers. Additionally, Port Trusts, Units in special economic zone (SEZ), Small Industries Development Bank of India (SIDBI), EXIM Bank, registered entities engaged in micro-finance activities, viz., registered not for profit companies, registered societies/trusts/cooperatives and non-government organisations were also allowed to borrow under this framework. February 2019: The Reserve Bank, in consultation with the Government of India, decided to relax the end-use restrictions for resolution applicants under the Corporate Insolvency Resolution Process (CIRP) and allow them to raise ECB from the recognised lenders, except the branches/overseas subsidiaries of Indian banks, for repayment of rupee term loans of the target company under the approval route. July 2019: The Reserve Bank, in consultation with the Government of India, decided to relax the end-use restrictions for ECB. Accordingly, eligible borrowers were permitted to raise ECB for the following purposes from recognised lenders, except foreign branches/overseas subsidiaries of Indian banks: -
ECB with a minimum average maturity period of 10 years for working capital purposes and general corporate purposes. Borrowing by non-banking financial companies (NBFCs) for the above maturity for on-lending for the above purposes is also permitted. -
ECB with a minimum average maturity period of 7 years can be availed by eligible borrowers for repayment of rupee loans availed domestically for capital expenditure as also by NBFCs for on-lending for the same purpose. For repayment of rupee loans availed domestically for purposes other than capital expenditure and for on-lending by NBFCs for the same, the minimum average maturity period of the ECB is required to be 10 years. -
It was decided to permit eligible corporate borrowers to avail ECB for repayment of rupee loans availed domestically for capital expenditure in manufacturing and infrastructure sector if classified as SMA-2 or NPA, under any one-time settlement with lenders. Lender banks are also permitted to sell, through assignment, such loans to eligible ECB lenders, except foreign branches/overseas subsidiaries of Indian banks, provided the resultant external commercial borrowing complies with all-in-cost, minimum average maturity period and other relevant norms of the ECB framework. FPI Investments in Debt Securities April 2018: The Reserve Bank revised the minimum residual maturity requirement for investment by FPIs in Central Government securities (G-secs). FPIs were permitted to invest in G-secs, including in Treasury Bills, and State Development Loans (SDLs) without any minimum residual maturity requirement (earlier it was three years), subject to the condition that short-term investments by an FPI under either category shall not exceed 20 per cent of the total investment of that FPI in that category. Also, FPIs were permitted to invest in corporate bonds with minimum residual maturity of above one year (earlier it was three years), subject to the condition that short-term investments in corporate bonds by an FPI shall not exceed 20 per cent of the total investment of that FPI in corporate bonds. February 2019: In order to encourage a wider spectrum of investors to access the Indian corporate debt market, the Reserve Bank decided to withdraw the provision stating that “no FPI shall have an exposure of more than 20 per cent of its corporate bond portfolio to a single corporate (including exposure to entities related to the corporate)”. March 2019: The Reserve Bank, in consultation with the Government of India and Securities and Exchange Board of India (SEBI), introduced a separate channel, called the ‘Voluntary Retention Route (VRR)’, to enable FPIs to invest in debt markets in India. Broadly, investments through the Route is free of the macro-prudential and other regulatory norms applicable to FPI investments in debt markets, provided FPIs voluntarily commit to retain a required minimum percentage of their investments in India for a period. April 2019: As a measure to broaden access of non-resident investors to debt instruments in India, the Reserve Bank permitted FPIs to invest in municipal bonds. Non-resident Rupee Accounts November 2019: With a view to promote the usage of INR products by persons resident outside India, the Reserve Bank in consultation with the Government of India decided to expand the scope of Special Non-resident Rupee (SNRR) Account by permitting person resident outside India to open such account for: (i) ECB; (ii) trade credits; (iii) trade (export/import) invoicing; and (iv) business-related transactions outside International Financial Service Centre (IFSC) by IFSC units at Gujarat International Finance Tec-City (GIFT) like administrative expenses in INR outside IFSC, INR amount from sale of scrap, government incentives in INR, etc. The account will be maintained with bank in India (outside IFSC).
Annex II Introduction of Data Dissemination of India’s External Debt as per IMF’s 2013 EDS Guide The debt and financial crises in last four decades, particularly global financial crisis of 2007-08, exposed the high external indebtedness associated vulnerabilities of many advanced, and emerging and developing economies. These crises have underlined the importance of compilation and dissemination of reliable, timely and comprehensive data on external debt as a crucial element for the early detection of external vulnerabilities of countries. Against this backdrop, the IMF prepared the 2013 External Debt Statistics: Guide for Compilers and Users under the joint responsibility of the nine international organisations in the Inter-Agency Task Force on Finance Statistics (TFFS), in consultation with national compilers of external debt, balance of payments (BoP) and international investment position (IIP) statistics. The concepts set out in the IMF’s 2013 External Debt Statistics (EDS) Guide are harmonized with those of the System of National Accounts (SNA) 2008 and the sixth edition of the IMF’s Balance of Payments and International Investment Position Manual (BPM6) published in 2009. The conceptual approach of the Guide facilitates consistency and comparability among external debt statistics and other macroeconomic statistics of a country, such as BoP, IIP, and national accounts. The Guide recommends compilation and dissemination of comprehensive data on gross external debt position, i.e., by debtor sectors, instruments and maturity, among others. The recommendations of the Guide are useful in compilation and dissemination of internationally comparable statistics on external debt. In order to make statistics on India’s external debt position internationally comparable and consistent with India’s other macroeconomic statistics, such as BoP and IIP statistics which are already being compiled and disseminated as per the IMF’s BPM6, the Reserve Bank introduced compilation and dissemination of statistics on India’s external debt as per the IMF’s 2013 EDS Guide format, as an additional format, with the release of statistics on India’s external debt position at end-June 2019 in September 2019. Several advanced and emerging market economies, such as Brazil, Chile, China, Malaysia, the Philippines, South Africa, Thailand, and the US, follow the IMF’s 2013 EDS Guide for the compilation and dissemination of their external debt statistics. Until the release of statistics on India’s external debt position at end-March 2019 in June 2019, the gross debt position was being classified, as per the recommendations of the Policy Group/Task Force (PG/TF) on the External Debt Statistics of India (1992) and the Report of the Technical Group on External Debt (1998), under following broad categories: multilateral debt, bilateral debt, IMF-SDR, trade credit, commercial borrowings, non-resident deposits, rupee debt, and short-term debt. Following the recommendations of the IMF’s 2013 EDS Guide, India’s external debt position is classified by debtor sectors, instruments and maturity. The debtor sectors include general government, central bank, deposit-taking corporations (except the central bank), other sectors (including other financial corporations, nonfinancial corporations, and households and non-profit institutions serving households (NPISHs)), and direct investment: intercompany lending. The sectoral position of debt is further classified by sector-specific instruments, viz., loans, debt securities, currency and deposits, trade credit and advances, SDR (allocations), and other debt liabilities, under short- and long-term position. Thus, the format as per the IMF’s 2013 EDS Guide provides additional information (i.e., sectoral, instrument- and maturity-wise debt position) on India’s external debt to policymakers and other users.
|