This article analyses data collected through a pan-India primary survey of farmers, traders and retailers to examine the role of mark-ups charged by different intermediaries in the agricultural markets in creating a wedge between farm gate prices and retail prices for 16 major food items covered in the Consumer Price Index-Combined (CPI-C) basket. The average share of farmers in the consumers’ rupee is found to be in a range of 28 per cent and 78 per cent for different food items. Empirical results suggest that factors contributing to greater efficiency in the supply chain such as better road network, mandi infrastructure, tele-density to improve flow of information, irrigation facilities to reduce supply uncertainties, and increase in overall literacy levels in the country enabling greater consumer awareness can help reduce mark-ups. Introduction Food price inflation in India has witnessed a sharp and sustained moderation since 2014-15. Annual average food inflation based on CPI-C, which was 11.9 per cent in 2013-14 has declined over every successive year to less than 1 per cent in 2018-19. In 2019-20 so far (April-August), food inflation has averaged 2.2 per cent (2.4 per cent during the corresponding period of 2018-19). While excess supply condition relative to demand is highlighted as the key driving force behind this moderation in inflation (RBI, 2019), improvements in supply chain dynamics – wider road networks; low cost access to mobile phones enabling easier flow of information between deficit and surplus centres; speedier movement of shipments in a common market following the implementation of the goods and services tax (GST); financial inclusion and spread of micro-finance enabling easier access to working capital for small traders and retailers – may also have contributed to this moderation. While a number of studies have examined factors like production costs, international food prices, dietary patterns of consumers and government policies for the farm sector, including supply management measures to study food inflation dynamics (Gokarn, 2011; Gulati and Saini, 2013; Bandara, 2013; Bhattacharya and Sen Gupta, 2017; Anand et al., 2016), no study based on a comprehensive assessment of supply chain issues for the recent period is available. Primary survey based information nevertheless has been used in some studies to understand mark-ups charged at different levels from farm gate to retail shops, constituents of those mark-ups and inter-linkages between product and factor markets encompassing market participants (viz., farmers, traders, retailers) in explaining food inflation and its volatility (Banerji and Meenakshi, 2004; Chengappa et al., 2012; Minten et al., 2012). Literature also highlighted the influence of mark-ups between farm gate and retail prices in explaining food inflation and its volatility (Bhattacharya, 2016). Further, another study concluded that in the absence of government interventions, traders and big retailers could take advantage and amplify the inflationary impact of a negative food supply shock (Lahiri and Ghosh, 2014). Against this backdrop, to assess the key issues involved in the supply chain dynamics of agricultural markets in India and identify factors influencing mark-ups, a pan-India survey was conducted in December 20181. Agricultural mandis across 16 states2 were visited during the survey and information were sought on 16 major food crops. The survey covered around 9400 respondents including farmers, traders and retailers spread across both production and consumption centres, involving separate questionnaires for each of the respondent categories. This article presents an analysis of the key findings of this survey and also attempts to quantify the role of various supply chain factors in explaining the behaviour of multi-stage mark-ups. The remainder of the article is structured into six sections. Section II presents stylised facts about mark-ups in the context of moderation in food inflation in the recent years. Section III provides a brief review of select theoretical and empirical literature on supply chain dynamics in agricultural markets in India, followed by survey objectives in section IV. Section V explains the survey methodology. The survey findings and empirical analysis are presented in section VI. Section VII provides the concluding observations. II. Stylised Facts The difference between retail prices that consumers pay and mandi prices that farmers receive (i.e., margins or mark-ups) could vary across crops due to a host of reasons such as transaction costs and transportation costs including crop wastage during transit. Additional factors that could influence mark-ups on farm gate prices include quality of products, mandi level competition, infrastructure facilities and mandi level charges (market fees, commission charges, weighing charges, labour charges and so on). Available secondary data on food prices reveal wide variations in margins across crops and over time (Chart 1). 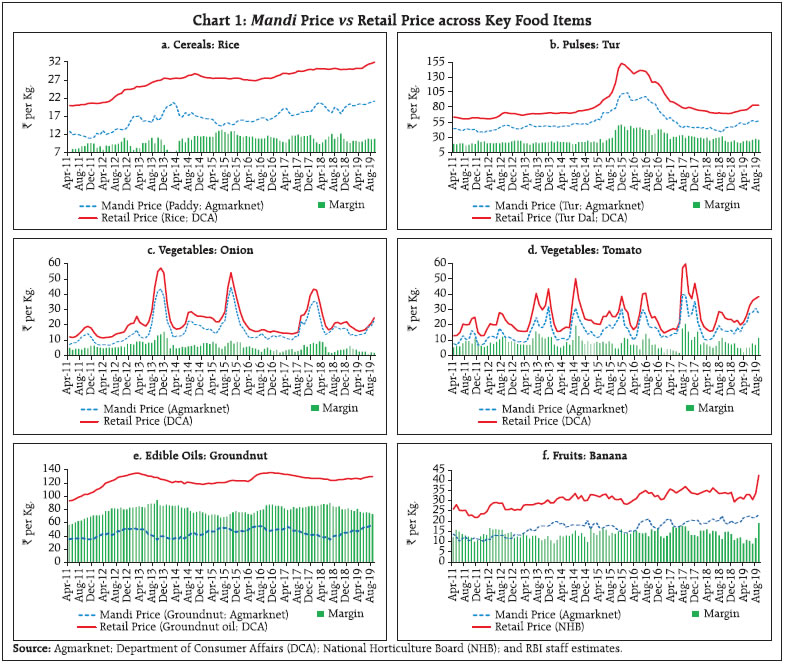
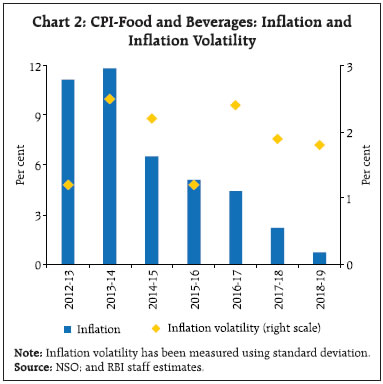 These aggregate margins, however, do not fully reflect the dynamics of margins at various stages of the supply chain (i.e., traders’ and retailers’ margins) and between production centres and consumption centres, and therefore, hinder a proper analysis of the price build up from farm gate level to retail prices. The behaviour of mark-ups assumes particular importance because even as average food inflation has declined in the recent years, volatility continues to be high (Chart 2). At a dis-aggregated level, the picture is more revealing with significant observed variations in inflation and inflation volatility across food components (Chart 3). For instance, while vegetables and pulses witnessed the maximum easing in average inflation during 2016-17 to 2019-20 (up to August) compared to 2012-13 to 2015-16, their inflation volatility remained elevated. In contrast, in the case of cereals and oils and fats, along with a fall in inflation, inflation volatility also came down significantly. III. Literature Review According to available literature on the subject, agriculture marketing in India is fraught with inefficiencies, as reflected in the wide wedge between the farm gate prices and prices paid by consumers. In this context, there are a few studies that have focused on the supply chain of various agricultural commodities using both secondary and primary data. For instance, a study on the dispersion between wholesale and retail prices of arhar in Mumbai market found that between 1999-00 and 2009-10, the price received by farmers increased by less than 5 per cent per year, whereas its wholesale and retail prices increased by more than 10 per cent (Chand, 2012). Studies using primary survey data have shown that farmers receive only a minimal share of the price paid by the consumers, while multiple intermediaries get a large proportion of the consumers’ rupee. Farmer’s share in consumer’s rupee over the last five decades have ranged between 30 per cent and 89 per cent across different crops in the country (Patel, 1971; Gandhi and Namboodiri, 2002; Sidhu et al., 2011; Chengappa et al., 2012; GoI, 2013). The farmer’s share in consumer’s rupee in the case of fruits and vegetables ranged between 32 - 68 per cent, while for non-perishables (paddy, wheat, coarse grains, pulses, oilseeds) it ranged between 40 - 89 per cent (GoI, 2013). Other studies have also shown substantial variations in market fees and commission agent fees charged across states and commodities, notably, higher for perishables as compared to staple grains (Gulati, 2009; GoI, 2013). Empirical narratives on farm gate prices compensating farmers’ costs of production generally focus on price realised by farmers in comparison to the corresponding minimum support price (MSP) (Chatterjee and Kapur, 2016; GoI, 2016; CRISIL, 2017). For instance, profit margins for pulses have fallen by 30 per cent for the farmers in 2016-17 (CRISIL, 2017). With a view to raising farm income, government has implemented several policy measures in the recent years, such as the launching of the National Agriculture Market (e-NAM), a pan-India electronic trading portal for creating a unified market for agricultural commodities and better price discovery, raising MSP by 1.5 times the cost of production for the 2018-19 kharif crops, and delisting of fruits and vegetables from the Agricultural Produce Market Committee (APMC) mandis. A study on the Karnataka model of e-NAM, Rashtriya eMarket Service (ReMS) found that farmers in Karnataka obtained a 13 per cent increase in average prices between 2013 and 2016 (Chand, 2017). On the other hand, based on the primary survey results of mandis across Karnataka, it was argued that infrastructure developments in terms of putting in place online trading platforms alone may not help farmers much unless the deeply entrenched farmer-agent-trader relationship is reformed by providing appropriate incentives to all the stakeholders (Aggarwal et al., 2017). Another study that examined direct selling of fruits and vegetables by farmers to consumers (Uzhavar Sandhai in Tamil Nadu and Rythu Bazaar in Andhra Pradesh) found that farmers get 15-40 per cent more than wholesale prices and consumers pay 15-30 per cent less than retail prices (GoI, 2011). After the delisting of fruits and vegetables from mandis, direct sale arrangements have increased in the urban areas. IV. Survey Objectives A typical agricultural market supply chain functions as a part of the complex network involving various market agents like farmers, aggregators, traders/commission agents, wholesalers, processors and retailers. The agents are linked or connected to each other by virtue of some mechanism for sharing of information, transaction volume commitments or inter-personal/informal credit-driven relationships. Chart 4 portrays a simplified version of a typical agricultural supply chain network in India. Taking into account this structure of a representative agricultural supply chain, the survey (mentioned earlier) was designed to understand the price formation process in food items and the factors that influence mark-ups on farm gate prices, the mode of transactions in mandis and the role of policy interventions in improving the supply chain so as to ensure more remunerative prices to the farmers while keeping food inflation low for the consumers. Accordingly, the survey had set the following five broad objectives: (i) What is the share of producers (farmers) in retail prices? (ii) What factors influence the mark-ups on farm gate prices – transportation, labour and storage costs; taxes/charges; number of intermediaries/middlemen; and commissions charged by agents? (iii) What is the main medium of exchange used in transactions – cash, cheque, digital/electronic payments and/or trade credit? (iv) Whether farm gate prices compensate farmers for the costs of production? and, (v) Whether and which government policies have been/will be helpful in better price realisation for farmers and stable prices for consumers? As the supply chain dynamics were expected to be different in production centres (major producing centres of the selected commodities) vis-à-vis consumption centres (major cities), the survey was conducted in both select production and consumption centres separately. V. Survey Methodology The survey covered a total of 9,403 respondents comprising farmers (2,811), traders (3,184) and retailers (3,408) spread across the consumption and production centres (Table 1). The survey was conducted in 85 mandis spread across 16 states to gather detailed information on price formation in 16 major food crops (Annex 1). The survey involved separate questionnaires for farmers, traders and retailers, included both quantitative and qualitative questions, and covered information on buying price, selling price and margins. | Table 1: Survey Coverage | | Mandi/Centre | Group/Commodities | | Respondents | Consumption Centres | Production Centres | Total | Cereals | Paddy/Rice | | Farmers | 1,147 | 1,664 | 2,811 | Pulses | Tur, Moong, Urad, Bengal gram | | Traders | 2,176 | 1,008 | 3,184 | Oilseeds | Groundnut, Soyabean | | Retailers | 2,356 | 1,052 | 3,408 | Vegetables and fruits | Onion, Potato, Tomato, Green chillies, Brinjal, Apple, Banana, Coconut | | Total | 5,679 | 3,724 | 9,403 | Spices | Turmeric, Red chillies | In view of large heterogeneity in production, crop arrivals, prices and market practices across centres/states, the entire dataset was cleaned to remove outliers. Trimming of outliers (5 per cent of the total quotations received on each side) was done to remove extreme values. The trimming was done on the calculated values of cost per kg, buying price per kg, selling price per kg and profit margin per kg for each commodity and for each group - farmers, traders and retailers - separately3. VI. Survey Findings and Empirical Analysis Survey Findings The first objective of the survey was to assess what price the farmers get as a proportion of the final price paid by the consumers, i.e., the relative bargaining power of the farmers in the price formation process for each commodity vis-a-vis the traders and the retailers. The survey findings revealed that farmers’ average share in retail prices vary between 28-78 per cent across the 14 crops4 covered in the survey - with a lower share in the case of perishables (particularly, vegetables like potato and onion) and higher share in case of non-perishables (e.g., oilseeds and spices) (Chart 5). These findings are broadly in line with studies conducted earlier by Patel (1971), Gandhi and Namboodiri (2002), and Sidhu et al. (2011). In order to validate these findings/check for the robustness of the survey results, another small sample survey was conducted in April 2019 (i.e., in the summer season) covering a sample of 197 farmers, 321 retailers and 434 traders across 12 states. The findings from the repeat survey were broadly in line with the main survey results analysed in this article, with some commodity level variations attributed to seasonality and small sample coverage (Annex 2). 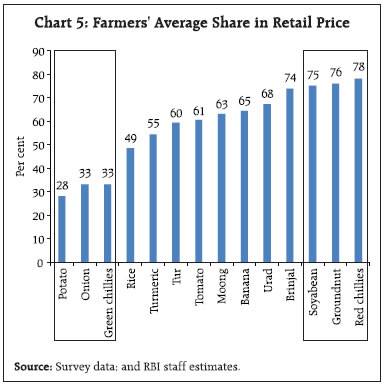
| Table 2: Factors Influencing Mark-ups | | Farmers | Traders | Retailers | | Mandi charges: 0.8 per cent | Membership fee: ₹2412/year | Shop rentals: ₹4206/month | | Commissions: 1.3 per cent | Shop rentals: ₹5106/month | Local taxes: 1.2 per cent | | | Cess/taxes: ₹0.7/kg | | | Loading/Unloading charges: ₹0.4/kg | Labour charges: ₹0.4/kg | Labour charges: ₹1.4/kg | | Packing: ₹0.5/kg | Transport cost: ₹1.0/kg | Transport cost: range and per cent of retailers | | Weighing: ₹0.3/kg | Storage cost: ₹1.0/kg | 0-5 per cent: 75 per cent | | Assaying: ₹0.3/kg | | 6-10 per cent: 21 per cent | | | | Above 10 per cent: 4 per cent | | Note: These are sample averages for the commodities and markets covered. | The second objective of the survey sought to find out the factors that influence the price formation process in agricultural commodities, i.e., from the selling price received by the farmers to the selling price charged to the consumers by the retailers. The survey findings revealed that the mark-ups are influenced by a number of factors - commissions and mandi charges; loading/unloading charges; packing, weighing and assaying charges; transport costs; shop rentals and local taxes; storage costs and membership fees; and profit margins of traders and retailers. The sensitivity of mark-ups to these factors are often commodity and region/state specific, but the findings from the survey (presented in Table 2) are in line with the existing literature (Gandhi and Namboodiri, 2002; GoI, 2011; Gulati, 2009; Minten et al., 2012). Further, it was found that the mark-ups at the production and consumption centres for the traders and the retailers were different - retailers’ margins were generally higher than the traders’ margins in consumption centres across commodities, possibly due to significant product loss at the retail stage, particularly for perishables. There was, however, no such clear pattern observed in the production centres (Chart 6). The third objective was to study which modes of payment - cash, electronic transfers, cheque, credit - are preferred for the transactions carried out at mandis and at the retail level. The survey findings highlighted cash to be the dominant mode of payment in the mandis at an aggregate level across commodities and states (Chart 7)5. The survey results further showed wide variations in the use of cash as a mode of payment across crops and by counter-parties (Chart 8). The survey also sought information on lags in receiving payments by counter-parties. The survey findings showed that there is no significant delay in payments by counter-parties in the mandis as around 80 per cent of respondents reported that the payments are made within 2 days of the completion of physical transactions of the commodities (Chart 9). The fourth objective sought to capture the farmers’ views about profitability of their occupation, i.e., whether they are able to recover their production and marketing costs. As per the qualitative responses at the aggregate level, a majority of the farmers (i.e., 62 per cent) revealed that their selling prices were higher than their costs (Chart 10). In addition, the survey findings indicated that the farmers’ perceptions about their ability to recover costs varied across commodities – relatively lower for vegetables compared to other commodities (Chart 11). The fifth objective was to elicit the feedback of farmers, retailers and traders on the government policies which have helped them, or which can help them in the future, if implemented. A majority of the farmers were of the view that MSPs for crops and readily available market information are helpful in realising better prices. Farmers also revealed that reliable weather forecasts, improved storage facilities and government advisory on crops could help them take better cropping decisions (Chart 12). On the availability of information regarding prevailing prices of commodities at mandis, a majority of farmers reported that they were aware of the prices before taking their produce to the mandis and the major source of this information is other farmers and traders in their contact group (Chart 13).
A majority of the traders reported that assaying of products and de-notification of certain products from APMC by the government have helped them and they were of the view that improving storage facilities at the mandis and allowing free trade could help them further (Chart 14). A majority of the retailers surveyed were of the view that government’s supply management measures and better availability of information on the supply-demand situation in the market could help in arresting price pressures (Chart 15). The retailers, while expressing their views on policies that generally help them as well as their customers, also presented their opinion on the factors that determine the final selling prices charged by them to the consumers (Chart 16). A majority of retailers viewed that prevailing market prices and the costs incurred in buying/delivery of products from farmers/ traders determine their selling prices. Further, prices paid and costs incurred are the two major factors that they consider while changing their selling prices to final consumers.
Empirical Analysis An empirical exercise was attempted to study the factors that could influence the traders’ and retailers’ mark-ups using the survey data collected. The following multivariate regression equation was estimated using the Ordinary Least Squares (OLS) method, pooling data across crops and states: Mic= α + β1 Ii + β2SocioEcoi + β3Agrii + β4 Cc + β5 Si + εic where, i and c represent ‘state’ and ‘commodity’, respectively. Here, Mic is the mark-up, defined as selling price less cost price as a percentage of the cost price for traders and retailers. Ii represents infrastructure facilities at the state level, which include tele-density per 100 persons, ratio of number of agricultural markets to the total gross cropped area, ratio of cold storages available to the area under fruits and vegetables, ratio of length of roads to total gross cropped area and ratio of number of rural bank branches to total gross cropped area. SocioEcoi indicates socio-economic characteristics of the states, represented by literacy rate and per capita income. Agrii indicates agricultural variables, which are percentage of irrigated area to the total cropped area and rainfall deviation from long period average (LPA) (dummy variable taking value ‘1’ for negative deviation and ‘0’ otherwise). Cc and Si are the vectors of crop and state dummies, respectively, and εic is the residual. The main model regresses the trader’s and retailers’ mark-ups on infrastructure, socio-economic and agricultural variables, controlling for crop and state dummies. Since agriculture is a state subject, policies governing agricultural trade and mandi fees vary across states. State dummies were introduced to capture this source of variation. Further, separate models were estimated for perishable and non-perishable commodities. 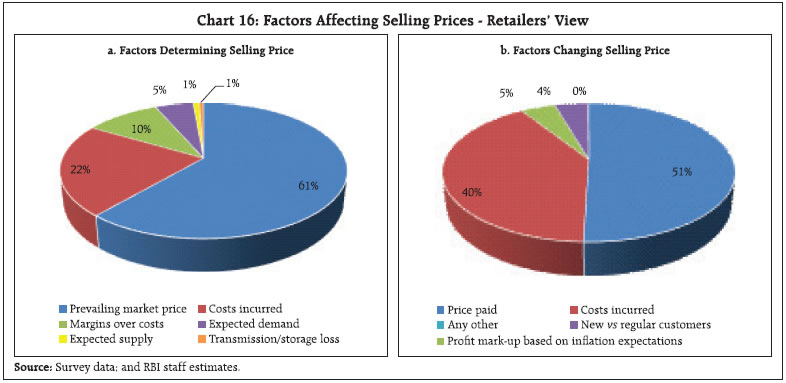
| Table 3: Results of the Econometric Analysis | | | Traders | Retailers | | Dependent variable: Mark-up | Full Sample | Perishable | Non-Perishable | Full Sample | Perishable | Non-Perishable | | Tele-density | -1.27*** | -1.85** | -0.81 | -0.36* | -0.75* | -0.36 | | | (0.49) | (0.81) | (0.62) | (0.29) | (0.42) | (0.30) | | Road density | -0.003* | -0.006 | -0.002 | -0.001 | -0.004*** | -0.0007 | | | (0.002) | (0.004) | (0.001) | (0.001) | (0.002) | (0.001) | | Market density | -0.167** | -0.26* | -0.09 | -0.095* | -0.17 | -0.10** | | | (.079) | (0.15) | (0.09) | (0.05) | (0.34) | (0.05) | | Per-capita income | 0.63*** | 0.96*** | 0.38* | 0.08 | 0.32* | 0.05 | | | (0.18) | (0.29) | (0.23) | (0.11) | (0.19) | (0.11) | | Rainfall deviation Dummy when negative | 10.3** | 19.83** | 3.74 | 1.97 | 5.8 | 6.78 | | | (4.7) | (9.79) | (4.63) | (4.62) | (9.6) | (4.07) | | Irrigation intensity | -1.21** | -1.99** | -0.63 | -0.453 | -0.55 | 0.37 | | | (0.48) | (0.94) | (0.52) | (0.31) | (0.64) | (0.30) | | Literacy rate | -0.74 | -1.46 | -0.28 | -1.48*** | -0.28 | -1.74*** | | | (0.55) | (1.01) | (0.64) | (0.49) | (0.83) | (0.45) | | Commodity dummy | Yes | Yes | Yes | Yes | Yes | Yes | | State dummy | Yes | Yes | Yes | Yes | Yes | Yes | | R-squared | 0.42 | 0.38 | 0.39 | 0.54 | 0.28 | 0.31 | | Number of observations | 199 | 79 | 120 | 206 | 78 | 128 | ***,** and * represent 1 per cent, 5 per cent and 10 per cent levels of significance, respectively.
Note: Figures in parentheses indicate robust standard errors. | The empirical results for the full sample indicate that availability of better infrastructure facilities, such as tele-density, all-weather roads and number of markets relative to gross cropped area reduces the mark-ups of both the traders and the retailers (Table 3). Improved infrastructure facilities not only provide direct market access to the farmers but also raise the degree of competition among traders and retailers, which in turn reduces their mark-ups. Agricultural variables like deficiency in rainfall positively influence the trader’s mark-ups, while irrigation intensity (i.e., the share of irrigated area in total cropped area) has a negative influence. Deficiency in water availability for irrigation has an adverse effect on yield and quality of the produce, which in turn leads to lower bargaining power of the farmers. While increase in per capita income influences traders’ mark-up positively, literacy rate is negatively associated with retailers’ mark-up. The negative influence of literacy rate on retailers’ mark-up could possibly reflect increased consumer awareness about prevailing prices and alternative buying options like multiple retail outlets and online grocery markets. In the case of perishable commodities, infrastructure facilities, such as tele-density, all-weather roads and the number of available markets to gross cropped area reduce the mark-ups of both the traders and the retailers. Agricultural variables, rainfall deviation and irrigation intensity influence the traders’ mark-up for the perishable commodities but not for the non-perishable commodities. The possible reason could be the presence of government procurement of staple grains. Additionally, for perishables, increase in per capita income positively influences the mark-ups of both the traders and the retailers. Research has shown that an increase in per capita income drove the demand for high-value commodities, such as fruits, vegetables, meat and dairy products (Rao et al., 2006). Better access to transportation, market infrastructure and communication facilities has been highlighted as a factor behind improving farmer’s price realisation in the case of rice and wheat (Chatterjee and Kapur, 2016; Negi et al., 2018; Goyal, 2010). Using mandi level data6 across states and district level procurement data, a study showed that geographies where the mandi concentration is higher, farmers are more likely to experience higher prices (Chatterjee and Kapur, 2016). Using data from the NSSO 70th Round and Census 2011 data7, it was also found that access to information and better transportation network result in better prices for farmers (Negi et al., 2018). VII. Concluding Observations Average food inflation in India has moderated significantly since 2013-14. Available macro-level data on drivers of food inflation – production, arrivals, exports/imports, stocks, MSPs, rainfall/sowing pattern, consumption pattern and demand, input costs and global food price trends – at times do not help explain large price differences between mandis/ wholesale markets and retail shops, warranting collection of survey based information on supply chain dynamics to understand the determinants of mark-ups, which influence both the level of as well as volatility in food inflation. The empirical findings of this article based on data collected through a pan-India survey of farmers, traders and retailers provide useful insights on certain important aspects of supply chain dynamics in the agricultural markets in India. The survey findings revealed that farmers’ average share in retail prices vary across crops between a range of 28 per cent and 78 per cent. The traders’ and retailers’ mark-ups were generally found to be higher for perishables than non-perishables. Further, it was observed that the margins for traders and retailers varied across production/ consumption centres, with the retailers’ margins generally remaining higher than the traders’ margins in consumption centres. Higher retailers’ margins could be partly due to significant product loss in the retail marketing stages, particularly for perishables. Further, the mark-ups are influenced by a number of factors, which vary across market participants. For example, commissions and mandi charges comprise a major share of the costs borne by farmers, the others being loading/unloading charges and packing, weighing and assaying charges. Labour charges, transport costs, shop rentals and local taxes constitute some of the key cost components for traders and retailers, along with storage costs and membership fees in the case of traders. Cash was reported in the survey as the dominant mode of payments in mandis. As regards farmers’ perceptions, 62 per cent of the farmers revealed that their selling prices were higher than their production costs. In addition, with regard to government policies, farmers stated that MSPs and readily available market information benefit them in realising better prices. Farmers also revealed that reliable weather forecasts, improved storage facilities and government advisory on crops could help them undertake better cropping decisions. On the other hand, majority of traders viewed that improving storage facility and allowing free trade would be helpful, while most retailers believed that government’s supply management measures along with better availability of information would help check food price pressures. Empirical results show that supply-side improvements like road network, market density, tele-density, irrigation facilities and overall literacy rate in the country help reduce mark-ups, while rainfall deficiency and increase in per-capita income push up mark-ups. Since multi-stage mark-ups across crops play an important role in determining the trajectory of food inflation and its volatility, primary survey based data collected to understand the formation of mark-ups, particularly during periods of supply shocks/behavioural shifts in consumption pattern can help improve the assessment of food inflation dynamics. References Aggarwal, N., S. Jain and S. Narayanan (2017), ‘The Long Road to Transformation of Agricultural Markets in India: Lessons from Karnataka’, Economic & Political Weekly, Vol. 52 (41), pp. 47-55. Anand, R., N. Kumar and V. Tulin (2016), ‘Understanding India’s Food Inflation: The Role of Demand and Supply Factors’, IMF Working Paper, WP/16/2. Bandara, J.S. (2013), ‘What is Driving India’s Food Inflation? A Survey of Recent Evidence’, South Asia Economic Journal, Vol. 14(1), pp. 127–156. Banerji, A., and J.V. Meenakshi (2004), ‘Buyer Collusion and Efficiency of Government Intervention in Wheat Markets in Northern India: An Asymmetric Structural Auctions Analysis’, American Journal of Agricultural Economics, Vol. 86 (1), pp. 236–253. Bhattacharya, R. (2016), ‘How does Supply Chain Distortion Affect Food Inflation in India’, NIPFP Working Paper Series, No. 173, National Institute of Public Finance and Policy, New Delhi. Bhattacharya, R., and A. Sen Gupta (2017), ‘Drivers and Impact of Food Inflation in India’, MPRA Paper No. 88721. Chand, R. (2012), ‘Development Policies and Agricultural Markets’, Economic & Political Weekly, Vol. 47 (52), pp. 53-63. Chand, R. (2017), ‘Doubling Farmers’ Income: Rationale, Strategy, Prospects and Action Plan’, NITI Policy Paper No. 1, Government of India, New Delhi. Chatterjee, S., and D. Kapur (2016), ‘Understanding Price Variation in Agricultural Commodities in India: MSP, Government Procurement, and Agriculture Markets’, India Policy Forum, National Council of Applied Economic Research, New Delhi. Chengappa, P.G., A.V. Manjunatha, V. Dimble and K. Shah (2012), ‘Competitive Assessment of Onion Markets in India’, Report prepared for Competition Commission of India, Institute for Social and Economic Change, Bengaluru. CRISIL (2017), ‘Pulses and Rhythms - Analysing Volatility, Cyclicality and the Cobweb Phenomenon in Prices’, Credit Rating Information Services of India Limited, Mumbai. Gandhi, V.P., and N.V. Namboodiri (2002), ‘Fruit and Vegetable Marketing and its Efficiency in India: A Study of Wholesale Markets in the Ahmedabad Area’, Indian Institute of Management, Ahmedabad. GoI (2011), ‘Report of the Working Group on Agricultural Marketing Infrastructure, Secondary Agriculture and Policy Required for Internal and External Trade’, Agriculture Division, Planning Commission, Government of India, New Delhi. GoI (2013), ‘Final Report of Committee of State Ministers, In-charge of Agriculture Marketing to Promote Reforms’, Ministry of Agriculture, Department of Agriculture and Co-operation, Government of India, New Delhi. GoI (2016), ‘Evaluation Study on Efficacy of Minimum Support Prices (MSP) on Farmers’, NITI Aayog Report, Government of India, New Delhi. Gokarn, S. (2011), ‘The Price of Protein’, Macroeconomics and Finance in Emerging Market Economies, Vol. 4 (2), pp. 327-335. Goyal, A. (2010), ‘Information, Direct Access to Farmers, and Rural Market Performance in Central India’, American Economic Journal: Applied Economics, Vol. 2 (3), pp. 22-45. Gulati, A. (2009), ‘Emerging Trends in Indian Agriculture: What Can We Learn from these?’ Agricultural Economics Research Review, Vol. 22, pp. 171-184. Gulati, A., and S. Saini (2013), ‘Taming Food Inflation in India’, Discussion Paper No. 4, Commission for Agricultural Costs and Prices, Ministry of Agriculture. Lahiri, H., and A.N. Ghosh (2014), ‘Government’s Role in Controlling Food Inflation’, in Ghosh, A., and A. Karmakar (eds.) Analytical Issues in Trade, Development and Finance, India Studies in Business and Economics, Springer India. Minten, B., A. Vandeplas and J. Swinnen (2012), ‘Regulations, Brokers, and Interlinkages: The Institutional Organisation of Wholesale Markets in India’, Journal of Development Studies, Vol. 48 (7), pp. 864-886. Negi, D.S, P.S. Birthal, D. Roy and M.T. Khan (2018), ‘Farmers’ Choice of Market Channels and Producer Prices in India: Role of Transportation and Communication Networks’, Food Policy, Vol. 81, pp. 106-121. Patel, B.B. (1971), ‘Price Spread and Farmer’s Share: Oil and Groundnut in Gujarat’, Economic & Political Weekly, Vol. 6 (29), pp. 1435-1440. Rao, P.P., P.S. Birthal and P.K. Joshi (2006), ‘Diversification towards High Value Agriculture: Role of Urbanisation and Infrastructure’, Economic & Political Weekly, Vol. 41(26), pp. 2747-2753 RBI (2019), ‘Reserve Bank of India Annual Report 2018-19’, Mumbai. Sidhu, R.S., M.S. Sidhu and J.M. Singh (2011), ‘Marketing Efficiency of Green Peas under Different Supply Chains in Punjab’, Agricultural Economics Research Review, Vol. 24, pp. 267-273.
Annex 1: List of States and Centres | State/ Union Territory | Consumption Centre | Production Centre | | Andhra Pradesh | Visakhapatanam | Guntur, Kadapa, Kandukuru, Madanapalle, Vijayawada | | Assam | Guwahati | Boko | | Bihar | Gaya, Patna | Bihar Sharif, Patna Market | | Gujarat | Ahmedabad, Gandhinagar | Anand, Bahadurpur, Bharuch, Deesa, Junagadh, Mahuva, Mehsana | | Himachal Pradesh | | Shimla | | Jammu and Kashmir | Jammu | | | Karnataka | Hubballi, Bengaluru | Bidar, Byadagi, Chintamani, Chitradurga, Gadag, Gulbarga | | Kerala | Kochi, Thiruvananthapuram | Idukki, Kollam, Mallapuram | | Madhya Pradesh | Bhopal, Indore | Chhatarpur, Chindwara, Dhar, Khandwa, Rajpur | | Maharashtra | Mumbai, Nagpur, Pune | Jalgaon, Kolhapur, Lasalgaon, Neri | | New Delhi | Azadpur | | | Odisha | Bhubaneswar, Rourkela | Anandpur, Balanga, Baripada | | Punjab | Amritsar, Chandigarh | Jalandhar, Sangrur | | Rajasthan | Jaipur, Kota | Bhawani, Merta | | Tamil Nadu | Chennai, Coimbatore | Erode, Tiruchirappalli, Ulundurpet, Vandavasi | | Telangana | Hyderabad, Enumamula | Enumamula, Karimnagar, Nizamabad | | Uttar Pradesh | Lucknow, Varanasi | Agra, Banda, Lalitpur, Shajahanpur | | West Bengal | Asansol, Kolkata | Bhagawangola, Singur | | Note: Although the sample covered 18 states, due to unavailability of farmers in select mandis in New Delhi and Himachal Pradesh, they were excluded from the analysis of farmers’ share in consumer prices. |
Annex 2: Major Findings of the Repeat Survey
| Table A1: Factors Influencing Mark-ups | | Farmers | Traders | Retailers | | Mandi charges: ₹3.7/Kg | Membership fee: ₹1692/year | Shop rentals: ₹3791/month | | Commissions: ₹0.4/Kg | Shop rentals: ₹8628/month | Local taxes: ₹0.5/Kg | | | Cess/taxes: ₹0.1/kg | | | Loading/Unloading charges: ₹0.6/kg | Labour charges: ₹0.6/kg | Labour charges: ₹0.4/kg | | Packing: ₹0.3/kg | Transport cost: ₹1.1/kg | Transport cost: ₹0.6/Kg | | Weighing: ₹0.2/kg | Storage cost: ₹0.5/kg | | | Assaying: ₹0.1/kg | | | | Note: These are sample averages for the commodities and markets covered. |
|