The current environment of stalled multilateral negotiations has led to a spurt in regional trade agreements and India too has moulded its foreign trade policy to remain in sync with the changing realities. This article evaluates the impact of trade agreements (TAs) on India’s trade to gain insights on how it has evolved with its trade agreement partner countries relative to non-partner countries. The study utilises difference in difference approach to estimate the increment of trade flows of India with partner countries. After the conclusion of the trade agreement, growth in trade flows was witnessed between India and the partner countries. One positive impact of TAs has been in the form of increased shipments of capital goods and industrial supplies from trade partner economies. This indirectly would have contributed in enhancing the productive capacity in the country. Introduction After the end of World War II, there was a move towards a multilateral system to facilitate global commerce and countries took initiatives to eliminate trade barriers. With the early efforts in the General Agreement on Tariffs and Trade (GATT) and subsequently under its successor, the World Trade Organisation (WTO), the average value of tariffs in force around the world declined by 85 per cent compared to 19471. Notwithstanding the benefits arising from multilateral system, the current environment of stalled multilateral negotiations has led to a spurt in regional trade agreements wherein countries have moved towards bilateralism in place of multilateralism. India too has moulded its foreign trade policy to remain in sync with the changing realities. Accordingly, India has signed preferential access, economic cooperation and TAs with about 54 individual countries. Against this backdrop this article evaluates the impact of trade agreements on India’s trade. By dissecting the impact separately for exports, imports and overall trade, the article attempts to gain insights on how India’s trade has evolved with its trade agreement partner countries relative to non-partner countries. Historical backdrop along with stylised facts pertaining to trade agreements are set out in Section II. Section III provides a brief review of the relevant literature. Current status regarding India’s TAs along with empirical analysis are presented in Section IV. Section V sets out the concluding observations. II. Historical Backdrop and Stylised Facts Trade agreements are arrangements by which countries provide preferential treatment to each other and aid greater ease-of-trade by elimination of tariffs and other trade barriers. TAs can be between two or more countries that primarily agree to reduce or eliminate tariff and non-tariff barriers on substantial trade between them. Formal TAs may cover a spectrum of arrangements, from small margins of tariff preference to full scale economic integration. TAs can take several configurations which can be Partial Scope Agreement (PSA), Free Trade Agreement (FTA), Custom Union (CU), Common Market or Economic Union. Typically, trade agreements aim to reduce trade barriers between the member countries which entails discrimination against trade with non-member countries. By design, TAs have positive as well as negative externalities. TAs originated primarily among European countries. At the start, TAs had restricted presence and were mainly confined to the geographic influence of the colonial empires and generally took the form of bilateral commercial treaties. The surge in cross-border movement of goods in the nineteenth century led to greater openness and liberalisation and simultaneously altered the nature and scope of bilateral trade treaties. The Cobden-Chevalier Treaty between Britain and France in 1860 may be considered as the pioneer in this regard as for the first time it contained most favoured nation2 (MFN) clause and led to significant reciprocal tariff reductions between two countries. The Cobden-Chevalier Treaty triggered a spate of bilateral negotiations among other European economic powers. This proved to be a precursor to the competitive trade liberalisation among countries which followed later. Since this new network of treaties was both reciprocal and inclusive (via the MFN clause), it was also essentially interlocking - creating an early form of plurilateral preferential trade agreement (i.e., unconditional MFN treatment among all treaty-signers) and foreshadowing the basic structure of the multilateral system that took shape a century later (Brown, 2003). These bilateral agreements laid the foundations for much of the GATT system after the Second World War. With the formation of the GATT in 1947, the idea of a wider multilateral agreement moved to the forefront of international trade relations. Nonetheless, the initial signatories to GATT system were just 23 countries. This later evolved to the near universal membership of the WTO. However, the emergence of a multilateral system in the form of GATT did not diminish the significance of bilateral or regional agreements to further international trade relations. Notwithstanding the presence of a multilateral system, the impetus for bilateral/plurilateral agreements outside its purview, especially in Europe, resurfaced within a short span of time. The upshot of this development was concurrent advancement witnessed in both regionalism and multilateralism. In fact, Article XXIV of GATT 1994 encompasses the statutory backing for trade agreements. This Article exempts member states from the Most-Favoured Nation (MFN) principle and permits mutual imports among countries preferentially through the ratification of a trade agreement. The WTO permits three types of trade agreements. These are: -
Custom unions and free trade agreements sanctioned under Article XXIV; -
Agreements between developing countries formed under the Enabling Clause that allows partial preferential treatment; and -
Agreements under the Generalised System of Preferences (GSP) that allow developed countries to grant preferential treatment to developing countries. The specific conditions under Article XXIV of the GATT permitting TAs are: -
FTA members shall not erect higher or more restrictive tariff or non-tariff barriers on trade with non-members than existed prior to the formation of the FTA. -
Elimination of tariffs and other trade restrictions be applied to substantially all the trade between the constituent territories in products originating in such territories. -
Elimination of duties and other trade restrictions on trade within the TA to be accomplished within a reasonable length of time, meaning a period of no longer than ten years. -
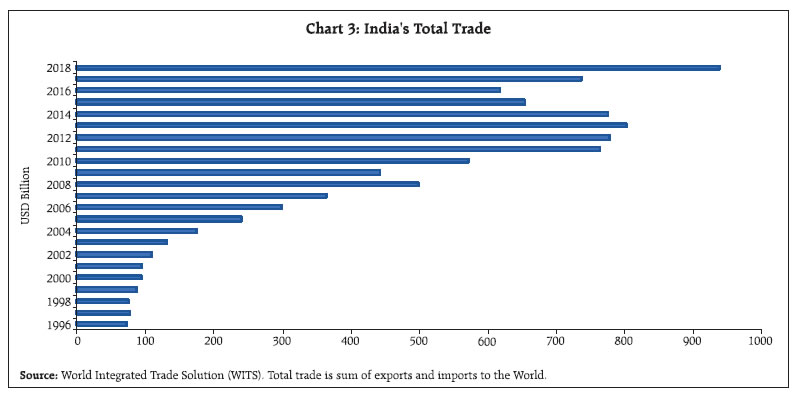
In addition, an Enabling Clause, allows developing countries to form preferential trading arrangements without adhering to the conditions under Article XXIV. There are currently 164 WTO members, the latest being Liberia joining in July 20183 and majority of the members are participants in at least one TA. TAs cover more than half of international trade and operate alongside global multilateral agreements under the WTO. From 1950s onwards, the number of active TAs increased more or less continuously to almost 70 in 1990. Thereafter, TA activity accelerated noticeably, with the number of TAs more than doubling over the next five years and more than quadrupling until 2010 (WTO, 2011). As of September 3, 2019, 695 TAs have been notified to the WTO, out of which 481 are in force (Chart 1). The rise in the absolute number of TAs and its acceleration from the early 1990s onwards, is due to the fact that an increasing number of countries have turned towards outward-oriented policies. This has spurred the demand for trade agreements compared with previous time periods that were dominated by inward-looking development strategies. 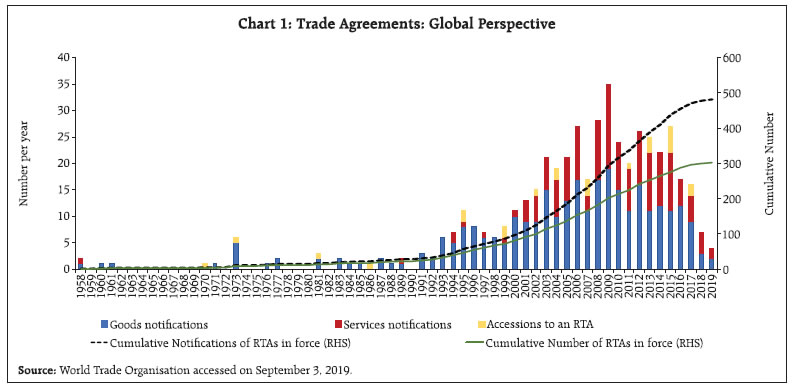 III. Literature Review Trade agreements have drawn the attention of researchers since the early 1950s. The traditional economic theory has sought to examine the welfare impact of a TA on each member country, the bloc as a whole and the rest of the world. The outcomes of TAs on the global economy are not unequivocally positive. TAs may contribute to expansion of trade and global welfare, or may lead to diminished welfare. The overall welfare depends on whether these agreements lead to creation of new trade patterns based on comparative advantage or to diversion of trade from a more competitive non-member to a member of the trade bloc. Impact analysis of TAs has been done either ex-post with historical data or has been based on ex-ante predictions. Generally ex-post studies have employed gravity equation to analyse the impact of TAs in boosting trade (Tinbergen (1962) and Bergstrand (1985)). It was first investigated by Jacob Viner (1950), who introduced the concepts of trade creation and trade diversion. Viner defined trade creation as the situation where a member of a preferential trading bloc has a comparative advantage in producing a product and is now able to sell it to its free trade area partners because trade barriers have been removed. Trade diversion is the welfare reduction in trade after the formation of free trade agreement that replaces lower cost imports from a country outside the trading bloc (Annex I). Viner in his seminal paper showed that the net effect of trade liberalisation on a regional basis was not unambiguously welfare enhancing. Meade (1955) presented the first welfare theoretic analysis of trade blocs in a general equilibrium model. Meade’s model has since been extended to decipher the welfare impact of TAs with significant contributions from Lipsey (1958), Mundell (1964), Vanek (1965), Corden (1972) and McMillan and McCann (1981). Tinbergen (1962) used the gravity model to analyse the impact of British Commonwealth on trade for member countries. The study concluded that the ‘average treatment effects’ of TAs on trade flows are economically insignificant. The paper found that TAs lead to only 5 per cent higher trade flows for member countries. Various authors after Tinbergen such as Aitken (1973), Abrams (1980), and Brada and Mendez (1983) found that TAs have a significant impact on trade flows among members, whereas studies by Bergstrand (1985) and Frankel, Stein and Wei (1995) concluded that the effect is insignificant. As per the theoretical literature on TAs, a particular agreement may be classified as beneficial or harmful depending upon the countries involved and the extent of trade created relative to the trade which is diverted (Panagariya, 2000). The empirical framework estimating these effects is particularly important. Burfisher et. al., (2001) noted that the impact of TAs is essentially an empirical issue that must be settled by data analysis. Krugman (1991) analysed the relative merits of regional TAs. The article analysed the variation in the global welfare with the changes in the number of TAs. The article notes that when the number of TAs is large, and they decline to a much smaller number then under such a scenario, welfare will reduce. However, the largest increase in welfare is when the world has only one TA which includes all the countries and the world moves towards free trade. Krugman concluded that because most TAs are among natural trading partners, the likelihood of trade diversion is small and the move towards regional free trade would do more good than bad between the members of free trade area. In case of India, studies have analysed the impact of TAs using different empirical specifications ranging from simple pre-post evaluation to analysis within the GTAP (Global Trade Analysis Project)4 and SMART5 frameworks. Studies based on ex-ante analysis of the impact of India-ASEAN (Association of Southeast Asian Nations) FTA with a full trade liberalisation scenario had concluded that India’s allocative efficiency will increase, but the terms of trade effect will worsen continuously and remain negative (Ahmed, 2010 and Sikdar and Nag 2011). Studies based on ex-post analysis concluded that post India-ASEAN FTA, India’s exports to ASEAN increased substantially, with the largest accesses gained in Thailand, Cambodia, Vietnam, Malaysia, the Philippines and the Lao People’s Democratic Republic. However, there was no significant impact of India-ASEAN TA with respect to intra-ASEAN trade (Venkatesh and Bhattacharyya (2014)). A study by Seshadri (2015) on India-Korea TA concluded that progressive tariff reductions resulted in steady improvement in TA utilisation. However, India’s overall exports to Korea did not gain and the growth was confined to certain sectors. Studies on India Sri-Lanka FTA found modest increase in trade flows between the two countries with diversification in the export baskets of both the partners (Mukherji et al. (2002), Weerakoon et al. (2006), Joshi (2012)). However, a recent study by Saraswat et al. (2018) argued that India’s exports have been more responsive to income changes in comparison with price changes such as a tariff cut or elimination. There is also high underutilisation of the TAs by Indian traders (approximated to be less than 25 per cent) which is due to a myriad of reasons such as lack of information on the TAs, low margins of preference and administrative costs associated with the rules of origin. Thus, the impact of TAs particularly in terms of increase in trade is ambiguous. In sum, the existing literature has shown a mixed impact of TAs on external trade and welfare. A TA will lead to reallocation of resources and hence, there will be some amount of trade creation and trade diversion. However, each of these studies brings out the time-specific and region-specific factors in determining this impact. IV. India and Trade Agreements India has entered into bilateral and regional trading agreements over the years. These agreements, besides offering preferential tariff rates on the trade of goods among member countries, also provide wider economic cooperation in the fields of trade in services, investment, and intellectual property. Few of these TAs have gone beyond tariff cuts in trade in goods and encompass other components like liberalisation in services and investment. The first TA of which India became a member was the Bangkok Agreement in 1975. In 2005, this regional initiative between developing economies was re-incarnated as Asia Pacific Trade Agreement (APTA). India’s first bilateral TA, the India-Sri Lanka FTA (ISFTA) was signed in December 1998 and came into force in the year 2001. Subsequently India implemented South Asian Free Trade Agreement (SAFTA) in 2004, Comprehensive Economic Cooperation Agreement (CECA) with Singapore in 2005, Indo- ASEAN FTA in 2010, Indo-Korea Comprehensive Economic Partnership Agreement (CEPA) in 2010, Indo-Malaysia CECA and Indo-Japan CEPA in 2011. SAARC Preferential Trading Agreement (SAPTA) is a preferential agreement between India and other South Asian Association for Regional Cooperation (SAARC) countries. In the past decade India’s trade policy has seen a marked shift towards regionalism. India has preferential access, economic cooperation and FTAs with about 54 individual countries6. India has signed bilateral trade deals in the form of CEPA/ CECA/ FTA/ Preferential Trade Agreements (PTAs) with around 18 groups/countries7. The preferential arrangement/ plans under which India was receiving tariff preferences are the Generalised System of Preferences (GSP) and the Global System of Trade Preferences (GSTP)8. Presently, there are 43-member countries of the GSTP and India has exchanged tariff concessions with 12 countries on a limited number of products (Chart 2). India and several Asian countries have signed a CECA, which is an integrated package of agreements encompassing trade in goods, services, investments and economic co-operations in education, science and technology, air services and intellectual property. These agreements prescribe rules of origin that must be fulfilled for exports to be eligible for tariff preference. Table 1 provides a broad overview of India’s major trade agreements. India’s TAs have become increasingly prevalent since the early 1990s. The crucial hypothesis is to examine whether these regional trading agreements translated into desired outcomes in terms of growing trade9 between India and its agreement partners during the subsequent period. in value terms, India’s total trade in the last two decades with the world has increased substantially (Chart 3). 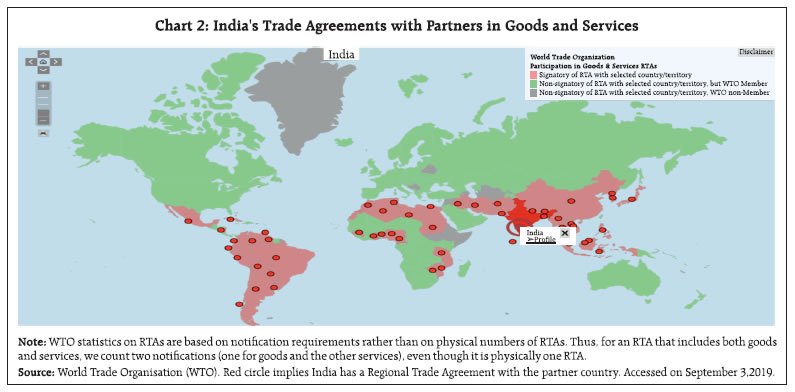
| Table 1: Major Bilateral and Regional Trade Agreements of India | | S. No. | Acronym | Groupings | Member Countries | FTAs/PTAs | | No. | Names | | 1 | APTA | Asia Pacific Trade Agreement | 6 | Bangladesh, China, India, Laos, Republic of Korea, Sri Lanka | Partial Scope Agreement (PSA) and Economic Integration Agreement (EIA) | | 2 | India ASEAN TIG | India ASEAN Trade in Goods Agreement | 11 | Brunei, Cambodia, India, Indonesia, Laos, Malaysia, Myanmar, Philippines, Singapore, Thailand and Vietnam | FTA and EIA | | 3 | BIMSTEC | Bangladesh, India, Myanmar, Sri Lanka, Thailand Economic Cooperation | 7 | Bangladesh, Bhutan, India, Myanmar, Nepal, Sri Lanka and Thailand | Under Negotiation | | 4 | GSTP | Global System of Trade Preferences | 43 | Algeria, Argentina, Bangladesh, Benin, Bolivia, Brazil, Cameroon, Chile, Columbia, Cuba, Democratic People’s Republic of Korea, Ecuador, Egypt, Ghana, Guinea, Guyana, India, Indonesia, Iran Iraq, Libya, Malaysia, Mexico. Morocco, Mozambique, Myanmar, Nicaragua, Nigeria, Pakistan, Peru, Philippines, Republic of Korea, Romania, Singapore, Sri Lanka, Sudan, Thailand, Trinidad and Tobago, Tunisia, Tanzania, Venezuela, Vietnam, Zimbabwe. | PSA | | 5 | MERCOSUR India | Southern Common Market India | 5 | Argentina, Brazil, Paraguay, Uruguay and India | PSA | | 6 | SAFTA | South Asia Free Trade Agreement | 8 | Afghanistan, Bangladesh, Bhutan, India, Maldives, Nepal, Pakistan and Sri Lanka | FTA | | 7 | ISLFTA | Indo Sri Lanka FTA | 2 | India and Sri Lanka, | FTA | | 8 | IMCECA | Indo Malaysia CECA | 2 | India and Malaysia | FTA and EIA | | 9 | ISCECA | India Singapore CECA | 2 | India and Singapore | FTA and EIA | | 10 | JICEPA | Japan India CEPA | 2 | India and Japan | FTA and EIA | | 11 | IKCEPA | India Korea CEPA | 2 | India and South Korea | FTA | Source: Ministry of Commerce, Government of India.
World Trade Organisation. |
 A disaggregation of India’s trade with its agreement partner and non-partner countries shows that inter-linkages between India and its TA partners have strengthened with a substantial and persistent upward trend in the last two decades (Chart 4). To gain further insights into the impact of TAs on India’s trade with its agreement partner countries, an analysis of pre/post effect of TAs is attempted. The study utilises ‘difference in difference’10 method to analyse the impact using panel data. The hypotheses tested for this study relate to whether these agreements led to higher trade generally and particularly how exports and imports have progressed. This empirical specification tries to differentiate the trade linkages between member countries and non-member countries. The study covers a total of 31 countries, out of which 18 countries are part of the treatment group and 13 countries are part of the control group. The treatment group consists of those countries with which India has a TA. The control group consists of countries with which India does not have a TA. In order to choose variables that determine the trade trend we adopt the inference from gravity model (Tinbergen’s paper (1962)). The traditional gravity model is based on the theory that bilateral trade between two countries is directly related to the size of these countries (measured by GDP) and inversely related to distance between the two countries. Based on these micro foundations there have been many specifications of the gravity models that researchers have used. 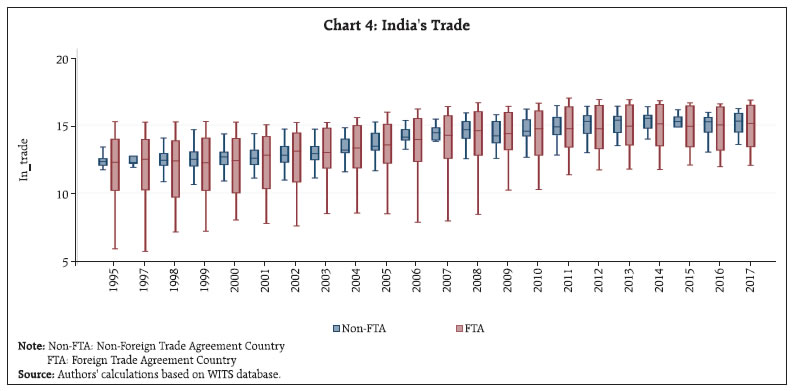 For this study we assume that GDP of the partner country and GDP of India helps in determining the size of the countries’ economy and hence the demand for commodities. We also control for the price sensitivity by taking the bilateral exchange rate of the countries. The study undertakes analysis for agreements signed since 2000 so the period studied in the analysis is from 1996 till the latest available data for all countries, i.e., 2017. Data on GDP and exchange rates are taken from the World Bank and IMF database, respectively. Data on trade flows of countries are taken from World Bank’s World Integrated Trade Solution (WITS) database. The empirical specification is as follows: where, Tr: represents total trade with partner country in US Dollar; Exp: India’s exports to partner country in US Dollar; Imp: India’s imports from partner country in US Dollar; GDP_p: Partner country’s per capita gross domestic product in US Dollar; GDP_I: India’s per capita gross domestic product in US Dollar; ER: India’s bilateral exchange rate with partner country; Country dummy: Dummy variable with value 1 for countries with which India has a TA and 0 otherwise; Year dummy: Dummy variable takes value 1 from the year the agreement came into force and 0 otherwise. All the variables in the above equation are taken in log terms. In equation 1, the coefficients of GDP for partner country and for India are positive which indicates that trade increases with the size of the economy (Table 2). The results also indicate that supply side effect for the exporting countries dominates demand side effect. This is so because countries with higher GDP are able to export may be due to higher supply (relative to their domestic demand). The opposite holds true for the country which imports implying that higher domestic demand leads to larger imports thus resulting in higher trade for countries with higher GDP. The interaction term of dummies is positive and statistically significant which reflects that overall effect of India’s TA on trade is positive. We decompose the difference-in-difference equation and try to analyse the impact on exports and imports separately. Equation 2 provides estimation on the dynamics of India’s exports which shows that a 1 per cent increase in the GDP of trade partners results in a 0.33 per cent increase in India’s exports. This result is not conditional on the presence of a TA. The coefficient of exchange rate term reflects that when the exchange rate increases by 1 per cent (i.e., Indian currency depreciates), India’s exports increase by 0.055 per cent but elasticity is insignificant. In equation 2, the coefficient of interest, i.e., interaction term is positive and significant. The interaction term shows that India’s exports to partner countries increase by 15 per cent after agreement is signed compared to non-partner countries on an average. Chart 5 provides evidence that although India’s overall exports to partner countries have increased but the median log value of exports in recent years appears to be similar for partner and non-partner countries. | Table 2: Estimation Results | | | (1) | (2) | (3) | | lntr | lnexp | Lnimp | | lnGDP_p | 0.354*** | 0.332*** | | | | (0.0919) | (0.0828) | | | lnGDP_I | 1.583*** | | 2.138*** | | | (0.115) | | (0.174) | | Interaction | 0.162* | 0.155* | 0.478** | | | (0.0796) | (0.0710) | (0.145) | | lnER | | 0.0555 | -0.277*** | | | | (0.0391) | (0.0787) | | N | 594 | 594 | 594 | | R-sq | 0.835 | 0.847 | 0.664 | | Year FE | Yes | Yes | Yes | | Country FE | Yes | Yes | Yes | | Standard errors in parentheses. | | | =’* p<0.05 | ** p<0.01 | *** p<0.001’ | | Source: Calculations based on WITS database. | Finally, the last equation on imports reflects that as the GDP of India increases by 1 per cent, imports go up by 2.14 per cent irrespective of the status of the trading partner. The interaction term is positive and significant in the case of imports. The interaction term shows that imports have increased by 48 per cent from TA partners compared to Non-TA partners after the implementation of the agreement. The box chart also shows that over the years, median log values of India’s imports from TA partners have increased substantially compared to non-TA partners (Chart 6). 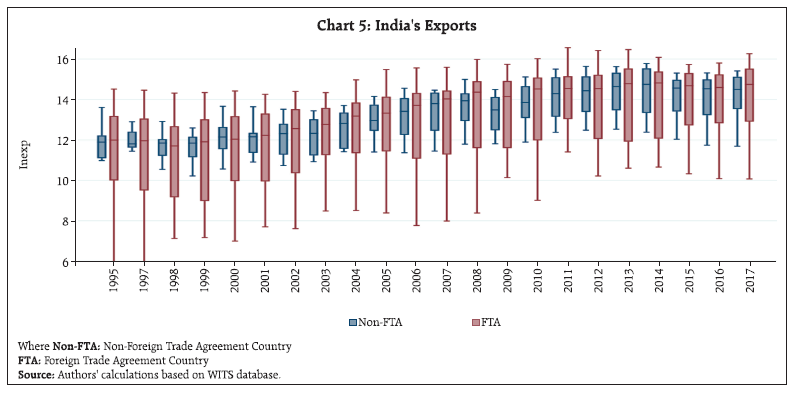 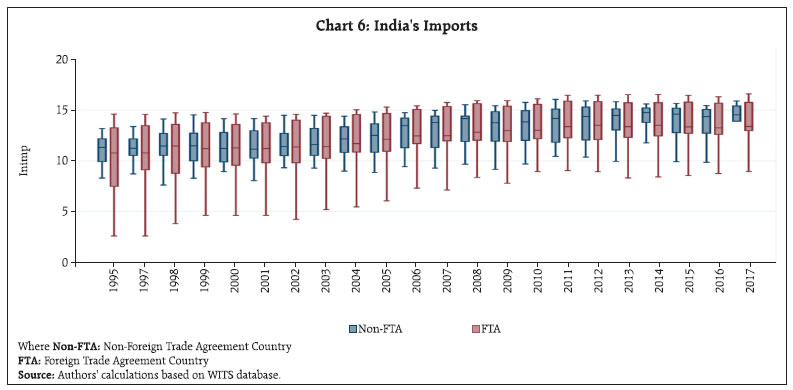 The above empirical analysis points towards improvement in trade with India’s partner countries particularly imports from these countries post signing of the agreement. Imports have increased at a faster pace as compared to India’s exports to these countries. This holds true for countries/regional blocs with whom India has recently entered into trading agreements, viz., Japan, South Korea and ASEAN where the ratio of India’s imports to its exports has gone up (Chart 7). However, a bigger related question is which commodities are being imported from these partners. As literature mentions that with reduction in the cost of imports, industries get greater access to capital goods and intermediate inputs which might improve competitiveness and efficiency in domestic market (Goldar and Kumari, 2003, Nagraj 2017). Moreover, country can reap benefits from imports of enhanced technology from partner countries. Thus, a closer examination of the composition of import and export basket from each individual partner country can provide further insights on which commodities have experienced growth after implementation of TAs. In the case of Japan, after the implementation of the agreement, India mostly imported industrial supplies, capital goods and transport equipment which may be a positive indicator as these goods are used as inputs in producing the final goods and thus may have aided in an improvement in the productive capacity of the economy (Table 3). 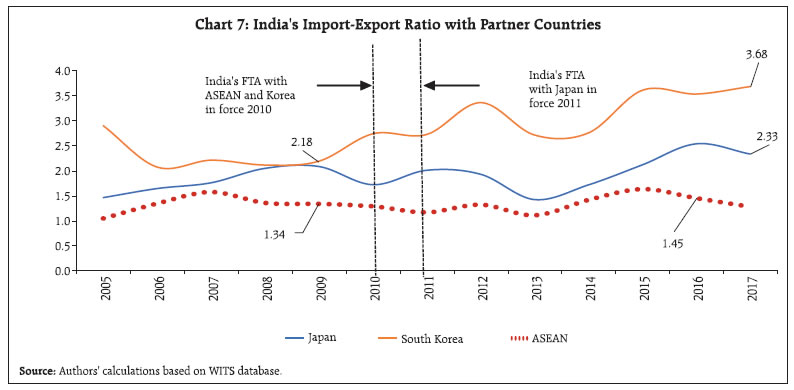
| Table 3: India’s Imports from Japan | | (Share in per cent) | | Sectoral Classification | 2003 | 2004 | 2005 | 2006 | 2007 | 2008 | 2009 | 2010 | 2011 | 2012 | 2013 | 2014 | 2015 | 2016 | 2017 | | Capital Goods (Except Transport Equ) | 48.4 | 47.9 | 46.9 | 46.7 | 50.5 | 50.0 | 46.1 | 47.5 | 45.7 | 45.5 | 42.2 | 42.8 | 38.8 | 45.6 | 40.9 | | Consumer Goods | 4.7 | 4.4 | 4.8 | 3.7 | 3.1 | 2.3 | 3.2 | 2.9 | 2.9 | 2.9 | 2.4 | 2.3 | 2.1 | 2.3 | 2.3 | | Food and Beverages | - | - | - | - | - | - | - | - | 0.2 | 0.2 | 0.1 | - | - | 0.1 | - | | Fuels and Lubricants | 2.6 | 3.4 | 0.8 | 1.6 | 3.1 | 5.9 | 3.0 | 1.8 | 3.6 | 3.3 | 2.2 | 2.1 | 2.2 | 1.5 | 2.3 | | Industrial Supplies | 37.1 | 33.4 | 35.0 | 30.7 | 32.3 | 30.9 | 33.4 | 37.6 | 37.6 | 37.9 | 42.7 | 42.1 | 47.2 | 39.9 | 43.7 | | Transport Equipment | 7.2 | 10.9 | 12.5 | 17.3 | 11.0 | 10.9 | 14.3 | 10.2 | 10.0 | 10.2 | 10.4 | 10.7 | 9.7 | 10.6 | 10.8 | | Total | 100.0 | 100.0 | 100.0 | 100.0 | 100.0 | 100.0 | 100.0 | 100.0 | 100.0 | 100.0 | 100.0 | 100.0 | 100.0 | 100.0 | 100.0 | - : Nil or Negligible
Source: Authors’ calculations based on WITS database. | In the case of Korea, imports of capital goods and industrial supplies have not seen any major change, but imports of consumer goods have gone up sharply (Table 4). In the case of ASEAN countries, decomposition of import basket does not reveal any specific bias in favour of consumer goods or capital goods. Imports of food and beverages, industrial supplies and consumer goods have gone up whereas inward shipments of fuels and lubricants, capital goods and transport equipment have witnessed a decline (Table 5). | Table 4: India’s Imports from Korea | | (Share in per cent) | | Sectoral Classification | 2003 | 2004 | 2005 | 2006 | 2007 | 2008 | 2009 | 2010 | 2011 | 2012 | 2013 | 2014 | 2015 | 2016 | 2017 | | Capital Goods (Except Transport Equ.) | 57.7 | 49.2 | 52.2 | 44.2 | 35.1 | 31.4 | 27.0 | 33.3 | 30.5 | 31.6 | 28.4 | 29.8 | 34.5 | 31.4 | 31.5 | | Consumer Goods | 3.3 | 2.5 | 2.7 | 2.9 | 2.1 | 1.8 | 2.8 | 2.5 | 2.5 | 2.1 | 2.4 | 2.1 | 2.6 | 3.4 | 10.7 | | Food and Beverages | 0.1 | - | - | - | - | - | - | 0.1 | 0.2 | 0.1 | - | - | - | - | - | | Fuels and Lubricants | 0.1 | 0.1 | 0.1 | 8.3 | 8.2 | 9.6 | 12.5 | 7.1 | 7.4 | 6.7 | 5.5 | 7.1 | 5.1 | 5.2 | 4.9 | | Industrial Supplies | 26.8 | 27.0 | 30.1 | 33.5 | 42.4 | 43.5 | 39.2 | 45.1 | 47.4 | 48.0 | 53.3 | 51.9 | 48.9 | 49.8 | 45.6 | | Transport Equipment | 12.0 | 21.2 | 14.9 | 11.1 | 12.2 | 13.7 | 18.5 | 11.9 | 12.0 | 11.5 | 10.4 | 9.1 | 8.9 | 10.2 | 7.3 | | Total | 100.0 | 100.0 | 100.0 | 100.0 | 100.0 | 100.0 | 100.0 | 100.0 | 100.0 | 100.0 | 100.0 | 100.0 | 100.0 | 100.0 | 100.0 | - : Nil or Negligible
Source: Authors’ calculations based on WITS database. |
| Table 5: India’s Imports from ASEAN Countries | | (Share in per cent) | | Sectoral Classification | 2003 | 2004 | 2005 | 2006 | 2007 | 2008 | 2009 | 2010 | 2011 | 2012 | 2013 | 2014 | 2015 | 2016 | 2017 | | Food and Beverages | 10.9 | 15.6 | 8.5 | 4.6 | 3.5 | 5.0 | 8.3 | 6.6 | 5.4 | 6.5 | 7.5 | 5.9 | 6.9 | 9.1 | 7.5 | | Industrial Supplies | 51.7 | 42.9 | 44.4 | 37.8 | 37.4 | 34.0 | 39.5 | 42.5 | 44.2 | 43.8 | 42.5 | 44.4 | 43.8 | 42.5 | 46.0 | | Fuels and Lubricants | 3.1 | 5.3 | 9.8 | 26.5 | 29.6 | 37.7 | 24.7 | 24.6 | 26.7 | 24.0 | 24.3 | 26.4 | 20.9 | 19.9 | 19.8 | | Capital Goods (Except Transport Equ) | 26.7 | 27.5 | 28.4 | 22.8 | 22.3 | 15.7 | 19.6 | 18.3 | 16.7 | 17.6 | 18.1 | 15.9 | 19.5 | 19.2 | 17.6 | | Transport Equipment | 3.7 | 4.4 | 4.2 | 4.2 | 3.5 | 4.8 | 4.0 | 4.2 | 3.5 | 4.0 | 3.7 | 3.4 | 4.0 | 4.7 | 3.3 | | Consumer Goods | 3.9 | 4.3 | 4.7 | 4.1 | 3.7 | 2.8 | 3.9 | 3.8 | 3.5 | 4.1 | 3.9 | 4.0 | 4.9 | 4.6 | 5.8 | | Total | 100.0 | 100.0 | 100.0 | 100.0 | 100.0 | 100.0 | 100.0 | 100.0 | 100.0 | 100.0 | 100.0 | 100.0 | 100.0 | 100.0 | 100.0 | | Source: Authors’ calculations based on WITS database. | V. Conclusion The present study attempts a quantitative assessment of the impact of the recently signed TAs on India. The study utilises difference in difference approach to estimate the increment of trade flows of India with partner countries and how trade has grown compared to the Non-TA partner countries. After the conclusion of the TA, growth in trade flows was witnessed between India and the partner countries. However, the increase in exports could not keep pace with the spurt in imports. One possible reason for this could be that India’s tariffs were much higher than the trade partner and hence the effective reduction on tariff for the partner countries was greater thus resulting in higher inbound shipments11. One positive impact of TA has been in the form of increased shipments of capital goods and industrial supplies from trade partner economies. This indirectly would have contributed in enhancing the productive capacity in the country. Moving ahead there is a need to focus on TAs which would enable increased integration in global value chains. The TAs should also enable access to newer markets for the products where the country enjoys competitive edge over its peers. However, to provide definitive conclusion on the impact of Tas, future research needs to extend the analysis to the services sector liberalisation by individual partner countries. Another critical aspect that needs analysis is India’s relative position in the TAs which includes changing trade patterns, competitiveness, compliance cost and ease of doing business. References Abrams, R K. (1980), ‘International Trade Flows under Flexible Exchange Rates’. Economic Review, Federal Reserve Bank of Kansas City, 3-10. Aitken, N. D. (1973). ‘The Effect of the EEC and EFTA on European Trade: A Temporal Cross-section Analysis’. The American Economic Review, 63(5), 881-892. Ahmed, S. (2010). ‘India-ASEAN Free Trade Agreement: A Sectoral Analysis’. Available at SSRN 1698849. Baier, S. L., & Bergstrand, J. H. (2007). ‘Do Free Trade Agreements Actually Increase Members’ International Trade?’. Journal of International Economics, 71(1), 72-95. Bergstrand, J. H. (1985). ‘The gravity equation in international trade: some microeconomic foundations and empirical evidence.’ The review of economics and statistics, 474-481. Bhagwati, J., & Krueger, A. O. (1995). ‘The Dangerous Drift to Preferential Trade Agreements’. Washington. DC: American Enterprise Institute for Public Policy Research. Brada, J. C., & Mendez, J. (1983). ‘Regional economic integration and the volume of intra-regional trade: a comparison of developed and developing country experience’. Kyklos, 36(4), 589-603. Burfisher, M. E., Robinson, S., & Thierfelder, K. (2001). ‘The Impact of NAFTA on the United States’. Journal of Economic perspectives, 15(1), 125-144. Brown, A. (2003). ‘Reluctant partners. A history of multilateral trade cooperation, 1850-2000’, Ann Arbor. The University of Michigan Press. Callaway, B., & Sant’Anna, P. H. (2019). ‘Difference-indifferences with multiple time periods. Available at SSRN 3148250’. Corden, M. (1972). ‘Economies of Scale and Customs Union Theory’. Journal of Political Economy 80: 465-475. Ministry of Finance 2016 ‘Economic Survey’. Frankel, J., Stein, E., & Wei, S. J. (1995). ‘Trading Blocs and the Americas: the Natural, the Unnatural, and the Super-Natural’. Journal of development economics, 47(1), 61-95. Hannan, S. A. (2016). ‘The Impact of Trade Agreements: New Approach, New Insights’. International Monetary Fund. Goldar B., and Kumari, A. (2003). ‘Import Liberalisation and Productivity Growth in Indian Manufacturing Industries in the 1990s.’ The Developing Economies, 41(4), 436-60. Joshi, V. (2012). ‘Econometric Analysis of the India– Sri Lanka Free Trade Agreement’. Asian Economic Journal, 26(2), 159-180. Kituyi M. (2018). ‘The Costs of Trade war.’ UNCTAD. Krugman, P. (1991). ‘Is Bilateralism Bad? in International Trade and Trade Policy.’ E. Helpman and A Razin, eds. Cambridge, MA: MIT Press, pp. 9 – 23. Lechner, M. (2011). ‘The Estimation of Causal Effects by Difference-In-Difference Methods. Foundations and Trends in Econometrics’, 4(3), 165-224. Lipsey, R. (1958). ‘The Theory of Customs Unions: A General Equilibrium Analysis’. University of London. McMillan J and McCann. E. (1981) ‘Welfare Effects in Customs Unions.’ The Economic Journal, 91(363):697– 703, ISSN 0013-0133. Meade, J. E. (1955). ‘The Theory of International Economic Policy: Supply. Trade and Welfare; Mathematical supplement’ (Vol. 2). Oxford University Press. Mukherji, I. N., Jayawardhana, T., Kelegama, S., (2002), ‘Indo-Sri Lanka Free Trade Agreement: An Assessment of Potential and Impact’. Mundell, R. (1964). ‘Tariff Preferences and the Terms of Trade’. Manchester School of Economic and Social Studies. 1-13. Nagraj, R. (2017). ‘Economic Reforms and Manufacturing Sector Growth’ Economic and Political Weekly, 52(2), 61. Panagariya, A. (2000). ‘Preferential Trade Liberalisation: The Traditional Theory and New Developments’. Journal of Economic literature, 38(2), 287-331. Parthapratim P. and Dasgupta M. (2009), ‘The ASEAN-India Free Trade Agreement: An Assessment’. Economic & Political Weekly, Vol. XLIV No. 38, September. Saraswat V. K., Prachi Priya and Aniruddha Ghosh (2018). ‘A Note on Free Trade Agreements and their costs.’ National Institute for Transforming India. Seshadri V. S. (2015), ‘India-Korea CEPA - An Appraisal of Progress’. Research and Information System for Developing Countries (RIS). Sikdar, C., & Nag, B. (2011). ‘Impact of India-ASEAN Free Trade Agreement: A Cross-Country Analysis Using Applied General Equilibrium Modelling’, (No. 107). ARTNeT Working Paper Series. Stevens, C., Irfan, I., Massa, I., & Kennan, J. (2015). ‘The Impact of Free Trade Agreements between Developed and Developing Countries on Economic Development in Developing Countries: A Rapid Evidence Assessment’. Overseas Development Institute, London. Overseas Development Institute, ODI. Tinbergen, J.(1962). ‘Shaping the World Economy’. Twentieth Century Fund, New York. Vanek, J. (1965). ‘General Equilibrium of International Discrimination: The Case of Customs Unions’. Harvard University Press, Cambridge, MA. Veeramani, C., & Saini, G. K. (2011). ‘Impact of ASEANIndia Preferential Trade Agreement on Plantation Commodities: A Simulation Analysis’. Economic and Political Weekly, 83-92. Venkatesh V. & Bhattacharyya R (2014). ‘The ASEAN Free Trade Agreement: How Effective?’. Working Papers 1425, Indian Institute of Foreign Trade. Viner, J. (1950). ‘The Custom Union’. Carnegie Endowment for International Peace, New York. Weerakoon, D. and Thennakoon, J. (2006). ‘India -Sri Lanka FTA’. CUTS International Lessons for SAFTA. Wooton, I. (1986). ‘Preferential Trading Agreements: An Investigation’. Journal of International Economics, 21(1-2), 81-97. World Trade Organisation, (2011).‘World Trade Report’.
Annex I Concept of Trade Creation and Trade Diversion Viner defines trade creation as a scenario where an additional flow of commodity takes place between partners of a trading arrangement because of reduction in tariffs. This replaces domestic production in the importing country. The concept of trade creation is explained in chart A1. The chart provides information on the supply and demand curves for country A. Consider that PB and PC are supply prices that country B and C, respectively charge for a good when no tariffs are charged. Country C is assumed capable of supplying the commodity at a lower price than country B. Suppose country A imposes a specific tariff tb = tC= t* on imports of commodity from both countries B and C. This, in turn, increases the import price of a good in country A from country B and C. Under autarky, with given tariffs, the price in country A (PA) is less than the tariff-ridden prices PBT and PCT, the product will not be imported. Instead country A will supply to meet its domestic demand at S1 = D1. Now consider a situation where country A and B have signed a free trade agreement and A provides complete elimination of tariff on B’s import. The prices that consumers in country A face for goods imported from countries B and C are now PB and PCT, respectively. Since PB < PA, country A would now import the product from country B after the free trade agreement which is represented by blue line distance, or D2 – S2. The imports of these goods from country B to country A occurs with the implementation of FTA, which was not feasible earlier, hence trade is categorised as created in these commodities. The opposite takes place in case of trade diversion, when the trade flow is diverted from a cost-efficient partner to a less efficient one. The less efficient country becomes a member of free trade agreement and makes its goods cheaper to partner country, but higher compared to non-partner (if tariffs were reduced for them). This concept can be understood in chart A2 where after imposition of tariff, the product is cheaper to import from country C. In a situation where there is no free trade agreement, country A will import the product from country C and will not trade initially with country B. Total goods imported by country A are given by the red line, or by the distance D1 - S1. The tariff revenue collected by country A is given the tariff rate times the quantity imported. Now consider that country A and B sign a free trade agreement and country A eliminates the tariff on Country B’s imports. Now tB = 0 but tC remains at t*. Consumers in country A pay PB and PCT for goods imported from countries B and C. Since PB< PCT country A would import products from country B after the FTA and would import nothing from country C. At the lower domestic price, PB, imports would rise to D2 – S2, denoted by the blue line distance. Since the non-distorted (i.e., free trade) price in country C is less than the price in country B, trade is said to be diverted from a more efficient supplier to a less efficient supplier. 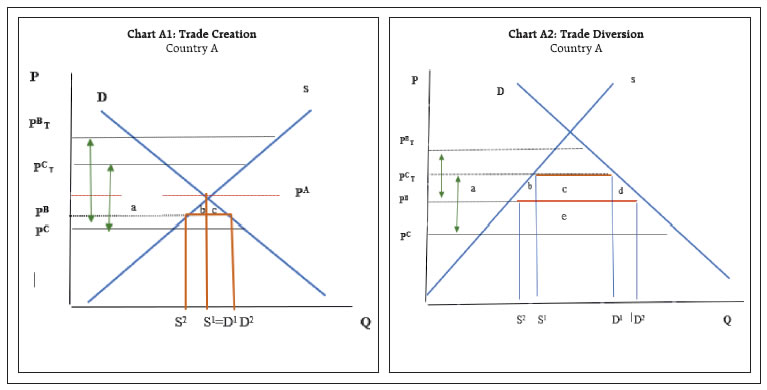
before and after treatment (Albony, 2004). |