Mutual fund (MF) industry in India is maturing with broad-basing of investors and increasing geographical spread. MFs in India have become major players in the equity and corporate bond markets and are also providing crucial liquidity support to the money market. Consequently, their influence on price movements in equity and debt markets as also domestic liquidity conditions has increased over time. While the penetration of the MF industry in India, as measured by the Assets under Management (AUM)/GDP ratio, is still low compared with the global average, favourable demographics, a history of high savings propensity and regulatory reforms brighten the outlook for the industry. Introduction In recent years, credit intermediation is shifting, with the traditional dominance of the banking sector yielding ground to non-bank intermediaries, including the asset management industry. Within this silent transformation, the MF industry is turning out to be the fastest growing and the most competitive segment of India’s financial sector, offering operational flexibility and attractive returns to investors (RBI, 2017). AUM of MFs in India has registered a compound annual growth rate (CAGR) of 25 per cent over the last five years (2013-2018), outstripping the CAGR of only 11 per cent registered by aggregate bank deposits of scheduled commercial banks (SCBs). With growing formalisation and financialisation of the Indian economy, household savings have been shifting from physical assets to financial assets and within financial assets, from bank deposits to securities. As investment in capital market instruments involves risks, and individual investors lack expertise with regard to portfolio construction, stock selection and market timing, MFs step in to pool money from a wide cross-section of investors and diversify risk by investing in a portfolio of stocks, bonds and/or money market instruments. These investments are actively managed by professional portfolio managers who undertake strategic transactions to take advantage of current or expected market conditions. In the process, MFs provide a steady flow of income and capital appreciation along with tax benefits to otherwise risk averse lay investors. Not surprisingly, therefore, household preference for MFs over other avenues of investment has increased dramatically since 2016. While the penetration of the MF industry in India, as measured by the AUM/GDP ratio, is still low compared with the global average, favourable demographics, a history of high savings propensity and regulatory reforms brighten the outlook for the industry. In addition, MFs play an important role in equity, debt and money markets as efficient allocators of resources. The debt portfolio of MFs mainly comprises corporate debt instruments, which include floating rate bonds (FRBs), non-convertible debentures (NCDs) and PSU bonds. In the money market segment, MFs are the major lenders in the collateralised borrowing and lending obligation (CBLO) segment, accounting for over 60 per cent of lending in this segment. As major domestic institutional investors, they operate in both primary and secondary segments of the capital market, providing a buffer against market volatility. Against this backdrop, this article attempts to analyse recent developments in the Indian MF industry, i.e., up to end-March 2018, with a view to situating it in the changing landscape of financialisation in India. As we show, there are various facets of the industry that are less known and even less understood. Our view is that the MFs bridge an important information asymmetry pertaining to investments in the markets and by doing so, they facilitate efficient channelisation of savings, expand investment opportunities, foster market development and catalyse higher investment and growth in the economy. The article is structured into four sections. Section II sets out the policy environment in which the Indian MF industry operates, focusing on various regulatory initiatives taken by the Securities and Exchange Board of India (SEBI) in the recent years to develop the industry. Section III discusses growing financialisation of savings, recent trends in resource mobilisation by MFs, their investments in equity and debt markets in India and how the industry stacks up in relation to the global MF industry. Section IV provides some concluding observations. II. The Policy Environment The origins of MFs in India can be traced back to the second half of the 19th century when the first investment trust - the Financial Association of India and China - was formed in 1869. The first Industrial Investment Trust was established in 1933 by M/s Premchand Roychand in Bombay. Many other industrial houses also established trusts, which worked as investment companies and mobilised funds from industrial group companies and promoters. However, a solid foundation for the industry was laid in 1963 with the establishment of the Unit Trust of India (UTI) at the initiative of the Reserve Bank of India (RBI) and the Government of India (GoI). It was not until 1987 that new entrants began to shape the evolution of the industry, interspersed with phases of consolidation. According to AMFI1, there are five broad phases of the development of the industry. The first phase (1964-1987) started with the formation of the UTI by an Act of the Parliament and Unit Scheme 1964 (US’ 64) was the first MF scheme launched by it in 1964. By the end of 1988, UTI had AUM of ₹67.0 billion. The second phase (1987-1993) marked the emergence of public sector financial companies as MFs, beginning with the establishment of State Bank of India (SBI) MF in 1987. Several other public sector banks, the Life Insurance Corporation of India (LIC) and the General Insurance Corporation of India (GIC) also set up their MFs and the industry’s AUM reached ₹470.0 billion by end-1993. With the establishment of the SEBI in 1992 to protect investors’ interest and to develop and regulate securities markets in India, a new era in the Indian MF industry began in 1993. In the third phase (1993- 2003), private players were allowed to enter the industry and the Indian securities market began to provide Indian investors a variety of MF products. In 1993, SEBI started regulating the MF industry, except UTI, as per SEBI (Mutual Funds) regulations, 1993, which were comprehensively revised and the new regulations notified in 1996. A number of foreign sponsored MFs came into the market and many mergers took place during this phase. At the end of January 2003, there were 33 MFs with total AUM of ₹1,218.1 billion. The fourth phase (2003-April 2014), which began with the repeal of the UTI Act 1963 in February 2003 and bifurcation of the UTI into a Specified Undertaking of the Unit Trust of India (SUUTI) and the UTI Mutual Fund, witnessed several mergers among private sector funds that led to further consolidation and growth of the MF industry, which was interrupted in the years following the global financial crisis. The fifth phase (May 2014 onwards) witnessed a revival of the industry with steady growth in inflows and AUM, supported by the SEBI’s regulatory measures, enhanced reach through better distribution networks and greater investor education. The SEBI has taken various measures in recent years to establish a comprehensive and credible regulatory regime for the industry, while improving accessibility of MF products, re-energising the distribution system, ensuring greater transparency, addressing issues concerning investor protection and awareness. Under the SEBI’s initiatives, a new cadre of distributors was formed in September 2012, which includes postal agents, retired government officials, retired teachers and bank officers who were awarded certificates by the National Institute of Securities Markets (NISM) for distribution of simple MF products. MF distributors were also allowed to use recognised stock exchange platforms to purchase and redeem MF units directly from MFs on behalf of their clients from October 2013. In order to reduce the cost of trading for Asset Management Companies (AMCs) in debt segment, MFs were allowed to directly trade on debt platforms of the stock exchanges by registering themselves under the ‘proprietary trading members’ category on behalf of schemes managed by them from August 2013. Additional distribution channels through online investment facilities and the burgeoning mobile-only mode for direct investment in MF products were allowed from April 2014 to tap internet savvy users. SEBI registered investment advisors (RIAs) were also allowed to use the infrastructure of recognised stock exchanges to purchase and redeem MF units directly from AMCs on behalf of their clients, including direct plans, from October 2016. Provisions for separate plans for direct investments, i.e., investments not routed through a distributor, in existing as well as new schemes by MFs, were made available from 2012-13. In September 2012, MFs were incentivised to enhance their reach in small cities beyond the top 15 cities by allowing them to charge additional total expense ratio (TER) up to 30 basis points on daily net assets under the scheme if the new inflows from beyond top 15 cities were at least 30 per cent of the gross new inflows in the scheme or 15 per cent of the average AUM (year to date) of the scheme, whichever is higher. In order to enhance the reach of MF products amongst small investors, cash transactions in MFs to the extent of ₹20,000 per investor per MF per financial year were allowed in September 2012 and this was further increased to ₹50,000 in May 2014. Investment in MFs through e-wallets has been introduced in April 2017 to channelise household savings into the capital market as well as to promote digital payments in the MF industry. In July 2013, the SEBI mandated that MFs should label their schemes in terms of maturity (short/ medium/ long term), investment objective and level of risk with three colour codes to depict low, moderate and high levels of risk. In order to address the issue of mis-selling of MF products and for providing investors an easy understanding of the type of product/scheme, product labelling in MFs was further rationalised in July 2015 by replacing risk depiction through colour codes with a pictorial meter named ‘Riskometer’, which appropriately depicts five levels of risk in any specific scheme. From September 2012, AMCs were required to disclose half yearly financial results of MFs on their websites and through advertisement in at least one national English daily newspaper and one regional newspaper in order to increase transparency and enhance the quality of disclosure for investors. Disclosure of information pertaining to average AUM of various categories of schemes, various investor types, contributions from sponsors and their associates on a monthly basis on their website was also mandated in April 2014. In October 2012, the SEBI stipulated that MFs should annually set apart at least 2 basis points of daily net assets within the maximum limit of TER for investor education and awareness initiatives. Printed literature on MFs in regional languages was also mandated and MFs are encouraged to introduce investor awareness campaigns using electronic media in regional languages. In 2017-18, SEBI undertook measures for categorisation and rationalisation of MF schemes in order to bring uniformity across MFs and to standardise the scheme categories and characteristics. The earlier provision of additional TER of up to 30 basis points for inflows from beyond top 15 cities has now been permitted only for inflows from beyond top 30 cities. AMCs are required to disclose on a daily basis the TER of all schemes under a separate head ‘Total Expense Ratio of Mutual Fund Schemes’ on their websites in order to bring uniformity in disclosure of actual TER charged in respect of MF schemes and to enable the investors to take informed decisions. The performance of the MF schemes needs to be benchmarked to the total return variant of the index chosen as a benchmark going forward instead of the present system of benchmarking to the price return variant of the index, which only captures capital gains of the index constituents. This is intended to enable the investors to compare the performance of a scheme vis-à-vis the total return generated by the benchmark index2. III. Recent Trends in Resource Mobilisation At end-March 2018, there were 45 MF companies registered with the SEBI which managed an AUM of ₹21,360.4 billion. Of the total AUM, 83 per cent was held by private sector MFs and 17 per cent by public sector MFs. The ratios of AUM of MFs to GDP and net mobilisation by MFs to gross domestic savings have increased significantly over the years (Table 1). | Table 1: Ratios of MF AUM as per cent of GDP and Net Mobilisation by MFs as per cent of Gross Domestic Savings | | Year | MF AUM % of GDP | Net Mobilisation by MFs as % of Gross Savings | | 2011-12 | 6.7 | -0.7 | | 2012-13 | 7.1 | 2.3 | | 2013-14 | 7.3 | 1.5 | | 2014-15 | 8.7 | 2.6 | | 2015-16 | 9.0 | 3.1 | | 2016-17 | 11.5 | 7.5 | | 2017-18 | 12.7 | - | | Source: Ministry of Statistics and Programme Implementation (MOSPI) and AMFI. | This remarkable transformation has greatly facilitated shifts in household saving patterns. Indian households, which contributed 54.0 per cent of the gross savings of the economy in 2016-17, have historically been risk-averse, preferring investments in physical assets and gold. However, this pattern is slowly changing in the backwash of demonetisation in November 2016 and shifts towards MFs have become large. With increasing development of the financial sector, the household sector’s savings in physical assets and gold & silver ornaments taken together declined significantly from 60 per cent in 2011-12 to 51 per cent in 2016-17 (Chart 1). In addition to demonetisation, implementation of new regulations such as the Real Estate (Regulation and Development) Act, 2016 (RERA) and the Benami Transactions (Prohibition) Amendment Act, 2016 have also contributed to greater formalisation of the economy causing shifts in savings from physical to financial investments. This has energised non-bank intermediaries like MFs, which give relatively higher returns on liquid investments than housing and/or gold (Chart 2). The consumer demand for gold in India declined by around 24 per cent from 1,002 tonnes in 2010 to 763 tonnes in 2017.
III.1. Resource Mobilisation MFs appear to have emerged as a preferred investment avenue for individuals as well as corporates. While the flow of resources to banks generally declined during the period 2013-18, the flow of resources to small savings schemes registered modest increase. In comparison, the flow of resources to MFs and insurance companies registered a significant increase during the period (Chart 3). During the period 2013-2018, the CAGR of bank deposits and small savings were 11 per cent and 6 per cent, respectively, which was much lower than CAGR of AUM of MFs (25 per cent). Bank term deposits by corporates registered a much lower CAGR of 2 per cent during 2013-2017. Along with increasing levels of economic development, deep and liquid capital markets and sound regulations are catalysing the change in preference of investors not only from metro cities but also from small cities. MF investments are also becoming broad-based in terms of spatial distribution and investor profile. 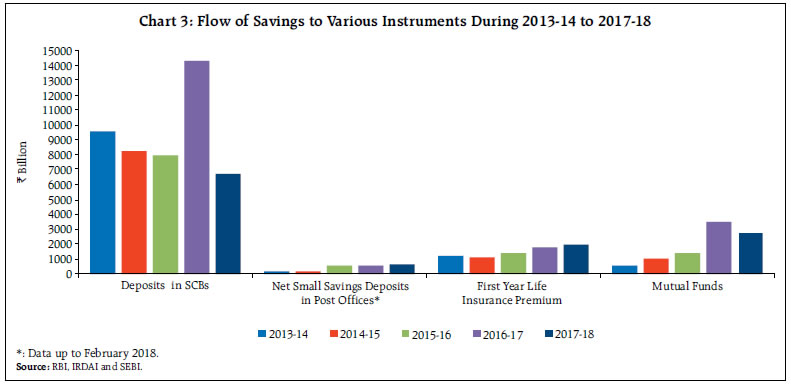
Table 2a: Bank and Post Office Deposit Rates
(Yearly average returns) | | (Per cent) | | Year | Bank Deposit
(1-3 years) | Bank Deposit
(3-5 years) | Post Office Monthly Income Scheme | NSC VIII issue | Post Office RD Account | Post Office Time Deposit
(1 year) | | 2013-14 | 9.25 | 9.10 | 8.40 | 8.50 | 8.30 | 8.20 | | 2014-15 | 8.75 | 8.75 | 8.40 | 8.50 | 8.40 | 8.40 | | 2015-16 | 7.50 | 7.50 | 8.40 | 8.50 | 8.40 | 8.40 | | 2016-17 | 7.00 | 6.90 | 7.80 | 8.10 | 7.40 | 7.10 | | 2017-18 | 6.75 | 6.50 | 7.60 | 7.90 | 7.20 | 6.90 | | Source: RBI. | The bank deposit rates on 1-3 years declined by 250 basis points from 9.25 per cent in 2013-14 to 6.75 per cent in 2017-18. Similarly, interest rates on post office monthly income scheme and NSC VIII issue declined by 80 basis points and 60 basis points, respectively, during the same period (Table 2a). On the other hand, the CRISIL - AMFI Mutual Fund Performance Indices, which track the performance of various MFs adjusted for corporate actions, show that the returns on broader schemes over the last five years are higher than other financial instruments (Table 2b). Table 2b: CRISIL - AMFI Mutual Fund Performance Index
(Yearly returns) | | (Per cent) | | Year | Equity Fund | ELSS Fund | Debt Fund | Income Fund | Money Market Fund | Liquid Fund | Balanced Fund | Hybrid Fund | | 2013-14 | 21.1 | 24.0 | 5.6 | 3.3 | 9.4 | 9.4 | 18.5 | 13.2 | | 2014-15 | 43.8 | 46.5 | 12.5 | 14.8 | 9.0 | 9.0 | 37.2 | 31.1 | | 2015-16 | -6.7 | -7.7 | 7.1 | 5.5 | 8.3 | 8.2 | -2.6 | -1.3 | | 2016-17 | 25.9 | 24.3 | 10.2 | 11.0 | 7.6 | 7.2 | 22.1 | 20.8 | | 2017-18 | 10.6 | 10.9 | 6.0 | 4.2 | 6.7 | 6.7 | 8.9 | 8.5 | | CAGR (2013-14 to 2017-18) | 17.7 | 18.2 | 8.2 | 7.7 | 8.2 | 8.1 | 16.1 | 13.9 | ELSS: Equity Linked Savings Scheme.
Source: CRISIL. | III.2 Investor Profile During the period 2013-18, average yearly funds mobilised by MFs was significantly higher at ₹1,812.2 billion as compared with ₹119.8 billion during 2008-13. Fund mobilisation by MFs reached a record in 2016-17, increasing by almost 3 times over the previous year, in the wake of demonetisation in November 2016 (Chart 4). However, there was a decline in fund mobilisation in 2017-18 mainly on account of higher net outflows from debt/income schemes on higher redemptions by corporate/institutional investors. 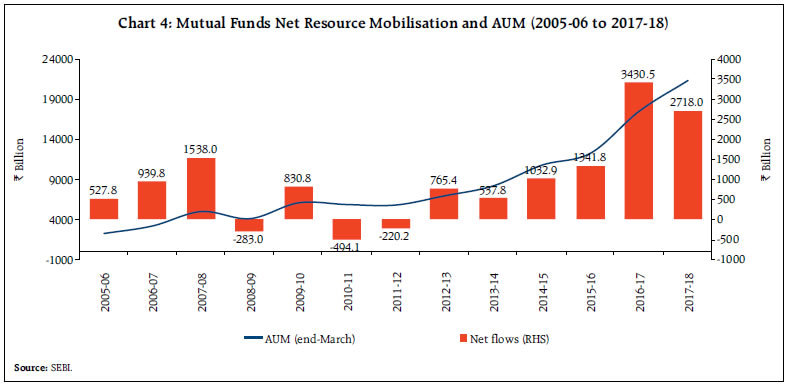
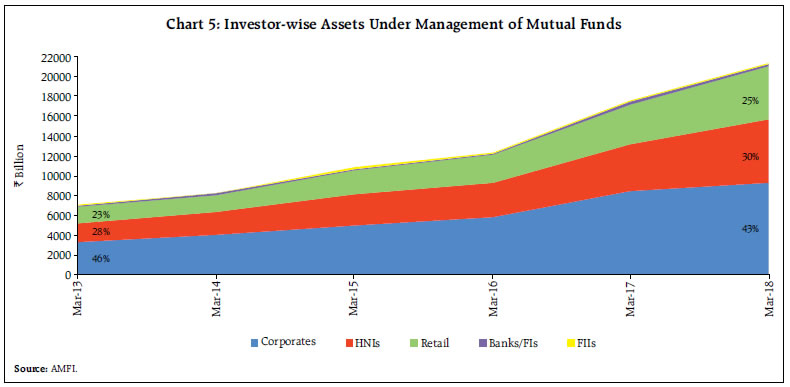 Higher mobilisation through systematic investment plans (SIPs) has contributed significantly to the expansion of MFs in India. During 2017-18, SIPs’ contribution increased by 53.0 per cent to ₹671.9 billion from ₹439.2 billion in 2016-17. Increasing investment from smaller cities (other than metros), which accounted for 18.7 per cent share in AUM of MFs at end-March 2018, and overwhelming interest from the new generation have been contributing to this phenomenal growth. With increasing fund mobilisation, the Indian MF industry has registered exponential growth of AUM during the last five years to ₹21.4 trillion at end-March 2018. The AUM of MF industry has witnessed a CAGR of 25 per cent during 2013-2018, which is considerably higher than CAGR of 7 per cent registered during 2008-2013. The unit holding pattern shows that individual investors held 99.4 per cent of the total 7.1 crore accounts in the MF industry at end-March 2018. However, in terms of AUM of the industry, corporate investors have the largest share at end-March 2018, followed by high net worth individuals (HNIs) and retail investors. While the share of corporates in assets of MFs has been declining, there has been a steady increase in the share of HNIs and retail investors in the recent years (Chart 5). During 2013-18, the assets of HNIs and retail investors registered a CAGR of 27 per cent each as compared with the CAGR of 23 per cent for corporate investors. Corporates investments in MFs, which primarily consist of investment in debt/income schemes of MFs (79.7 per cent of their total investments in MFs), witnessed an unprecedented growth during 2016-17. Retail investors have higher investment in equity/growth-oriented schemes with a share of 71.7 per cent of their investments in MFs at end-March 2018. On the other hand, HNIs investments are diversified with an investment share of 44.4 per cent in debt/ income schemes and 40.7 per cent in equity-oriented schemes. III.3 Scheme-wise Profile Over the last four years (2014-15 to 2017-18), net flows were positive for all categories of MF schemes, except for funds invested in overseas schemes. Reversing the earlier trend of high concentration of fund mobilisations through debt/income schemes, there has been an increasing contribution to other schemes of the MFs since 2014-15 (Chart 6). Fund mobilisation under growth/equity oriented schemes turned positive in 2014-15 and has been continuously registering higher net inflows, touching a peak of ₹1,710.7 billion in 2017-18, strongly backed by investments from retail investors and HNIs mainly due to buoyancy in stock market, increasing preferences towards equity shares along with SEBI’s various initiatives. It has also been observed that flows into equity MFs tend to be higher even during episodes of market turmoil mainly on the back of greater presence of individual investors who invest in MFs for longer-term, making stable contributions through periodic investments. During 2017-18, monthly average number of SIP accounts opened was 0.97 million as against 0.63 million in the previous year. As at end-March 2018, there were about 21.1 million SIP accounts in existence. Measures announced in the Union Budget 2013-14, such as reduction in securities transaction tax (STT) on equities and MFs and easing of norms for the Rajiv Gandhi Equity Savings Scheme (RGESS) to enable first time investors to invest in MFs may have contributed to significant increase in resource mobilisation by MFs in equity/growth-oriented schemes in the recent years. 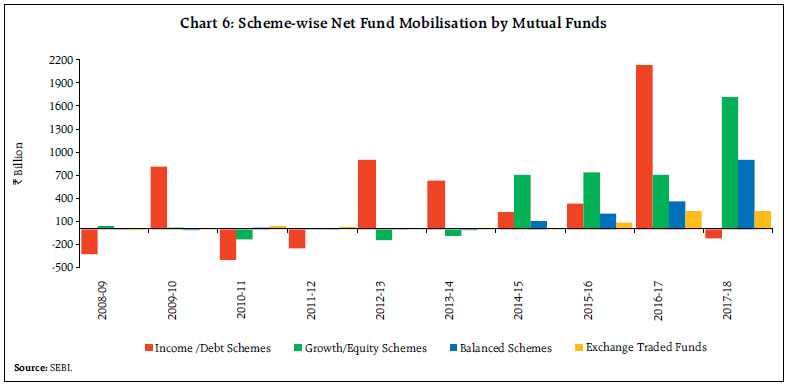 Mobilisation under income/debt-oriented schemes, which mainly comprise corporate bonds (37 per cent of AUM) and liquid/money market schemes (16 per cent of AUM), has remained positive during the last five years, barring 2017-18. During 2016-17, fund mobilisation under debt/income schemes registered unprecedented growth with a record high mobilisation of ₹2,131.5 billion, constituting 62.1 per cent of the overall net resource mobilisation. However, the trend could not be sustained in 2017-18 following net outflows of 117.2 billion mainly due to higher redemptions by corporate/institutional investors. The higher share of corporate investors in debt/ income schemes leads to yearly fluctuations in fund mobilisation in these schemes with no clear trends, as corporates generally invest in MFs to manage their cash flows and liquidity requirements. This also results in higher redemption pressure, particularly in the case of liquid/money market schemes, at the end of every quarter in order to meet corporate tax payment obligations and dividend payments (Chart 7 a & b). In view of increasing risk from high redemptions, SEBI has mandated the AMCs to impose provisional restrictions during episodes of excessive redemption requests. Further, as a part of risk management framework, MFs need to carry out stress test of their portfolios, particularly for debt schemes. Liquid/ money market MFs are required to have effective liquidity management and carry out periodic stress tests, at least once in a month or more frequently depending on the market conditions. This would help in evaluating potential vulnerabilities on account of sudden adverse developments and provide early warning signal regarding the health of the schemes. 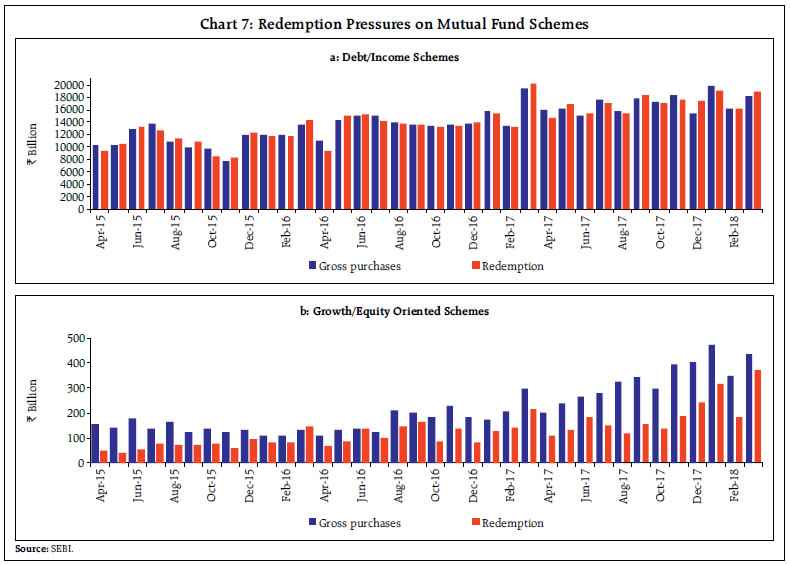 Balanced schemes have also registered a steady increase in fund mobilisation mainly on the back of increasing participation from HNIs with a share of 54 per cent of AUM of the schemes followed by retail investors with 35 per cent share at end-March 2018. Similarly, Exchange Traded Funds (ETFs) are becoming more popular among corporate investors (corporates accounted for 86 per cent of ETF’s AUM) and are witnessing significant increase in fund mobilisation from 2015-16 onwards, mainly supported by increasing contribution from retirement funds and disinvestment by GoI through ETF route. In terms of number of schemes, income/debt schemes accounted for 67.9 per cent of the total 1998 MF schemes as at end-March 2018, followed by equity schemes (25.7 per cent) and ETFs (3.4 per cent). While income/debt schemes contribute a major portion of the total assets of MFs, the share of other schemes in the total assets has also increased over the last five years (Chart 8). During 2013-18, total assets under income/debt schemes grew at a CAGR of 18 per cent, which is considerably lower than CAGR of 60 per cent for balanced schemes, CAGR of 43 per cent for ETFs and CAGR of 34 per cent for growth/equity-oriented schemes. The relatively lower growth of AUM of debt/ income schemes in the recent years could, to an extent, be attributed to increase in long-term capital gains tax on transfer of MF units other than equity funds to 20 per cent along with increase in the holding period in respect of such units to 36 months from 12 months introduced in the Union Budget, 2014-15. 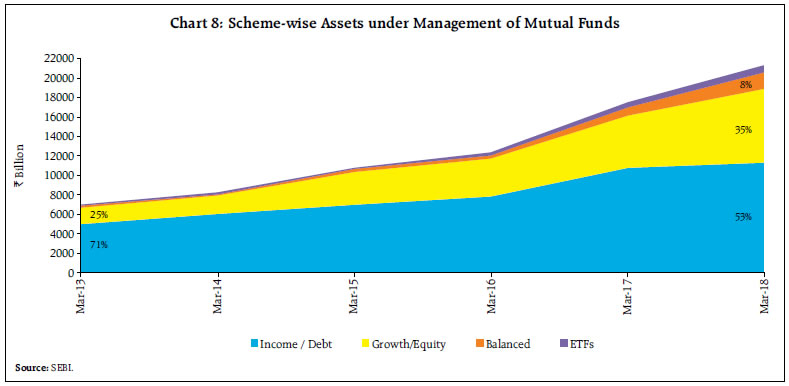 III.4 Investments in Equity, Debt and Money Market Instruments in India Equity Market MFs’ investment in equities stood at ₹8.9 trillion at end-March 2018, which accounted for 6.2 per cent of market capitalisation of the BSE listed companies (2.8 per cent at end-March 2014). Of the total free float market capitalisation3, the share of MFs was about 15 per cent. This increase has mainly been due to higher investments by MFs in equities in the last few years on the back of higher mobilisations by equity-oriented MF schemes. Top 10 sectors accounted for 76 per cent of the total equity assets of MFs (Chart 9). The banking and finance sector has the highest weight in MFs’ portfolio. 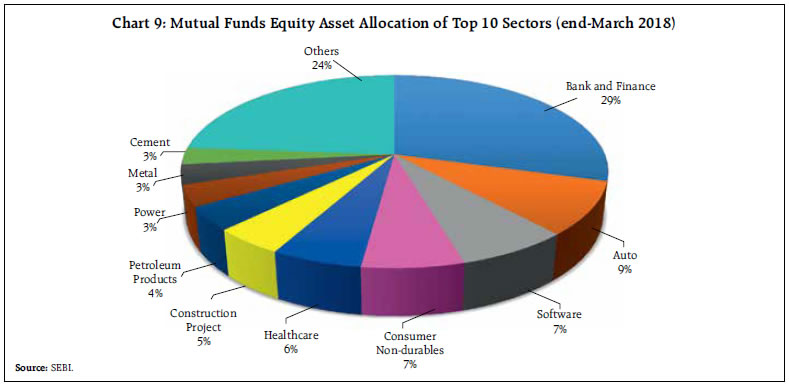
 During the period 2014-15 to 2017-18, there was sustained net buying by MFs in the equity market, which lent support to the domestic equity market. The MFs have emerged as a counter balance to foreign portfolio investors (FPIs), especially during episodes of large net selling by FPIs. (Chart 10). During the period, the benchmark BSE indices also registered sharp increases. In terms of share in secondary market transactions, MFs accounted for 7.9 per cent of the monthly turnover on an average in the cash segment of the BSE during 2017-18 as compared to a lower share of 2.3 per cent in 2012-13. Data on equity ownership pattern of BSE 500 companies suggest that MFs have fairly similar share in ownership of companies of different sizes, i.e., 5-7 per cent. This is in contrast with FPIs, which have relatively higher share in the top 100 companies as compared to the top 101-500 companies (Chart 11). The preference of FPIs for larger companies possibly results in MFs having a significant influence on share price movements of top 101-500 companies.
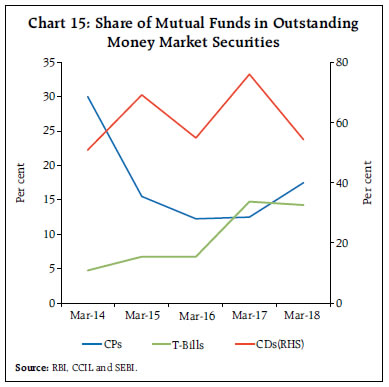
In the primary market, MFs’ investments in the public issues4 have risen, particularly since 2015-16, as more number of companies came up with their public issues to take advantage of the buoyant secondary market conditions. During 2017-18, MFs’ investment accounted for 14.4 per cent of the total size of public issues (Chart 12). Debt and Money Markets MFs have historically been investing more in debt than in equity market on account of greater mobilisations under debt/income schemes. The debt assets of MFs mainly comprise corporate debt and money market instruments with a share of 49.1 per cent and 41.2 per cent, respectively, as at end-March 2018. The debt portfolio of MF industry has witnessed a shift towards corporate debt instruments, which include floating rate bonds (FRBs), non-convertible debentures (NCDs) and PSU bonds (Chart 13). MFs’ investment in corporate bonds as a share of total outstanding corporate bond issuances nearly doubled to 22.7 per cent at end-March 2018 from 11.8 per cent at end-March 2014. 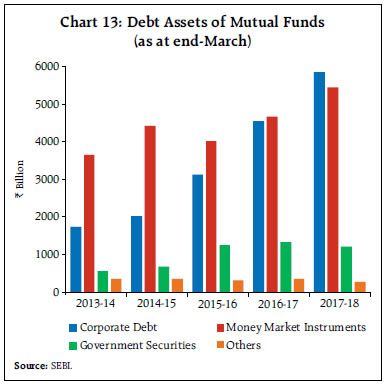 MFs’ investments in money market instruments include treasury bills, commercial paper (CP), certificates of deposit (CDs), CBLO, etc. A shift in their investments from CDs to CPs is clearly evident mainly due to the rising dependence of the commercial sector on non-bank sources of credit (commercial papers, corporate bonds, etc.) in the backdrop of asset quality concerns facing banks and the associated sluggish growth of bank credit as well as search for higher returns by the MFs (Chart 14). The share of MFs in outstanding money market instruments is significant at present (Chart 15). MFs are the biggest lenders in the CBLO segment accounting for 63.2 per cent of the total lending. III.5 India’s Mutual Fund Industry in the Global Context The global MF industry has witnessed steady expansion in size over the years on the back of higher levels of economic development, deep and liquid capital markets and emergence of defined contribution systems that encourage participants to invest in MFs in an atmosphere of investor friendly robust regulation. According to the Investment Company Institute, global MF assets (open-end fund) registered an increase of 16.2 per cent in 2017-18 to reach a level of $53.9 trillion at end-March 2018. Top 5 countries accounted for 69.1 per cent of total global assets of MFs at end-March 2018. With assets of $24.3 trillion, the US MF industry was the largest in the world, accounting for a share of 45.1 per cent of the total global MF assets at end-March 2018. In comparison, MFs in Asia accounted for 12.7 per cent of total global MF assets (Chart 16). 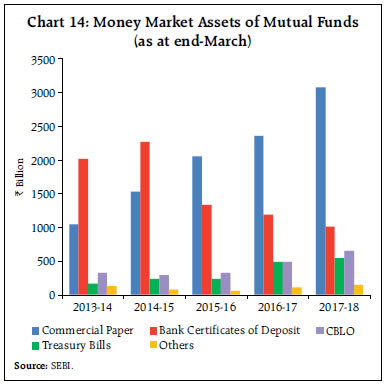
 India is among the top 20 countries in the world in terms of share in total global MF assets (it accounts for about 0.6 per cent of total global MF assets) (Chart 17). Its AUM/GDP ratio (11.8 per cent), which is a measure of penetration, however, is low relative to several emerging market peers (Chart 18). In terms of growth in AUM, India’s MF industry’s growth of 41.6 per cent in 2017 was nevertheless one of the highest in the world. Globally, the composition of MF assets shows that at end-March 2018, equity constituted a major share of 41.3 per cent (32.8 per cent in India). MFs’ assets under bonds in India at 32.4 per cent is much higher than 20.6 per cent globally.
Conclusion The MF industry in India has emerged over time as one of the fastest growing and competitive segments of the financial system. Notwithstanding higher risks in such investments, MFs have been attracting investors due to their professional management and the scope for earning better returns relative to traditional saving instruments. A robust regulatory framework that is guided by the goal of protecting the interest of investors has also contributed to the shift in preference of households away from alternative financial and physical modes of savings in favour of MFs. The SEBI’s regulatory reform initiatives such as strengthening of the distribution network, greater disclosure requirements from AMCs, and increased emphasis on investor education and awareness have also helped in deepening MF penetration in India. MFs as an asset class is maturing in India with broad-basing of investors and increasing geographical spread. MFs in India have become major players in the equity and corporate bond markets, besides providing crucial liquidity support to the money market, given that they are the biggest lenders in the CBLO segment. As a result, their ability to influence price movements in equity and debt markets as also domestic liquidity conditions has increased over time. Notwithstanding 25 per cent CAGR in AUM over the last five years (2013-18), a comparison with the current state of global MF industry suggests that the penetration level of MFs in India needs to increase on a sustained basis with wider participation of retail investors. 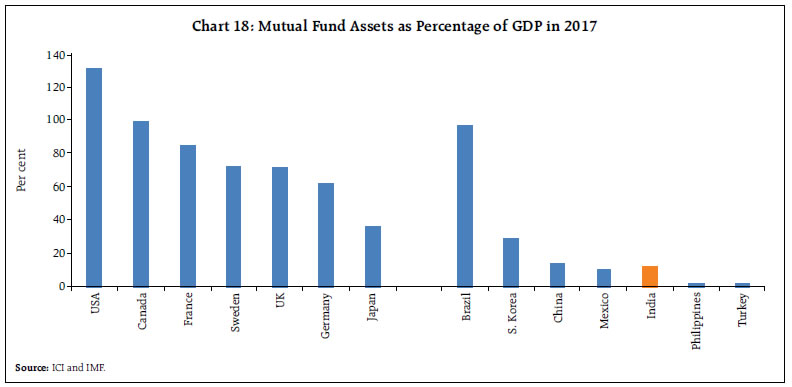
References: Baral, Prasanna K and Das, Kishore Kumar (2016), Mutual Funds Industry in India: A Growth Trend Analysis, International Journal of Multidisciplinary Research and Development, Online ISSN: 2349-4182 Print ISSN: 2349-5979. CARE Ratings Limited (2018), Growth in mutual funds industry. Dash, Manoranjan, Singh, Bhupal, Herwadkar, Snehal and Rasmi Ranjan Behera (2017), Financialisation of Savings into Non-Banking Financial Intermediaries, Mint Street Memo No. 02, Reserve Bank of India. Ghosh, Soheli (2016), Mutual Funds in India, Regal Publications. IMF (2015), Global Financial Stability Report: Navigating Monetary Policy Challenges and Managing Risks. Investment Company Institute (2017), Investment Company Fact Book, Washington, DC. Khorana, A., Servaes, H., & Tufano, P. (2005), Explaining the Size of the Mutual Fund Industry around the World, Journal of Financial Economics, 78 (1), 145-185. PWC (2013), Indian Mutual Fund Industry: Unearthing the growth potential in untapped markets. RBI (2017), Financial Stability Report. Sadhak, H. (2003), Mutual Funds in India – Marketing Strategies and Investment practices. SEBI (2014), Annual Report for 2013-14. SEBI (2017), Annual Report for 2016-17.
|