Sales growth of the private (non-financial) corporate business sector moderated for the fourth consecutive year led by a decrease in sales growth of manufacturing and IT sectors during 2014-15. Services (other than IT) sector partly recovered in 2014-15 showing higher growth in sales and EBITDA after some moderation last year. Net profit of the manufacturing sector contracted in 2013-14 and 2014-15 after a minor recovery in 2012-13. Performance in 2014-15 was affected primarily by the steep fall in oil prices during the year. This caused a sharp contraction in the sales and expenditure of the petroleum products industry group over the four quarters of 2014-15. This in turn, pulled down the aggregate as well as the manufacturing sector. However, an improvement was recorded in aggregate sales growth of non-oil companies for the first time in five years. Cost of raw materials (CRM) to sales was the lowest in 2014-15 compared with the last five years due to fall in commodity prices. The growth in raw material expenses for these companies remained low during the previous three financial years which aided in better EBITDA growth and margins improved in 2014-15. Weak signals of a plausible turnaround were visible in terms of marginally better Y-o-Y sales growth for few of the important industries like Cement, Motor Vehicles, Iron & Steel, Machinery on the back of either a contraction or extremely low sales growth in 2013-14. Quarterly results of 2,070 common companies showed declining trend in aggregate sales growth during the four quarters of 2014-15. It also showed higher EBITDA growth in the first half of the year which was not sustained. However, results for Q1:2014-15 indicated marginal improvement in sales growth excluding petroleum product industry. 1. Aggregate sales growth moderated and Operating profit (EBITDA) growth increased 1.1. Sales growth (Y-o-Y) of the private corporate sector continued to decelerate in 2014-15 for the fourth consecutive year. Nominal sales growth in this year was the lowest since 2001-02 (Chart 1). Value of production also decreased in 2014-15. Raw material expenses contracted in 2014-15 after a sharp deceleration in 2013-14. Staff costs also showed a moderating trend for three years in a row, although it remained at a higher level than that observed in 2009-10. The trends in various components of expenditure as a proportion to sales since 2008-09 till 2014-15 revealed that at the aggregate level, CRM (cost of raw materials) to sales recorded a steady increase till 2011-12 and then continued to moderate to some extent till 2013-14. However, it recorded a steep fall in 2014-15 and was the lowest since 2008-09 (Chart 2). The staff cost to sales ratios have increased in recent three consecutive years after hovering around the same level from 2009-10 to 2011-12 (Table 6). 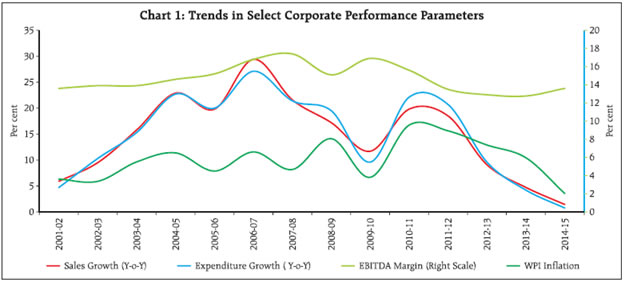 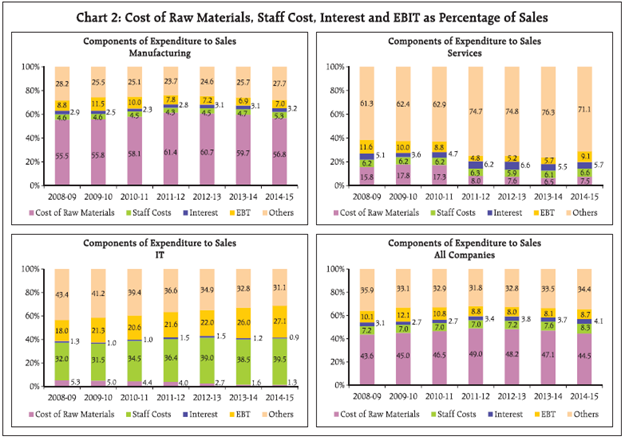
| Table 1A : Performance of the Listed Non-Government Non-Financial Companies | | No. of companies | 2014-15 | 2013-14* | | 2,925 | 2,854 | | Items | Amount (₹ billion) | Y-o-Y
Growth# in Per cent | Y-o-Y
Growth# in Per cent | | 1 | 2 | 3 | | Sales | 31,191 | 1.4 | 4.7 | | Value of Production | 31,330 | 1.3 | 4.0 | | Expenditure | 27,101 | 0.7 | 4.2 | | CRM** | 13,893 | -3.4 | 2.0 | | Staff Cost | 2,595 | 10.5 | 11.8 | | Power and Fuel | 1,152 | 5.1 | 1.0 | | Operating Profits(EBITDA) | 4,229 | 5.3 | 2.3 | | Other Income@@ | 923 | 14.0 | 15.2 | | Depreciation | 1,183 | 5.1 | 8.8 | | Gross Profits(EBIT) | 3,969 | 7.3 | 3.0 | | Interest | 1,270 | 4.4 | 11.5 | | Earnings Before Tax (EBT) | 2,699 | 8.8 | -0.5 | | Tax Provision | 770 | 25.3 | 3.6 | | Net Profits^ | 1,825 | -0.7 | -5.1 | | Paid-up Capital | 1,531 | 2.8 | 3.8 | * : Published in October 2014 issue of the RBI Bulletin
# : Growth rates calculated on the basis of common set of companies during any period
** : CRM : Consumption of Raw Materials
@@ : Includes forex gain while forex losses are included in Expenditure
^ : Adjusted for non-operating surplus/deficit | 1.2. Earnings before interest, tax, depreciation and amortization (EBITDA) growth increased on account of lower expenditure growth. Earnings before interest and tax (EBIT) increased in 2014-15 compared to 2013-14 consequent to increase in EBITDA. Net profit contracted in 2014-15 for the fourth consecutive year, though at a much lower rate compared with the earlier years. EBITDA margin increased in 2014-15 compared to 2013-14 but net profit margin remained range bound for previous three years. 1.3. Keeping in mind the huge impact of the fall in global petroleum prices, the performance of the companies excluding petroleum products was separately looked at in 2014-15 because the companies belonging to the petroleum products industry, recorded a significant contraction in sales (15.3 per cent Y-o-Y) and expenditure (17.4 per cent Y-o-Y). As expenditure contracted at a higher rate than sales, EBITDA growth improved in 2014-15. Contraction in other income led to a moderation in the net profit growth, which however remained at a higher level than the average of seven years. Improvement was observed in both EBITDA and net profit margins. 1.4. Based on 2,907 excluding petroleum product companies, slight improvement in Y-o-Y sales growth was observed in 2014-15 (4.7 per cent) compared with 3.9 per cent in the previous year though it remained much below the growth observed during 2008-09 to 2011-12 (Table 1B). | Table 1B : Performance of the Listed Non-Government Non-Financial Companies – Excluding Petroleum Products Industry | | Indicator | 2014-15 | 2013-14 | | No. of companies | 2,907 | 2,836 | | Growth Rate (Y-o-Y) | | Sales | 4.7 | 3.9 | | Expenditure | 4.5 | 3.4 | | Raw Material | 4.3 | -0.4 | | Staff Cost | 10.6 | 12.0 | | Power and Fuel | 5.2 | 1.0 | | EBITDA | 5.4 | 2.3 | | Other Income | 16.1 | 15.3 | | Depreciation | 6.4 | 10.7 | | EBIT | 7.4 | 2.4 | | Interest | 6.0 | 12.4 | | Tax Provision | 27.5 | 2.9 | | Net Profits | -2.1 | -7.3 | | Paid-up Capital | 3.4 | 3.6 | | Ratio (Per Cent) | | CRM/Sales | 49.0 | 49.0 | | Staff cost/Sales | 8.9 | 9.5 | | EBITDA to Sales | 13.9 | 14.3 | | EBIT to Sales | 12.8 | 13.3 | | Net Profit to Sales | 6.0 | 5.8 |
| Table 2: Important performance parameters | | Period | No. of Companies | Sales Growth | Expenditure Growth | EBITDA Growth | Net Profit Growth | EBITDA Margin (Per cent) | Net Profit Margin (Per cent) | | 1 | 2 | 3 | 4 | 5 | 6 | 7 | | 2008-09 | 2,549 | 17.2 | 19.5 | -1.0 | -18.4 | 15.1 | 8.1 | | 2009-10 | 2,629 | 11.7 | 9.6 | 26.6 | 28.8 | 16.9 | 9.4 | | 2010-11 | 2,763 | 19.8 | 22.1 | 12.4 | 15.8 | 15.6 | 9.0 | | 2011-12 | 2,679 | 18.5 | 20.7 | 1.7 | -16.8 | 13.5 | 6.4 | | 2012-13 | 2,931 | 9.1 | 9.6 | 3.5 | -2.0 | 12.9 | 5.9 | | 2013-14 | 2,854 | 4.7 | 4.2 | 2.3 | -5.1 | 12.8 | 5.8 | | 2014-15 | 2,925 | 1.4 | 0.7 | 5.3 | -0.7 | 13.6 | 5.9 | | Growth indicators are Y-o-Y | 2. Performance of small companies worsened further 2.1. Large companies exhibit a pattern of regularity in terms of filing their annual unaudited results as compared with the medium and small sized companies. This is evident from the fact that more number of small companies move in and out of the sample captured within reasonable time. 2.2. Large companies (sales more than ₹10 billion) recorded higher EBITDA growth, despite sales growth moderation. Medium companies (sales between ₹1 billion to ₹10 billion) recorded contraction in sales and profits. Sales growth of the small companies (sales less than ₹1 billion) faced major setback in 2013-14 and contracted further in 2014-15. For the small companies the sales growth contracted at a higher rate than the growth in components of expenditure viz., cost of raw materials and staff costs. This resulted in higher expenditure to sales ratio (Table 6) and consequent operating losses i.e., negative EBITDA. Among the three size groups, only the large companies showed slight improvement in margins from the level observed during the previous year (Table 4). | Table 3: Size class wise per cent share in sales and no. of companies | | Period | Large | Medium | Small | | No. of Companies | Per cent share in sales | No. of Companies | Per cent share in sales | No. of Companies | Per cent share in sales | | 1 | 2 | 3 | 4 | 5 | 6 | | 2008-09 | 268 | 76.8 | 933 | 20.7 | 1,348 | 2.5 | | 2009-10 | 323 | 79.1 | 973 | 18.8 | 1,333 | 2.2 | | 2010-11 | 401 | 81.7 | 1,049 | 16.6 | 1,313 | 1.7 | | 2011-12 | 414 | 84.0 | 998 | 14.6 | 1,267 | 1.4 | | 2012-13 | 462 | 85.3 | 1,079 | 13.3 | 1,390 | 1.3 | | 2013-14 | 474 | 86.3 | 1,001 | 12.4 | 1,379 | 1.3 | | 2014-15 | 472 | 86.8 | 1,025 | 12.0 | 1,428 | 1.2 |
| Table 4: Size class wise performance parameters | | Size Classes | Large | Medium | Small | | Period | Sales Growth | EBITDA Growth | Net Profit Growth | EBITDA Margin (Per cent) | Net Profit Margin (Per cent) | Sales Growth | EBITDA Growth | Net Profit Growth | EBITDA Margin (Per cent) | Net Profit Margin (Per cent) | Sales Growth | EBITDA Growth | Net Profit Growth | EBITDA Margin (Per cent) | Net Profit Margin (Per cent) | | 1 | 2 | 3 | 4 | 5 | 6 | 7 | 8 | 9 | 10 | 11 | 12 | 13 | 14 | 15 | | 2008-09 | 20.3 | 1.6 | -12.5 | 16.2 | 9.3 | 10.2 | -7.9 | -40.6 | 11.9 | 4.3 | -7.8 | -40.2 | -84.1 | 8.4 | 1.4 | | 2009-10 | 13.0 | 27.1 | 26.4 | 17.6 | 10.2 | 9.6 | 25.0 | 45.7 | 14.7 | 6.5 | -8.8 | 12.4 | 42.7 | 9.2 | 3.5 | | 2010-11 | 20.6 | 13.3 | 18.1 | 16.2 | 9.8 | 19.1 | 7.5 | 4.1 | 13.2 | 5.6 | -4.4 | 2.2 | -70.4 | 8.7 | 1.1 | | 2011-12 | 20.8 | 3.7 | -15.0 | 14.0 | 7.0 | 9.5 | -9.5 | -34.6 | 11.1 | 3.4 | -9.2 | -23.6 | 125.7 | 6.3 | 1.2 | | 2012-13 | 10.7 | 4.0 | 3.2 | 13.3 | 6.8 | 1.5 | 0.7 | -62.1 | 10.5 | 1.3 | -9.3 | -14.4 | $ | 5.4 | -4.7 | | 2013-14 | 6.0 | 5.2 | 0.2 | 13.4 | 6.8 | 1.0 | -15.1 | -77.3 | 9.6 | 0.6 | -26.3 | -58.2 | $ | 3.2 | -11.9 | | 2014-15 | 2.3 | 6.3 | 3.0 | 14.5 | 7.1 | -2.8 | 0.3 | @ | 8.6 | -0.8 | -15.6 | @ | $ | -1.7 | -17.6 | | Growth indicators are Y-o-Y |
2.3. Interest coverage ratio (EBIT/Interest Expenses) showed a steady decrease across all size groups particularly since 2011-12 (Chart 3). Interest expenses contracted significantly for the small sized companies in 2014-15. However the problem of poor debt servicing capability remained severe for small companies due to losses in the operating level itself, which further worsened the losses in the EBIT level. 3. Improvement in non-IT services sector 3.1. Sales growth of the manufacturing sector further worsened in 2014-15 and reached its lowest in the last seven years, but there has been an improvement in EBITDA growth (Table 5). The performance of the IT sector declined in 2014-15, with declining growth rates of sales, EBITDA and net profit after considerable improvement in the previous year. There has been a noticeable turnaround in the performance of non-IT service sector with exceptional EBITDA and net-profit growth in 2014-15. However this jump in net profit growth was caused by the performance of a few select companies in the transportation, storage & communications and the trading industry. EBITDA margin improved for the manufacturing and non-IT sector and it has decreased slightly for IT sector. | Table 5: Sector wise important performance parameters | | Sector | Manufacturing | Services (other than IT) | IT | | Period | Sales Growth | EBITDA Growth | Net Profit Growth | EBITDA Margin (Per cent) | Net Profit Margin (Per cent) | Sales Growth | EBITDA Growth | Net Profit Growth | EBITDA Margin (Per cent) | Net Profit Margin (Per cent) | Sales Growth | EBITDA Growth | Net Profit Growth | EBITDA Margin (Per cent) | Net Profit Margin (Per cent) | | 1 | 2 | 3 | 4 | 5 | 6 | 7 | 8 | 9 | 10 | 11 | 12 | 13 | 14 | 15 | | 2008-09 | 16.3 | -4.1 | -25.6 | 13.5 | 6.6 | 12.2 | -8.2 | -22 | 20.9 | 10.7 | 18.1 | 17.9 | 2.7 | 20.6 | 15.5 | | 2009-10 | 13.3 | 33.9 | 45.2 | 16.1 | 8.6 | 3.7 | 0.0 | -19.8 | 18.0 | 8.2 | 5.0 | 19.1 | 19.1 | 23.4 | 17.8 | | 2010-11 | 23.0 | 11.9 | 20.6 | 14.4 | 8.3 | 7.1 | 9.3 | 3.4 | 17.7 | 7.8 | 15.0 | 11.4 | 12.5 | 22.2 | 16.7 | | 2011-12 | 19.5 | 0.1 | -21.7 | 11.9 | 5.5 | 14.3 | -0.7 | -42.2 | 16.1 | 3.7 | 18.6 | 14.9 | 23.3 | 21.6 | 17.5 | | 2012-13 | 9.4 | 3.1 | 3.6 | 11.3 | 5.4 | 10.7 | 6.0 | -29.6 | 16.0 | 2.7 | 11.3 | 17.0 | 7.1 | 22.5 | 16.8 | | 2013-14 | 4.3 | -0.2 | -7.5 | 10.9 | 4.9 | 1.9 | -4.5 | -33.5 | 15.0 | 3.6 | 17.0 | 28.6 | 25.8 | 25.5 | 19.1 | | 2014-15 | 0.4 | 3.3 | -6.7 | 11.5 | 4.6 | 5.9 | 32.4 | @ | 17.9 | 6.7 | 8.9 | 6.5 | 7.4 | 24.7 | 19.2 | | Growth indicators are Y-o-Y |
3.2. During 2014-15, CRM to sales ratio continued its gradual declining trend for the manufacturing sector as a whole, while staff costs to sales ratio increased for the third consecutive year (Table 6). The non-IT services sector witnessed an increase in both CRM and staff cost to sales ratio in 2014-15. For IT sector an increase in staff cost to sales ratio is observed in 2014-15. Almost all sectors and size groups recorded an increase in staff cost to sales ratio during 2014-15 compared to previous year. Interest to sales ratio has gradually increased from 2.7 per cent in 2009-10 to 4.1 per cent in 2014-15, witnessing minor fluctuations in between. | Table 6: CRM, Staff Cost and Interest Expenditure as percentage to Sales | | Period | CRM | Staff Cost | Interest Exp. | CRM | Staff Cost | Interest Exp. | CRM | Staff Cost | Interest Exp. | | Large | Medium | Small | | 1 | 2 | 3 | 4 | 5 | 6 | 7 | 8 | 9 | | Manufacturing | | 2008-09 | 55.4 | 4.1 | 2.6 | 56.3 | 6.0 | 4.0 | 50.5 | 7.8 | 5.3 | | 2009-10 | 56.4 | 4.1 | 2.2 | 53.9 | 6.3 | 3.5 | 50.4 | 8.2 | 5.0 | | 2010-11 | 58.9 | 4.0 | 2.0 | 55.4 | 6.4 | 3.5 | 49.5 | 8.0 | 3.9 | | 2011-12 | 62.5 | 3.8 | 2.5 | 56.0 | 6.6 | 4.2 | 51.1 | 9.4 | 5.0 | | 2012-13 | 61.5 | 4.0 | 2.8 | 56.4 | 7.0 | 4.3 | 51.7 | 9.4 | 6.4 | | 2013-14 | 60.4 | 4.2 | 2.7 | 56.3 | 7.0 | 4.7 | 50.2 | 9.8 | 9.7 | | 2014-15 | 57.2 | 4.9 | 2.9 | 54.9 | 7.4 | 5.1 | 51.5 | 10.1 | 7.7 | | Services (Other than IT) | | 2008-09 | 15.7 | 5.2 | 5.0 | 15.7 | 9.6 | 5.3 | 18.0 | 10.7 | 6.8 | | 2009-10 | 18.8 | 5.2 | 3.1 | 14.1 | 9.6 | 5.0 | 14.8 | 11.9 | 7.5 | | 2010-11 | 18.7 | 5.3 | 4.3 | 10.1 | 10.1 | 6.7 | 19.6 | 10.5 | 7.5 | | 2011-12 | 7.8 | 5.3 | 5.1 | 8.2 | 10.0 | 11.2 | 15.1 | 10.3 | 6.6 | | 2012-13 | 6.8 | 4.6 | 4.7 | 9.4 | 10.9 | 14.9 | 20.6 | 10.8 | 6.3 | | 2013-14 | 5.4 | 4.9 | 4.1 | 10.3 | 11.4 | 11.6 | 16.1 | 11.0 | 11.6 | | 2014-15 | 6.3 | 5.4 | 4.7 | 12.0 | 12.1 | 9.0 | 19.9 | 11.7 | 16.6 | | IT | | 2008-09 | 5.2 | 32.4 | 1.0 | 4.7 | 30.9 | 2.5 | 12.0 | 26.1 | 3.5 | | 2009-10 | 4.8 | 31.4 | 0.6 | 4.9 | 34.6 | 2.9 | 12.2 | 21.7 | 3.6 | | 2010-11 | 4.2 | 34.8 | 0.7 | 4.1 | 34.0 | 2.4 | 15.5 | 24.3 | 7.0 | | 2011-12 | 3.3 | 36.6 | 1.0 | 7.9 | 35.5 | 4.2 | 15.2 | 31.6 | 9.1 | | 2012-13 | 2.0 | 39.4 | 0.8 | 7.6 | 36.2 | 6.0 | 10.5 | 33.5 | 9.2 | | 2013-14 | 1.3 | 38.4 | 0.5 | 2.1 | 41.2 | 7.2 | 17.3 | 28.4 | 18.7 | | 2014-15 | 1.0 | 39.8 | 0.4 | 4.7 | 37.3 | 6.7 | 13.3 | 31.7 | 11.9 | | All Companies | | 2008-09 | 42.7 | 6.9 | 2.8 | 47.1 | 7.9 | 4.2 | 41.3 | 9.9 | 5.4 | | 2009-10 | 45.0 | 6.7 | 2.4 | 45.8 | 8.1 | 3.9 | 41.7 | 9.9 | 5.2 | | 2010-11 | 46.7 | 6.7 | 2.4 | 46.3 | 8.4 | 3.9 | 41.4 | 10.0 | 5.2 | | 2011-12 | 49.6 | 6.6 | 3.0 | 46.5 | 8.8 | 5.2 | 41.3 | 11.4 | 6.2 | | 2012-13 | 48.6 | 6.9 | 3.4 | 46.4 | 9.1 | 6.0 | 42.0 | 11.7 | 7.2 | | 2013-14 | 47.3 | 7.3 | 3.2 | 46.9 | 9.0 | 6.1 | 39.6 | 11.7 | 11.3 | | 2014-15 | 44.4 | 8.1 | 3.7 | 46.0 | 9.3 | 6.5 | 40.4 | 12.0 | 10.2 | | Sales is less than ₹1bn for small companies; between ₹1 bn to ₹10 bn for medium companies and more than ₹10bn for large companies. | 3.3. Based on half-yearly financial statements of 2,638 companies common for previous 3 half years i.e., from half years ended March 2014 to March 2015 it is observed that the improved performance of the non-IT services sector resulted in lower leverage (debt to equity) ratio and higher interest coverage and solvency ratio during the second half of 2014-15 compared to previous year. The leverage ratio also improved for the manufacturing sector. Return on assets (ROA) weakened for all sectors and this decline was highest for IT sector. The IT sector weakened in terms of main financial ratios in tune with its declining growth rates of performance parameters. The manufacturing and non-IT services sector improved in terms of quick and current ratio. 4. Performance of major industries - weak signs of recovery in only few industries 4.1. Most of the industries remained much below the seven year average performance in terms of sales growth and EBITDA margin. However, a few major industries showed some signs of marginal recovery from successive deterioration. 4.2. In the basic goods sector, sales growth (Y-o-Y) improved for the Cement and the Iron & Steel industry in 2014-15 after successive and significant deceleration since 2011-12 ending in an overall contraction in 2013-14 (Chart 4 & 5). Margins are yet to recover to the levels observed in 2008-09 for both the industries. The Iron & Steel industry recorded a significant rise in interest burden, both due to a fall in profits and rise in interest. With a heavy share in aggregate borrowings, it turned out to be one of the most vulnerable industries. Also, the operating cash flow contracted for the group of 21 companies that have reported their cash flow statements for 2014-15. The net cash used in financing activities increased with a rise in long-term and short-term borrowings and interest related payments. The Cement industry on the other hand could increase its operating cash flow as well as the investing cash flow. 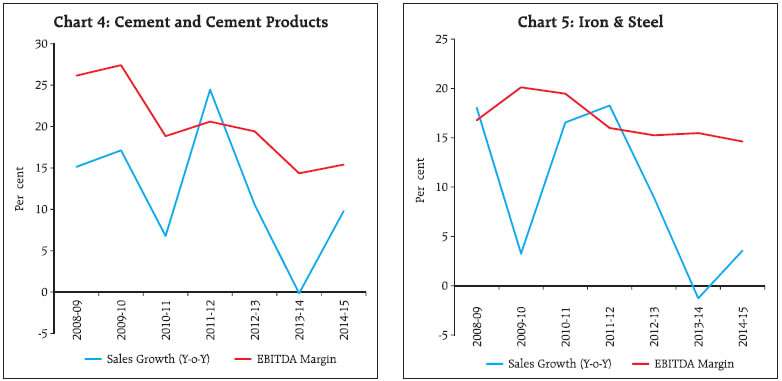 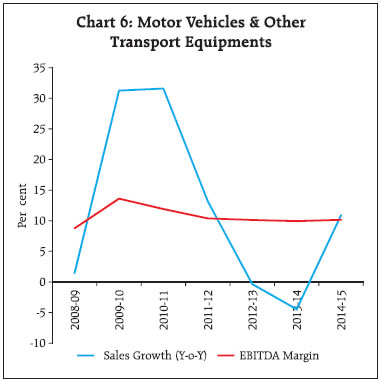 4.3. In the consumer goods sector, the Motor Vehicles industry recovered significantly after two years of successive contractions in Y-o-Y sales, although the growth rates remained lower than that observed during 2009-10 and 2010-11. However, an early analysis of the cash flow statements indicated lower operating cash flows. A pickup in EBITDA growth was observed. Net profit suffered significantly in 2011-12 and is still in contraction. The Pharmaceuticals industry slowed down with respect to sales and EBITDA growth, while net profits contracted. The Textile industry stagnated in terms of sales growth with heavy contraction in net profit. Textiles is another vulnerable industry with high leverage, poor interest burden and large borrowings. Cash used in financing activities increased significantly in the early sample of cash flow statements in this industry. 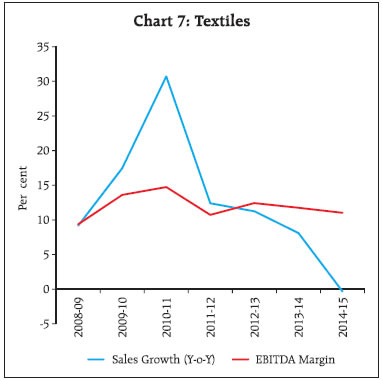 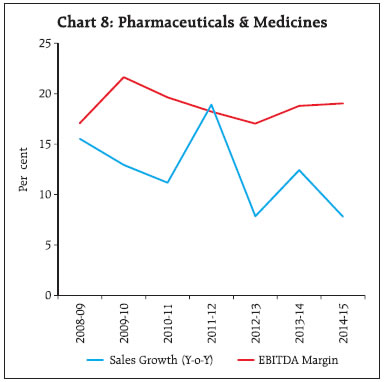 4.4. In the capital goods sector, sales growth of the Machinery industry continued to remain weak, after the temporary recovery observed in 2010-11 and 2011-12 (Chart 9). Sales growth was higher in 2014-15 as compared to 2013-14. EBITDA showed a minor positive growth but net profit contracted significantly for the fourth consecutive year, and profitability remained low. The Construction industry contracted in sales after three years of successive deceleration (Chart 10). Expenditure growth also contracted in 2014-15. This led to contracting profits but profitability remained flat. Interest burden leaped up in 2013-14 and 2014-15, although aggregate interest expenses showed lower growth. 5. Contraction of sales and net profits on a quarterly basis. 5.1. Performance of a common sample of 2,070 listed non-government non-financial companies on a quarterly basis showed fluctuations in sales growth (Y-o-Y) from Q1:2013-14 to Q2:2014-15 followed by successive contractions in Q3 and Q4 of 2014-15 (Table 8). EBITDA growth decreased from 10 per cent in Q2:2014-15 to 1.2 per cent in the next quarter and improved to 4 percent in Q4:2014-15. | Table 7 : Important Performance Parameters of Select Industries | | Industry | Period | Large | Medium | Small | All Companies | | Sales Growth | EBITDA Margin
(Per cent) | Net Margin (Per cent) | Sales Growth | EBITDA Margin
(Per cent) | Net Margin (Per cent) | Sales Growth | EBITDA Margin
(Per cent) | Net Margin (Per cent) | Sales Growth | EBITDA Margin
(Per cent) | Net Margin (Per cent) | | 1 | 2 | 3 | 4 | 5 | 6 | 7 | 8 | 9 | 10 | 11 | 12 | 13 | | Cement and Cement products | 2013-14 | 0.6 | 15.3 | 7.7 | -6.3 | 6.4 | -0.5 | -14.8 | 5.6 | 1.2 | -0.1 | 14.4 | 6.9 | | | 2014-15 | 9.7 | 15.8 | 7.2 | 9.1 | 11.2 | 6.7 | 34.9 | 9.2 | 0.8 | 9.8 | 15.4 | 7.1 | | Construction | 2013-14 | 1.9 | 11.5 | 2.8 | -12.1 | 11.4 | 1.1 | -23.6 | 16.4 | 6.6 | 0.1 | 11.6 | 2.7 | | | 2014-15 | -3.0 | 11.9 | 2.2 | -12.0 | 7.5 | -8.8 | -9.7 | 13.1 | 4.1 | -4.1 | 11.5 | 1.1 | | Iron and Steel | 2013-14 | 2.0 | 17.9 | 4.2 | -14.4 | 2.9 | -3.7 | -31.5 | -0.9 | -39.6 | -1.3 | 15.5 | 2.7 | | | 2014-15 | 4.3 | 15.8 | 2.1 | 0.1 | 5.0 | -4.2 | -26.9 | -4.7 | -25.2 | 3.6 | 14.6 | 1.3 | | Motor Vehicles and other transport equipments | 2013-14 | -4.4 | 10.2 | 6.0 | -4.4 | 8.3 | 2.6 | -8.9 | 1.0 | -5.9 | -4.5 | 9.9 | 5.6 | | | 2014-15 | 13.0 | 10.6 | 4.0 | -3.9 | 6.7 | -2.4 | -28.3 | -21.8 | -43.3 | 10.9 | 10.2 | 3.3 | | Pharmaceuticals and medicines | 2013-14 | 14.2 | 20.4 | 13.3 | 8.0 | 13.8 | 4.4 | -8.4 | 5.3 | -0.6 | 12.4 | 18.8 | 11.2 | | | 2014-15 | 10.7 | 20.6 | 13.1 | -3.1 | 12.7 | 4.5 | -4.4 | 6.4 | -3.2 | 7.8 | 19.0 | 11.4 | | Textiles | 2013-14 | 7.1 | 13.7 | 3.3 | 11.5 | 8.8 | 0.3 | -3.9 | 0.7 | -14.8 | 8.1 | 11.7 | 1.8 | | | 2014-15 | 2.7 | 14.3 | 3.7 | -6.1 | 4.7 | -3.5 | -1.9 | 3.5 | -9.0 | -0.3 | 11.0 | 1.1 | | Machinery^ | 2013-14 | 1.5 | 9.6 | 6.0 | -2.4 | 7.4 | 0.1 | -14.1 | 7.2 | 0.6 | 0.5 | 9.1 | 4.8 | | | 2014-15 | 3.0 | 8.8 | 2.3 | 5.4 | 9.1 | 2.7 | -11.4 | 4.6 | -6.2 | 3.1 | 8.8 | 2.2 | ^: includes Machinery & Machine Tools and Electrical Machinery and Apparatus
Sales is less than ₹1bn for small companies; between ₹1 bn to ₹10 bn for medium companies and more than ₹10bn for large companies.
Growth indicators are Y-o-Y |
| Table 8: Performance of the Select companies over the Quarters - 2013-14 and 2014-15 | | Item | 2013-14 | 2014-15 | | Q1 | Q2 | Q3 | Q4 | Q1 | Q2 | Q3 | Q4 | | 1 | 2 | 3 | 4 | 5 | 6 | 7 | 8 | | No. of companies | 2,070 | | Year-on-year Growth rate in Per cent | | Sales | 3.0 | 8.4 | 5.8 | 6.5 | 8.3 | 4.7 | -0.1 | -4.4 | | Expenditure | 2.4 | 8.8 | 4.4 | 6.5 | 7.8 | 4.0 | 0.4 | -6.0 | | Operating Profits (EBITDA) | 2.2 | 1.1 | 5.6 | 6.4 | 14.1 | 10.0 | 1.2 | 4.0 | | Other Income | 27.4 | 0.4 | 28.0 | 9.4 | -0.7 | 33.2 | 3.5 | 8.4 | | Depreciation | 8.8 | 11.8 | 7.3 | 8.4 | 7.3 | 4.4 | 6.0 | 5.9 | | Gross Profits (EBIT) | 4.9 | -1.9 | 8.9 | 6.5 | 12.8 | 16.9 | 0.3 | 4.5 | | Interest | 8.0 | 16.7 | 6.9 | 6.9 | 2.3 | 5.3 | 8.8 | 10.7 | | Net Profits | -3.4 | -14.7 | 7.1 | 11.6 | 24.6 | 29.7 | -8.5 | -10.3 | | Ratios in Per cent | | Cost of Raw Materials to Sales | 55.0 | 57.4 | 56.3 | 57.2 | 56.0 | 56.9 | 53.8 | 51.5 | | Staff Costs to Sales | 7.9 | 7.9 | 7.6 | 7.4 | 8.0 | 8.2 | 8.5 | 9.0 | | Interest to Sales | 3.6 | 3.5 | 3.4 | 3.3 | 3.5 | 3.6 | 3.8 | 3.8 | | Interest to Gross profits | 29.3 | 29.3 | 28.0 | 26.6 | 26.4 | 26.7 | 30.5 | 28.1 | | Interest Coverage (Times) | 3.4 | 3.4 | 3.6 | 3.8 | 3.8 | 3.7 | 3.3 | 3.6 | | EBITDA to Sales | 13.2 | 12.7 | 13.3 | 13.2 | 14.1 | 13.5 | 13.5 | 14.3 | | EBIT to Sales | 12.4 | 11.9 | 12.3 | 12.4 | 13.1 | 13.4 | 12.4 | 13.6 | | Net Profits to Sales | 6.2 | 6.0 | 6.5 | 6.9 | 7.2 | 7.4 | 5.9 | 6.6 | 5.2. Growth rates in net profits recorded and sustained high positive growth from Q3:2013-14 to Q2:2014-15 and subsequently contracted sharply in Q3 and Q4:2014-15. An explanation for the deteriorating net profit growth in Q4 could be the higher interest to gross profits despite positive growth rate in EBITDA (operating profits) and EBIT (gross profits). Interest coverage ratio remained steady across all quarters. EBITDA margins also maintained at a steady level during the eight quarter period. Other income increased from 3.5 per cent in Q3 to 8.4 per cent in Q4:2014-15. 5.3. Growth rates in both staff expenses and interest expenses, exhibited a gradual increase from Q1 to Q4:2014-15 whereas growth in CRM contracted sharply to negative 17.4 per cent in the last quarter. 5.4. Results available for Q1:2015-16 (April-June 2015) indicated a contraction in sales growth, but at a lower rate compared to Q4:2014-15 for the aggregate level and the manufacturing sector. The sales growth of the IT sector improved compared with previous quarter. There has also been an improvement in profitability ratio at the aggregate level.
Annex
Explanatory Notes 1. Selection of companies: a. Results of companies which were available for financial year 2014-15 i.e. April 2014 to March 2015 were directly included in the sample. b. Some companies fi led earnings results ending March 2015, but covered either more than or less than a year and therefore were not directly comparable with the results reported by them for the previous year. Profit and Loss statements for such companies were generated from the comparable quarterly earnings results fi led by them during FY: 2014-15. c. Profit and loss statements of companies with financial year ending other than March were also included in the sample using a similar method of aggregating quarterly results as in (b) above. d. In case of major amalgamations, profit and loss statements of the previous years were reconstructed from individual statements of the respective companies. 2. To compute the growth rates in any period, a common set of companies for the current and previous period is considered. 3. The classification of industries and sectors broadly follows the National Industrial Classification (NIC). 4. The manufacturing sector consists of industries like Iron & Steel, Cement & Cement products, Machinery & Machine Tools, Motor Vehicles, Rubber, Paper, Food products etc. This does not include ‘Tea Plantations’ and ‘Mining & Quarrying’ industries. The services (other than IT) sector includes Real Estate, Wholesale & Retail Trade, Hotel & Restaurants, Transport, Storage and Communication industries. This does not include Construction and Electricity Generation & Supply Industries. 5. FOREX gain and loss are reported on net basis by companies and included in the net profit calculation. While net FOREX loss is considered as a part of the expenditure and thus included in EBITDA, net FOREX gain is considered as a part of other income and included in EBIT. 6. Other income includes various regular incomes like rents, dividends, royalties etc. and does not include extra-ordinary income/expenses. 7. Extra-ordinary income/expenses are included in EBT and net profit. As the name suggests, these income/ expenses can be very large for some of the companies in a particular quarter. 8. Some companies report interest on net basis. However, some companies include the interest expenses on gross basis, where, interest received is reported in other income. 9. The ratio / growth rate for which denominator is negative or negligible is not calculated, and is indicated as ‘$’ or ‘@’ respectively. Glossary of Terms | EBITDA | - | Operating Profits / Earnings before Interest, Tax, Depreciation & Amortization | - | Sales + Change in Stock – Expenditure | | EBIT | - | Gross Profits/Earnings before Interest & Tax | - | EBITDA + Other Income – Depreciation & Amortisation | | EBT | - | Earnings before Tax | - | EBIT – Interest Payment + Extra-ordinary income/expenses | | Net Profit | - | - | EBT – Tax | | Interest Burden | - | - | Interest Payment / EBIT*100 | | Interest Coverage | - | - | EBIT/Interest Payment |
|