The article captures capital expenditure (investment in fixed assets) intentions of the companies in private and joint business sector in order to assess broadly the short-term changes in business sentiment. The analysis is based on envisaged cost of projects for which funds are raised from banks/FIs or through External Commercial Borrowings (ECB) or domestic equity issues. In all, 969 companies were found to have made investment plans during 2012-13 at an aggregate cost of `2,634 billion as compared with investment plans of `2,509 billion by 1,127 companies in 2011-12. Of these, the number of projects assisted by banks/FIs came down to 425 (aggregate cost `1,963 billion) in 2012-13 from 668 projects (aggregate cost `2,120 billion) in 2011-12. However, 32 such projects were cancelled/modified during the current year and the cost of projects still under implementation has been revised to `1,916 billion.
The investment plan in 2012-13 was led by high value projects (projects with cost more than `50 billion & above) envisaged in power, metal & metal products and telecom industries. Further, the time phasing details of the investment intentions of these companies indicate investments to the tune of `2,919 billion in 2012-13, which is lower by 20.8 per cent than the revised estimate for 2011-12. Further, based on the plans up to 2012-13, the capital expenditure already planned in 2013-14 aggregated to `1,620 billion. Thus, for matching the level of aggregate capex of 2012-13 in 2013-14, a minimum capital expenditure of around `1,299 billion would need to come from new investment intentions of the private corporate sector in 2013-14, which going by the assessment on date, appears to be non-achievable.
1. Introduction
A capital expenditure (or capex) is incurred when a business entity either buys fixed assets or adds value to an existing fixed asset with a useful life that extends beyond an accounting year. Capital expenditure, be it for modernisation and expansion of productive capacity of an existing business or for the development of a new business, is vital for further growth and to remain competitive in a business environment. At the macro level, a nation’s economic growth is strongly correlated with rate of investment, especially in emerging economies. In India, the private corporate sector together with the household sector are the major source of investment. Thus, information on capital investment intentions of the companies in private and joint business sector help us to assess the likely shortterm changes in business sentiment and provides some idea about likely investment scenario. Indian economy has been witnessing a long and strong investment cycle over last few years, which seems to have reversed in 2011-12 and has further weakened in 2012-13.
This article captures investment (i.e., capital expenditure) intentions of the companies in private and joint business sector based on financing details of such investment. Further, the phasing details indicated by the companies while raising funds were analysed to capture the capital expenditure that would have been made during 2012-13. Capital expenditure envisaged from pipeline projects are also estimated for 2013-14. Finally, the article dwells on the prospects of attaining the level of capital expenditure for 2012-13, in 2013-14, based on the emerging scenario.
The article is organised in five sections. Section 2 presents the methodology, scope, coverage and the limitations. Section 3 outlines nature of new projects planned by the corporates in 2012-13. It covers all projects where funds have been raised through banks/ FIs/capital markets/ECBs. However, analysis at disaggregated levels according to size-class, industrial sector, location/State and purpose has been made only for those projects that are covered by institutional assistance. Section 4 estimates capital expenditure of corporate sector likely to have been incurred during 2012-13. Based on the current economic scenario, an outlook for corporate investment during 2013-14 is presented in section 5.
2. The Approach – Methodology, Coverage and Limitations
In the National Accounts Statistics, investment by the private corporate sector is estimated primarily following the expenditure approach, i.e., from the expenditure on construction and machinery and equipment during a year together with change in stocks and net acquisition of variables. However, these estimates are available with a considerable time lag. As an alternative, banks/FIs, which constitute the conventional source of raising funds for large-sized capital expenditure, can provide some idea about the investment plans of such corporates.
The methodology followed originates from what was proposed by Dr. C. Rangarajan in his article titled “Forecasting Capital Expenditure in the Corporate Sector” published in the December 13, 1970 issue of the ‘Economic and Political Weekly’. As suggested therein, the envisaged phasing details of total project cost as mentioned in the project proposals by companies should indicate the likely level of capital expenditure (capex) in the years of their implementation. Though banks/FIs constitute the conventional source of raising funds for large-sized capital expenditure, companies are also increasingly raising funds through several other avenues such as domestic capital markets, ECBs/foreign currency convertible bonds (FCCBs), private placement of bonds/debentures and American Depository Receipts (ADRs)/Global Depository Receipts (GDRs). Thus, the coverage has been enhanced subsequently with incorporation of capex raised through domestic capital market and ECBs/FCCBs.
The study is based on comprehensive data obtained from 39 banks/FIs1, which are usually active in project finance. This data is based on the project reports prepared by them before sanctioning financial assistance to companies. The data collected includes various details such as total envisaged capital expenditure, its phasing details together with information on industry, purpose and location of project. Projects with envisaged cost of `100 million & above are required to be reported by banks/FIs.
Capital spending envisaged by the companies that raised ECBs (including FCCBs) to finance their capital outlays was obtained from Form 83 submitted to the Reserve Bank by these companies while raising funds through ECBs. The details captured include purpose of the loan and the drawal schedule, which was considered as indicative of time phasing of utilisation of the funds raised through ECBs. Only those companies that indicated their primary purpose of raising ECBs as capital expenditure were included in the study. Similarly, the information on envisaged capital spending and corresponding phasing details, as indicated in prospectus of the companies issuing equity capital in domestic capital market and available with SEBI was gathered to capture investment plans of such companies. Care was taken to include a project only once if the project is financed through various sources.
However, the investment intentions of companies raising funds exclusively through private placements of debenture/bonds or through ADRs/GDRs could not be captured due to inadequacy of information on the end-use and the spending pattern over the years2. It is also presumed that no large project is entirely financed through internal accruals alone.
The validity of the assessment on corporate investment in the various years of implementation heavily rests upon the assumption that companies would adhere to the expenditure patterns outlined in the initial proposals. Thus, estimates of corporate investment presented in this article are ex ante and differ in scope and methodology from the ex post estimates of corporate fixed investment available in National Accounts Statistics (NAS)3. It is also observed that some of the projects reported by banks/FIs in one year are cancelled/modified subsequently and this poses a problem in comparability.
3. Projects Planned during 2012-13
The present study captures investment intentions of corporates covering 425 projects with an aggregate project cost of `1,963 billion, each with project cost of `100 million and above, for which assistance was sanctioned by banks/FIs in 2012-13. In addition, the study covers proposed investment of 519 companies contracting ECBs/FCCBs in 2012-13 aggregating `660 billion and proposed investment of `11 billion intended by 25 companies by issuing domestic equity during 2012-13. All together, the new investment intentions of 969 companies covered in 2012-13 aggregated to `2,634 billion as against the investment intentions of 1,127 companies at an aggregate cost of `2,509 billion captured in 2011-12.
3.1. Cost of Projects receiving Institutional Assistance was marginally higher
As against 425 projects having an outlay of `1,963 billion, for which institutional assistance was sanctioned by banks/FIs during 2012-13, 668 projects with aggregate cost of `2,120 billion were sanctioned during 2011-12 (Table 1). However, 32 such projects were cancelled during the current year, as such the cost of projects sanctioned during 2011-12 has been revised to `1,916 billion.
Table 1 : Spending Pattern of Projects Sanctioned in 2011-12 and 2012-13 |
(` billion) |
Envisaged Capital expenditure in the Year → |
2009-10 |
2010-11 |
2011-12 |
2012-13 |
2013-14 |
2014-15 |
2015-16 |
2016-17 |
2017-18 |
Total |
1 |
2 |
3 |
4 |
5 |
6 |
7 |
8 |
9 |
10 |
Projects Sanctioned in 2011-12 |
Number of Projects : 636 |
| |
57 |
230 |
669 |
554 |
282 |
95 |
29 |
- |
- |
1,916 |
| |
(3.0) |
(12.0) |
(34.9) |
(28.9) |
(14.7) |
(4.9) |
(1.5) |
- |
- |
(100.0) |
Projects Sanctioned in 2012-13 |
Number of Projects : 425 |
| |
- |
1 |
384 |
587 |
519 |
277 |
111 |
64 |
20 |
1,963 |
| |
- |
- |
(19.6) |
(29.9) |
(26.5) |
(14.1) |
(5.6) |
(3.3) |
(1.0) |
(100.0) |
- : Nil/Negligible.
Note: Figures in the brackets denote percentage share in the total. |
The phasing details of fresh sanctions in 2012-13 showed that about 29.9 per cent of the total proposed spending (`587 billion) was planned to be incurred in the same year and another 26.5 per cent (`519 billion) was to be spent in 2013-14. An amount of `472 billion is proposed to be spent during 2014-18. It may be noted that around 19.6 per cent of total project cost envisaged by these projects was already spent in previous years (i.e., 2010-11 and 2011-12). The spending pattern has broadly remained similar over the years.
3.1.1 Industrial Pattern of Projects – Power and Metal & Metal Products had dominant share
Industry level analysis revealed that power, telecom, metal & metal products, textile, cement, construction and hotel & restaurants industries dominate investment proposals of the private corporate sector. These industries together shared 59.3 per cent to 85.3 per cent (lowest at 59.3 per cent in 2006-07 and highest at 85.3 per cent in 2012-13) of total cost of envisaged projects in various years (Annex 1).
In 2012-13, power sector accounted for 40.3 per cent of the total envisaged cost of projects while share of metal & metal products industry jumped from 16.3 per cent in 2011-12 to 27.9 per cent in 2012-13. Among other industries, share of telecom, cement and construction industries also rose in 2012-13 whereas those of textiles, chemicals & pesticide, hotel & restaurants, transport equipment and transport services witnessed decline when compared with previous year. Most of the high cost projects (`50 billion & above) were in metal & metal products, power and telecom industries in 2012-13 (Chart 1).
3.1.2 Size-wise Pattern of Projects – Share of highvalue projects increased
Institutionally assisted projects were generally of high value (projects with envisaged cost `10 billion & above). Their share ranged between 45.4 per cent in 2005-06 and 78.3 per cent in 2009-10. In 2012-13, share of projects with envisaged cost `50 billion & above increased to 44.8 per cent from 33.4 per cent in 2011- 12. Over the years, share of mid-sized projects (with envisaged costs between `5 billion and `10 billion) which were sanctioned institutional assistance declined (Annex 2).
3.1.3 State-wise Pattern of Projects – Reflecting industry preference
Spatial distribution of projects tends to vary considerably from year to year reflecting industrial preference. Location of projects for a particular industry depends on many factors such as availability of raw material and skilled labour, adequacy of infrastructure, market size, growth prospects, etc. Furthermore, sanction of high value projects also changes the spatial pattern.
It is observed that, most of the investment proposals are undertaken in Maharashtra, Gujarat, Andhra Pradesh, Tamil Nadu and Karnataka, which are considered as industrially advanced. Share of Odisha has increased over the years due to its mineral resources. While Gujarat attracted investment proposals mainly in the industries like infrastructure, petroleum products, metal & metal products and textiles, project investments in Maharashtra has been across almost all industries with larger share coming from infrastructure (mainly power & telecom), transport services, textile and construction. States like Odisha (topped the list in 2009-10 & 2012-13), Chhattisgarh (occupied top position in 2010-11) and Madhya Pradesh became favoured destination for the industries like power and metal & metal products. Telecom Industry projects are usually well spread across a number of states resulting in higher share of multiple states (Annex 2 & 3).
Odisha, Maharashtra and Punjab together accounted for 48.4 per cent of the envisaged cost of projects for which institutional assistance was sanctioned in 2012-13. Odisha and Punjab attracted high value projects in power and metal & metal products, while projects in power and electrical equipments & electronics industries are to be based in Maharashtra. However, the share of Maharashtra in total envisaged cost of projects decreased in 2012-13 as compared to the previous year, along with Karnataka, Gujarat and Tamil Nadu (Chart 2).
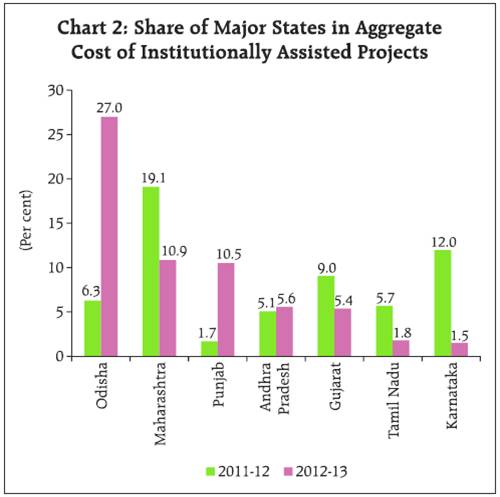
Table 2: Phasing of Capital Expenditure of Institutionally Assisted Projects by Banks/FIs |
(` billion) |
Year of
sanction ↓ |
Project Cost
in the Year
of Sanction |
Project Cost due
to Revision/
Cancellation@ |
Envisaged Capital expenditure in the Year ® |
2005-06 |
2006-07 |
2007-08 |
2008-09 |
2009-10 |
2010-11 |
2011-12 |
2012-13 |
2013-14 |
Beyond 2013-14 |
1 |
2 |
3 |
4 |
5 |
6 |
7 |
8 |
9 |
10 |
11 |
12 |
Upto 2004- 05 |
|
|
405 |
154 |
54 |
12 |
1 |
|
|
|
|
|
2005-06 |
1,342 |
1,313 (2.2) |
413 |
439 |
237 |
85 |
23 |
18 |
|
|
|
|
2006-07 |
2,834 |
2,754 (2.8) |
149 |
946 |
942 |
496 |
148 |
31 |
20 |
|
|
|
2007-08 |
2,844 |
2,297 (19.2) |
5 |
113 |
593 |
723 |
411 |
326 |
78 |
47 |
|
|
2008-09 |
4,228 |
3,111 (26.4) |
|
1 |
263 |
1,013 |
829 |
529 |
346 |
84 |
46 |
|
2009-10 |
5,560 |
4,095 (26.3) |
|
|
2 |
436 |
1,324 |
1,161 |
747 |
314 |
77 |
34 |
2010-11 |
4,603 |
3,752 (18.5) |
|
|
|
3 |
286 |
1,071 |
1,046 |
788 |
464 |
94 |
2011-12 |
2,120 |
1,916 (9.6) |
|
|
|
|
57 |
230 |
669 |
554 |
282 |
124 |
2012-13 |
1,963 |
- |
|
|
|
|
|
1 |
384 |
587 |
519 |
472 |
Grand Total # |
|
|
972 |
1,653 |
2,091 |
2,768 |
3,079 |
3,367 |
3,290 |
2,374 |
1,388 |
724 |
Percentage change |
|
|
|
70.1 |
26.5 |
32.4 |
11.2 |
9.4 |
-2.3 |
-27.8 |
* |
|
#:The estimate are ex ante, incorporating only envisaged investment, they are different from those actually realised/utilised.
*: Per cent change for 2013-14 is not worked out as capex from proposals that are likely to be sanctioned in 2013-14 are not available.
@: Figures in bracket are percentage of cancellation of projects proposed. |
3.1.4 New projects had major share in institutional assistance
The purpose-wise pattern of projects revealed that 84.1 per cent of the aggregate investment intentions in 2012-13 were for new projects, which were much higher than 70.6 per cent in the previous year. Another 14.6 per cent was proposed for expansion/modernisation of existing business (Annex 4).
3.2 Project funding through ECBs (including FCCBs) gained importance
In addition to projects to be financed by banks/ FIs, projects of 519 private sector companies were funded through ECBs/FCCBs in 2012-13. These companies mobilised funds amounting to `660 billion to be spent on their projects. The corresponding figure for 2011-12 was `379 billion mobilised by 438 companies (Table 3). Lower overseas rates might have prompted the corporates to take higher recourse to ECBs/FCCBs route in 2012-13.
Table 3: Phasing of Capital Expenditure of Projects Funded Through ECBs/FCCBs* |
Loans contracted in |
No of
Companies |
Total loan
Contracted |
Envisaged drawal schedule of capital expenditure (` billion) |
2005-06 |
2006-07 |
2007-08 |
2008-09 |
2009-10 |
2010-11 |
2011-12 |
2012-13 |
2013-14 |
Beyond
2013-14 |
| |
1 |
2 |
3 |
4 |
5 |
6 |
7 |
8 |
9 |
10 |
11 |
12 |
Upto 2004-05 |
556 |
298 |
47 |
16 |
10 |
|
|
|
|
|
|
|
2005-06 |
365 |
285 |
173 |
93 |
9 |
10 |
2 |
|
|
|
|
|
2006-07 |
480 |
513 |
|
350 |
95 |
44 |
7 |
|
|
|
|
|
2007-08 |
302 |
331 |
|
|
259 |
143 |
9 |
|
|
|
|
|
2008-09 |
272 |
312 |
|
|
|
220 |
121 |
1 |
|
|
|
|
2009-10 |
255 |
324 |
|
|
|
|
148 |
143 |
22 |
2 |
|
|
2010-11 |
302 |
316 |
|
|
|
|
|
174 |
109 |
27 |
5 |
|
2011-12 |
438 |
379 |
|
|
|
|
|
|
252 |
128 |
19 |
1 |
2012-13 |
519 |
660 |
|
|
|
|
|
|
|
378 |
203 |
76 |
Total |
3,489 |
3,418 |
220 |
459 |
373 |
417 |
288 |
318 |
383 |
535 |
227 |
77 |
*: Projects which did not receive assistance from banks/FIs. |
3.3 Contribution of IPOs/FPOs/Right Issues in project finance remained low
During 2012-13, 26 non-government companies raised `12 billion through public/rights issues to fund their capital projects. Out of these 26 companies, 25 companies, which did not approach banks/FIs or contracted ECBs for part financing, raised `11 billion for the purpose of capex as compared with `10 billion raised by 21 companies in 2011-12 (Table 4).
Table 4: Phasing of Capital Expenditure of Projects Funded Through Equity Issues* |
Equity issued during |
No of Companies |
Capex Envisaged |
Implementation Schedule (` billion) |
2007-08 |
2008-09 |
2009-10 |
2010-11 |
2011-12 |
2012-13 |
2013-14 |
Beyond 2013-14 |
| |
1 |
2 |
3 |
4 |
5 |
6 |
7 |
8 |
9 |
10 |
2006-07 |
101 |
151 |
57 |
37 |
2 |
|
|
|
|
|
2007-08 |
57 |
54 |
29 |
14 |
3 |
|
|
|
|
|
2008-09 |
21 |
9 |
2 |
6 |
1 |
|
|
|
|
|
2009-10 |
19 |
17 |
|
1 |
8 |
7 |
1 |
|
|
|
2010-11 |
30 |
21 |
|
|
1 |
12 |
6 |
2 |
|
|
2011-12 |
21 |
10 |
|
|
|
2 |
5 |
3 |
|
|
2012-13 |
25 |
11 |
|
|
|
|
|
5 |
5 |
1 |
Total |
274 |
274 |
88 |
58 |
15 |
21 |
12 |
10 |
5 |
1 |
*: Projects which did not receive assistance from banks/FIs/ECBs/FCCBs. |
4. Envisaged Capital Expenditure during 2012-13
4.1 Envisaged capital expenditure on projects financed by banks/FIs decreased
From the time phasing details, that reflect the investment likely to be made over the implementation period of the projects, the total envisaged capital expenditure in a year is estimated. In other words, the likely investment of private corporate sector in a given year may be broadly gauged by suitably aggregating envisaged capital expenditure intended by companies on projects that were sanctioned assistance in various years up to that year.
To the extent possible, information on revisions/ cancellations of the projects sanctioned in earlier period was incorporated to update the database. In case, where a company approached more than one institution for project funding, care was taken to include it only once. The data consolidated on these lines, are presented in Table 2. When horizontally read, it shows the capital expenditure that was expected to take place in various years on the projects sanctioned in a particular year. Vertically read, it gives the capital expenditure that would be incurred in a year on projects, for which institutional assistance was sanctioned either in that year or in the previous years.
It is observed from Table 2 that capital expenditure of `1,787 billion would have been made during 2012-13 on the projects for which institutional assistance was sanctioned prior to 2012-13. The fresh projects sanctioned during 2012-13 envisaged capital expenditure of `587 billion in 2012-13. Thus, the total capital expenditure that would have been incurred during 2012-13 on projects which were financed by banks/ FIs amounted to `2,374 billion (grand total under column 10) reflecting a decline of 27.8 per cent as compared with the last year.
4.2 Envisaged capital expenditure on projects funded through ECBs (including FCCBs) increased
Based on available information from drawal schedules of ECBs, it is estimated that during 2012-13 companies would have incurred capital expenditure of `535 billion (total under column 10 in Table 3), Compared to 2011-12, a growth of 39.7 per cent has been observed in 2012-13.
4.3 Envisaged capital expenditure on projects funded through IPOs/FPOs/Right Issues remained flat
Based on data of companies that raised funds through IPOs/FPOs/Right Issues to part finance their capital projects, it is estimated that a further amount of `10 billion would have been spent on capital expenditure in 2012-13 (total under column 8 of Table 4). Capex through this route is not receiving favour in recent years.
4.4. Envisaged capital expenditure in aggregate declined
Aggregating the figures in para 4.1 to 4.3 above, it is estimated that during 2012-13 capital expenditure of `2,919 billion would have been incurred by the companies covered in this study. Of this, `970 billion was envisaged by 969 new projects added in the database in 2012-13 itself. Compared with 2011-12, this showed a decline of 20.8 per cent. It was the second consecutive year when envisaged capital expenditure declined.
5. Outlook on Investment for 2013-14 remains subdued
GDP growth at constant prices at 5.0 per cent in 2012-13 moderated from 6.2 per cent in 2011-12. Further, the growth rates progressively declined over the four quarters of the year. Index of Industrial production also showed decelerated growth in 2012- 13. It was prominent for manufacturing, particularly the capital goods sector. As regards the financial performance of the non-financial private corporate sector, the sales growth decelerated for six successive quarters and reached the lowest since Q2:2009-10. The continued moderation in corporate investment intentions in 2012-13 may be attributed to the above developments.
Demand conditions continue to be a major factor driving investment intentions. The Reserve Bank of India, in its First Quarter Review of 2013-14 of Monetary Policy Statement placed the baseline projection of real GDP growth at 5.5 per cent in 2013-14, which does not indicate much improvement in the demand conditions. Performance of the capital goods sector, which acts as a barometer for investment climate, has also remained poor. WPI inflation for 2013-14 is also expected to be range bound around 5.0 per cent and this may inhibit significant reduction in interest costs faced by the corporates. While the Government has initiated some steps in the recent past to improve investment climate, results are yet to be visible. Thus, the investment outlook for 2013-14 remains subdued.
According to CMIE, investment proposals to create new capacities, which declined sharply in 2012-13, have further tapered off in the first quarter of 2013-14. Additionally, projects involving large amounts are getting stalled due to policy bottlenecks.
However, in a CEOs’ Survey conducted by the Confederation of Indian Industry (CII) amongst 75 National Council members, 44 per cent of the respondents envisaged an increase in their domestic investment during the current fiscal and another 37 per cent of the respondents did not see a decline in their investment level in the current year.
As per the methodology indicated in this article, envisaged capital expenditure in 2013-14 would be the summation of pipeline investment intentions of the projects, which were taken up prior to 2013-14 and the new capital spending proposals expected to come up in the year 2013-14. The capital expenditure already planned to be spent in 2013-14 aggregated to `1,620 billion (financed by banks/FIs: `1,388 billion, ECBs/ FCCBs: `227 billion and domestic equity issuance: `5 billion) (Tables 2, 3 & 4). Even if companies adhere to their investment plan, to match the capex envisaged in 2012-13 (i.e., `2,919 billion), the minimum capital expenditure of around `1,299 billion needs to come from the new investment intentions by the private corporate sector in 2013-14. Going by the assessment on date, capital expenditure of the above order does not appear to be feasible. Thus, the envisaged investment by the private corporate sector in 2013-14 is expected to be lower than that in the previous year. The problem has been compounded by large projects in sectors like power and telecom getting stalled over last few years, which may lower the capital expenditure in pipeline. Removing the policy bottlenecks may re-ignite the investment scenario.
Annex 1: Industry-wise Distribution of Institutionally Assisted Projects: 2003-04 to 2012-13 |
Industry |
2003-04 |
2004-05 |
2005-06 |
2006-07 |
2007-08 |
2008-09 |
2009-10 |
2010-11 |
2011-12 |
2012-13 |
Num-ber of
Pro-jects |
Per cent
Share |
Num-ber of
Pro-jects |
Per cent
Share |
Num-ber of
Pro-jects |
Per cent
Share |
Num-ber of
Pro-jects |
Per cent
Share |
Num-ber of
Pro-jects |
Per cent
Share |
Num-ber of
Pro-jects |
Per cent
Share |
Num-ber of
Pro-jects |
Per cent
Share |
Num-ber of
Pro-jects |
Per cent
Share |
Num-ber of
Pro-jects |
Per cent
Share |
Num-ber of
Pro-jects |
Per cent
Share |
Infrastructure |
53 |
53.6 |
76 |
33.3 |
109 |
33.9 |
123 |
36.5 |
124 |
39.4 |
97 |
45.1 |
100 |
48.9 |
120 |
53.7 |
107 |
47.4 |
88 |
49.2 |
i) Power |
31 |
7.5 |
60 |
13.2 |
66 |
26.9 |
62 |
18.3 |
60 |
29.4 |
54 |
27.9 |
75 |
30.7 |
104 |
46.2 |
82 |
42.4 |
75 |
40.3 |
ii) Telecom |
4 |
41.9 |
4 |
16.9 |
5 |
2.0 |
9 |
6.5 |
7 |
1.6 |
6 |
10.9 |
6 |
16.4 |
2 |
5.7 |
1 |
- |
2 |
5.5 |
iii) Ports & Airports |
3 |
2.0 |
4 |
1.7 |
3 |
1.8 |
7 |
3.9 |
6 |
0.9 |
4 |
2.8 |
2 |
0.3 |
1 |
0.7 |
1 |
1.3 |
2 |
2.5 |
iv) Storage& Water Management |
11 |
2.1 |
8 |
1.6 |
13 |
1.0 |
5 |
4.6 |
4 |
2.1 |
2 |
- |
2 |
0.9 |
1 |
- |
12 |
0.5 |
- |
- |
v) SEZ, Industrial, Biotech and IT Park |
- |
- |
- |
- |
13 |
1.4 |
37 |
3.1 |
47 |
5.4 |
28 |
3.2 |
15 |
0.6 |
12 |
1.1 |
11 |
3.2 |
9 |
1.0 |
vi) Roads & Bridges |
4 |
0.2 |
- |
- |
9 |
0.8 |
3 |
0.1 |
- |
- |
3 |
0.1 |
- |
- |
- |
- |
- |
- |
- |
- |
Food Products |
32 |
0.8 |
47 |
1.9 |
31 |
0.9 |
38 |
0.9 |
41 |
0.7 |
50 |
1.0 |
41 |
0.5 |
39 |
0.7 |
41 |
1.5 |
37 |
1.0 |
Sugar |
8 |
0.6 |
14 |
0.8 |
20 |
2.2 |
33 |
3.2 |
16 |
1.3 |
21 |
1.2 |
21 |
0.8 |
21 |
0.8 |
12 |
1.1 |
5 |
0.4 |
Textiles |
103 |
5.4 |
126 |
7.9 |
158 |
10.8 |
255 |
9.2 |
116 |
4.5 |
45 |
1.2 |
77 |
2.2 |
77 |
2.9 |
94 |
7.0 |
32 |
2.0 |
Petroleum Products |
- |
- |
- |
- |
2 |
0.8 |
10 |
14.3 |
5 |
7.5 |
4 |
0.1 |
2 |
1.3 |
3 |
2.6 |
3 |
1.2 |
- |
- |
Chemicals& Pesticides |
23 |
1.6 |
16 |
1.9 |
26 |
2.3 |
35 |
1.5 |
25 |
1.0 |
27 |
1.7 |
28 |
0.8 |
27 |
1.3 |
17 |
3.5 |
19 |
1.1 |
Glass & Pottery |
14 |
0.5 |
10 |
1.2 |
10 |
0.8 |
9 |
0.3 |
9 |
0.4 |
6 |
0.3 |
9 |
0.2 |
6 |
0.4 |
10 |
1.3 |
3 |
- |
Cement |
10 |
2.4 |
14 |
3.9 |
13 |
1.5 |
26 |
3.7 |
24 |
5.9 |
28 |
6.0 |
29 |
2.8 |
14 |
2.4 |
9 |
2.0 |
11 |
3.8 |
Metal & Metal Products |
104 |
18.2 |
141 |
29.1 |
126 |
16.6 |
130 |
14.5 |
122 |
15.6 |
97 |
17.7 |
134 |
18.1 |
113 |
21.1 |
73 |
16.3 |
51 |
27.9 |
Electrical Equipment |
12 |
1.3 |
12 |
1.1 |
17 |
0.6 |
22 |
0.4 |
26 |
0.9 |
17 |
1.3 |
16 |
0.2 |
24 |
2.0 |
12 |
0.3 |
10 |
1.8 |
Transport Equipment & Parts |
15 |
1.4 |
25 |
1.4 |
13 |
0.8 |
29 |
1.9 |
38 |
3.5 |
30 |
3.0 |
25 |
1.3 |
28 |
0.8 |
26 |
2.6 |
17 |
0.9 |
Construction |
8 |
0.6 |
8 |
0.3 |
33 |
3.6 |
33 |
3.2 |
38 |
3.9 |
30 |
10.8 |
20 |
11.5 |
18 |
3.3 |
22 |
1.7 |
20 |
2.7 |
Hotel & Restaurants |
21 |
2.1 |
20 |
2.4 |
37 |
3.4 |
74 |
4.0 |
51 |
3.9 |
57 |
2.8 |
56 |
2.6 |
63 |
3.5 |
51 |
4.6 |
32 |
3.1 |
Transport Services |
13 |
1.0 |
22 |
2.7 |
21 |
12.9 |
17 |
0.6 |
17 |
1.4 |
14 |
1.0 |
22 |
1.4 |
14 |
0.6 |
19 |
2.7 |
17 |
1.7 |
Hospitals |
11 |
1.0 |
13 |
0.9 |
14 |
0.8 |
21 |
0.5 |
27 |
1.3 |
16 |
0.5 |
23 |
0.9 |
22 |
0.6 |
9 |
0.3 |
17 |
1.4 |
Entertainment |
14 |
1.3 |
10 |
0.9 |
9 |
1.4 |
20 |
0.3 |
10 |
0.5 |
19 |
1.2 |
12 |
1.1 |
5 |
0.8 |
9 |
1.3 |
7 |
0.2 |
Others* |
146 |
8.1 |
166 |
10.3 |
173 |
6.7 |
170 |
5.1 |
179 |
8.3 |
150 |
5.3 |
114 |
5.5 |
103 |
2.5 |
122 |
5.0 |
59 |
2.7 |
Total |
587 |
100.0 |
720 |
100.0 |
812 |
100.0 |
1045 |
100.0 |
868 |
100.0 |
708 |
100.0 |
729 |
100.0 |
697 |
100.0 |
636 |
100.0 |
425 |
100.0 |
Total Cost of Projects (` in Billion) |
685 |
939 |
1,313 |
2,754 |
2,297 |
3,111 |
4,095 |
3,752 |
1,916 |
1,963 |
*: Comprise industries each with a share of less than 1 per cent in total cost of projects. - : Nil/Negligible. |
Annex 2: Size-wise Distribution of Projects and their Envisaged Cost during 2003-04 to 2012-13 |
Period |
Less than `1 billion |
`1 billion to `5 billion |
`5 billion to `10 billion |
`10 billion to `50 billion |
`50 billion & above |
TOTAL |
2003-04 |
No of Projects |
516 |
55 |
7 |
6 |
3 |
587 |
| |
Per cent Share |
18.2 |
16.9 |
6.5 |
13.5 |
44.8 |
100.0 (685)* |
2004-05 |
No of Projects |
573 |
113 |
17 |
15 |
2 |
720 |
| |
Per cent Share |
18.3 |
23.8 |
11.4 |
33.4 |
13.0 |
100.0 (939) |
2005-06 |
No of Projects |
596 |
167 |
23 |
24 |
2 |
812 |
| |
Per cent Share |
13.0 |
29.9 |
11.7 |
32.2 |
13.2 |
100.0 (1,313) |
2006-07 |
No of Projects |
714 |
245 |
37 |
41 |
8 |
1,045 |
| |
Per cent Share |
9.5 |
19.4 |
9.1 |
31.4 |
30.6 |
100.0 (2,754) |
2007-08 |
No of Projects |
558 |
228 |
35 |
43 |
4 |
868 |
| |
Per cent Share |
9.3 |
22.5 |
10.7 |
38.3 |
19.3 |
100.0 (2,297) |
2008-09 |
No of Projects |
420 |
194 |
35 |
48 |
11 |
708 |
| |
Per cent Share |
5.1 |
14.1 |
7.5 |
29.7 |
43.7 |
100.0 (3,111) |
2009-10 |
No of Projects |
439 |
189 |
40 |
39 |
22 |
729 |
| |
Per cent Share |
3.8 |
11.0 |
6.8 |
20.8 |
57.5 |
100.0 (4,095) |
2010-11 |
No of Projects |
412 |
172 |
42 |
51 |
20 |
697 |
| |
Per cent Share |
4.4 |
10.2 |
8.6 |
29.3 |
47.5 |
100.0 (3,752) |
2011-12 |
No of Projects |
420 |
145 |
36 |
26 |
9 |
636 |
| |
Per cent Share |
8.3 |
17.0 |
13.7 |
27.6 |
33.4 |
100.0 (1,916) |
2012-13 |
No of Projects |
245 |
125 |
22 |
26 |
7 |
425 |
| |
Per cent Share |
4.7 |
14.7 |
8.0 |
27.9 |
44.8 |
100.0 (1,963) |
*: Figures in brackets are total cost of Projects in ` billion. |
Annex 3: State-wise Distribution of Institutionally Assisted Projects: 2003-04 to 2012-13 |
State |
2003-04 |
2004-05 |
2005-06 |
2006-07 |
2007-08 |
2008-09 |
2009-10 |
2010-11 |
2011-12 |
2012-13 |
Num-ber of
Pro-jects |
Per cent
Share |
Num-ber of
Pro-jects |
Per cent
Share |
Num-ber of
Pro-jects |
Per cent
Share |
Num-ber of
Pro-jects |
Per cent
Share |
Num-ber of
Pro-jects |
Per cent
Share |
Num-ber of
Pro-jects |
Per cent
Share |
Num-ber of
Pro-jects |
Per cent
Share |
Num-ber of
Pro-jects |
Per cent
Share |
Num-ber of
Pro-jects |
Per cent
Share |
Num-ber of
Pro-jects |
Per cent
Share |
Odisha |
19 |
2.2 |
30 |
9.9 |
20 |
3.4 |
23 |
5.4 |
21 |
13.1 |
15 |
9.0 |
25 |
13.9 |
25 |
7.4 |
15 |
6.3 |
12 |
27.0 |
Maharashtra |
69 |
9.9 |
102 |
10.4 |
121 |
18.9 |
140 |
8.7 |
141 |
9.7 |
110 |
18.1 |
117 |
10.0 |
71 |
7.4 |
86 |
19.1 |
70 |
10.9 |
Punjab |
30 |
1.4 |
32 |
2.8 |
27 |
1.6 |
48 |
2.1 |
29 |
0.7 |
23 |
0.7 |
23 |
0.4 |
38 |
1.1 |
37 |
1.7 |
12 |
10.5 |
Andhra Pradesh |
53 |
5.3 |
38 |
3.5 |
76 |
8.6 |
103 |
8.7 |
87 |
7.8 |
74 |
7.6 |
73 |
7.1 |
65 |
11.4 |
52 |
5.1 |
36 |
5.6 |
Gujarat |
73 |
9.1 |
81 |
11.7 |
95 |
18.7 |
84 |
26.3 |
95 |
26.4 |
75 |
18.4 |
69 |
3.2 |
65 |
9.6 |
75 |
9.0 |
58 |
5.4 |
Rajasthan |
47 |
3.3 |
26 |
1.7 |
27 |
1.9 |
38 |
3.6 |
22 |
1.2 |
22 |
0.6 |
23 |
2.9 |
28 |
0.8 |
49 |
4.9 |
41 |
5.1 |
Madhya Pradesh |
9 |
2.6 |
19 |
0.8 |
12 |
1.9 |
23 |
1.8 |
18 |
0.6 |
20 |
7.2 |
23 |
4.2 |
21 |
5.2 |
16 |
5.6 |
14 |
4.4 |
Uttar Pradesh |
39 |
3.7 |
23 |
1.4 |
50 |
7.9 |
60 |
3.6 |
41 |
4.2 |
32 |
3.1 |
27 |
0.4 |
32 |
4.6 |
42 |
7.8 |
27 |
4.4 |
Chhattisgarh |
15 |
8.3 |
40 |
9.2 |
19 |
3.9 |
13 |
0.9 |
10 |
4.7 |
16 |
2.3 |
23 |
6.0 |
31 |
12.1 |
11 |
2.4 |
9 |
4.0 |
Arunachal Pradesh |
- |
- |
- |
- |
- |
- |
- |
- |
- |
- |
1 |
0.1 |
3 |
3.3 |
1 |
0.2 |
1 |
0.5 |
2 |
3.9 |
Tamil Nadu |
67 |
4.0 |
110 |
10.6 |
124 |
9.3 |
156 |
6.9 |
94 |
5.1 |
63 |
2.3 |
66 |
5.5 |
93 |
6.1 |
58 |
5.7 |
23 |
1.8 |
Karnataka |
35 |
2.3 |
50 |
7.1 |
51 |
3.5 |
91 |
7.2 |
62 |
4.1 |
44 |
2.4 |
42 |
1.4 |
40 |
7.2 |
39 |
12.0 |
20 |
1.5 |
Haryana |
17 |
0.4 |
21 |
1.5 |
29 |
1.4 |
42 |
1.4 |
28 |
1.2 |
24 |
1.1 |
29 |
2.6 |
35 |
0.8 |
45 |
1.4 |
19 |
1.2 |
Jharkhand |
4 |
0.3 |
9 |
0.3 |
8 |
0.3 |
13 |
2.6 |
15 |
2.9 |
9 |
1.7 |
11 |
2.7 |
9 |
3.5 |
12 |
1.3 |
8 |
1.2 |
West Bengal |
29 |
1.5 |
40 |
2.5 |
27 |
1.9 |
37 |
1.2 |
41 |
2.6 |
43 |
3.0 |
33 |
2.6 |
29 |
3.3 |
19 |
4.9 |
13 |
0.9 |
Uttarakhand |
- |
- |
10 |
0.6 |
24 |
2.3 |
31 |
2.0 |
27 |
0.7 |
19 |
0.8 |
23 |
0.7 |
10 |
0.1 |
7 |
1.4 |
5 |
0.6 |
Delhi |
19 |
4.6 |
12 |
1.6 |
24 |
1.6 |
19 |
2.3 |
19 |
1.4 |
13 |
0.7 |
10 |
1.3 |
9 |
0.7 |
9 |
1.3 |
4 |
0.5 |
Bihar |
1 |
0.1 |
1 |
- |
4 |
- |
2 |
- |
3 |
0.1 |
- |
- |
1 |
- |
3 |
0.1 |
3 |
4.0 |
7 |
0.1 |
Multiple# |
14 |
39.1 |
33 |
20.1 |
29 |
4.4 |
46 |
9.2 |
61 |
10.3 |
55 |
19.0 |
45 |
29.0 |
48 |
16.2 |
34 |
4.5 |
16 |
8.3 |
Others@ |
47 |
1.8 |
43 |
4.2 |
45 |
8.6 |
76 |
6.0 |
54 |
3.2 |
50 |
1.9 |
63 |
2.8 |
44 |
2.2 |
26 |
1.5 |
29 |
2.7 |
Total |
587 |
100.0 |
720 |
100.0 |
812 |
100.0 |
1045 |
100.0 |
868 |
100.0 |
708 |
100.0 |
729 |
100.0 |
697 |
100.0 |
636 |
100.0 |
425 |
100.0 |
Total Cost of Projects (` in Billion) |
685 |
939 |
1,313 |
2,754 |
2,297 |
3,111 |
4,095 |
3,752 |
1,916 |
1,963 |
#: Comprise projects over several States.
@: Comprise States/Union Territories, each with share less than one per cent in aggregate cost of projects. - : Nil/Negligible. |
Annex 4: Purpose-wise Distribution of Institutionally Assisted Projects during 2003-04 to 2012-13 |
Period |
New |
Expansion & Modernisation |
Diversification |
Others |
Total* |
2003-04 |
No of Projects |
318 |
228 |
4 |
37 |
587 |
| |
Per cent Share |
62.7 |
34.5 |
0.1 |
2.6 |
100.0 (685) |
2004-05 |
No of Projects |
343 |
330 |
7 |
40 |
720 |
| |
Per cent Share |
42.1 |
55.3 |
0.7 |
1.9 |
100.0 (939) |
2005-06 |
No of Projects |
393 |
379 |
6 |
34 |
812 |
| |
Per cent Share |
58.4 |
37.7 |
0.5 |
3.4 |
100.0 (1,313) |
2006-07 |
No of Projects |
560 |
413 |
31 |
41 |
1,045 |
| |
Per cent Share |
65.8 |
28.1 |
2.3 |
3.8 |
100.0 (2,754) |
2007-08 |
No of Projects |
478 |
358 |
7 |
25 |
868 |
| |
Per cent Share |
63.7 |
35.2 |
0.3 |
0.8 |
100.0 (2,297) |
2008-09 |
No of Projects |
445 |
240 |
13 |
10 |
708 |
| |
Per cent Share |
68.0 |
31.0 |
1.0 |
- |
100.0 (3,111) |
2009-10 |
No of Projects |
464 |
235 |
11 |
19 |
729 |
| |
Per cent Share |
65.6 |
23.3 |
1.3 |
9.9 |
100.0 (4,095) |
2010-11 |
No of Projects |
454 |
224 |
6 |
13 |
697 |
| |
Per cent Share |
67.0 |
31.0 |
2.0 |
- |
100.0 (3,752) |
2011-12 |
No of Projects |
449 |
172 |
5 |
10 |
636 |
| |
Per cent Share |
70.6 |
23.1 |
0.1 |
6.3 |
100.0 (1,916) |
2012-13 |
No of Projects |
312 |
109 |
- |
4 |
425 |
| |
Per cent Share |
84.1 |
14.6 |
- |
1.3 |
100.0 (1,963) |
*: Figures in brackets are total cost of Projects in ` billion. - : Nil/Negligible. |
|