|
Preliminary data on India’s balance of payments (BoP) for the
second quarter (Q2) of the financial year 2006-07 i.e., July-September
2006, are now available. These preliminary data, combined with the partially
revised data for the first quarter (Q1) i.e., April-June 2006, provide
an assessment of the BoP for the first half of the current financial year i.e.,
April-September 2006. Full details of BoP data are set out in the standard format
of presentation in Statement
1.
July-September 2006
The major items of the BoP for Q2 of 2006-07 are set out in
Table 1 below.
|
Table 1: India's Balance of Payments: July-September 2006
|
|
(US $ million)
|
| |
April-June
|
July-September
|
July-September
|
| |
2006PR
|
2006P
|
2005PR
|
|
1
|
2
|
3
|
4
|
|
Exports
|
29,674
|
30,876
|
25,257
|
|
Imports
|
46,882
|
48,809
|
38,417
|
|
Trade Balance
|
-17,208
|
-17,933
|
-13,160
|
|
Invisibles, net
|
12,453
|
11,005
|
9,582
|
|
Current Account Balance
|
-4,755
|
-6,928
|
-3,578
|
|
Capital Account*
|
11,133
|
9,196
|
8,834
|
|
Change in Reserves# (- Indicates increase)
|
-6,378
|
-2,268
|
-5,256
|
|
*: Including errors and omissions. #: On BoP basis excluding valuation.
|
|
P: Preliminary PR: Partially Revised.
|
Merchandise Trade
- On a BoP basis, India’s Merchandise exports posted a growth of 22.2 per
cent in Q2 of 2006-07 as compared with 33.8 per cent in Q2 of the previous
year.
- Import payments recorded 27.1 per cent growth in Q2 of 2006-07 as against
an increase of 34.5 per cent in Q2 of 2005-06.
- The deceleration in exports growth, according to DGCI&S data, was mainly
due to slowdown in exports of manufactured goods.
- According to the data released by Directorate General of Commercial Intelligence
and Statistics (DGCI&S), while oil imports recorded an increase of 31.0
per cent in Q2 of 2006-07 (56.1 per cent in Q2 of 2005-06), non-oil imports
witnessed a moderate growth of 13.9 per cent (43.1 per cent in Q2 of 2005-06)
mainly due to decline in imports of export related items and gold and silver.
Apart from these, a strong base effect also contributed to such deceleration.
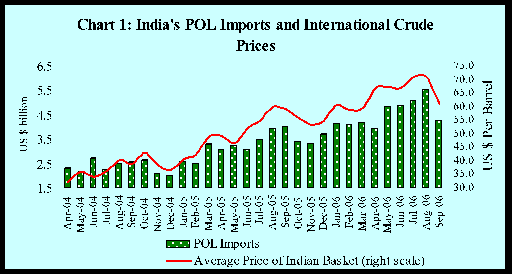
- Oil imports reflected the impact of hardening price of the Indian basket
of international crude (a mix of Dubai and Brent varieties), which rose to
US $ 66.8 per barrel in Q2 of 2006-07 from US $ 49.3 per barrel in the corresponding
quarter of the previous year.
Trade Deficit
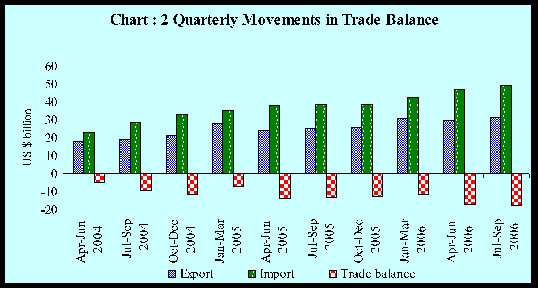
- Strong oil import demand led to a steady expansion in trade deficit, on
BoP basis, to US $ 17.9 billion in Q2 of 2006-07 (US $ 13.2 billion in Q2
of 2005-06).
Invisibles
- Maintaining the pace of growth in business and professional services and
remittances, invisible receipts recorded robust growth (32.8 per cent) in
Q2 of 2006-07.
- Steady expansion in invisible payments reflected continuing pace of outbound
tourist traffic from India, rising payments towards transportation, and strong
domestic demand for business related services and higher investment income
payments.
Current Account Deficit
- Despite support from invisible surplus at US $ 11.0 billion, current account
deficit widened to US $ 6.9 billion in Q2 of 2006-07 (US $ 3.6 billion in
Q2 of 2005-06) due to large trade deficit mainly on account of oil imports.
Capital Account and Reserves
- Under net capital inflows, the major contributors were foreign direct investment,
FIIs, and NRI deposits.
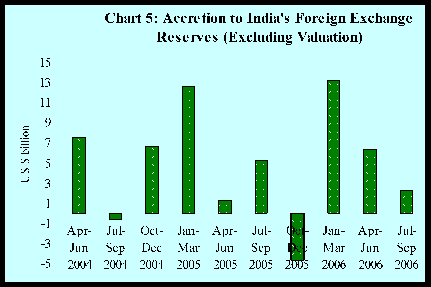
- Accretion to foreign exchange reserves (excluding valuation) at US $ 2.3
billion in Q2 of 2006-07 was lower than US $ 5.3 billion in Q2 of 2005-06.
April-September 2006
Taking into account the partially revised data for Q1 of 2006-07
and the preliminary data for Q2 of 2006-07, the BoP position for the first half
of the financial year 2006-07 has been worked out. While the detailed data are
set out in the table in standard format of presentation, the major items are
set out in Table 2.
|
Table 2: India's Balance of Payments: April-September
2006
|
|
(US $ million)
|
| |
April-September
2006
|
April-September
2005
|
|
1
|
2
|
3
|
|
Exports
|
60,550
|
49,255
|
|
Imports
|
95,691
|
76,364
|
|
Trade Balance
|
-35,141
|
-27,109
|
|
Invisibles, net
|
23,458
|
19,949
|
|
Current Account Balance
|
-11,683
|
-7,160
|
|
Capital Account*
|
20,329
|
13,663
|
|
Change in Reserves# (- Indicates increase)
|
-8,646
|
-6,503
|
|
*: Including errors and omissions. #: On BoP basis excluding valuation.
|
Merchandise Trade
- On a BoP basis, merchandise exports recorded an increase of 22.9 per cent
during April-September 2006 (34.2 per cent in the corresponding period of
the previous year).
- Merchandise import payments showed 25.3 per cent growth in April-September
2006 as compared with 48.2 per cent in the corresponding period of previous
year.
- According to DGCI&S data, deceleration in exports growth occurred on
account of slowdown in exports of manufactured goods viz., chemical and related
products, textile and textile products, leather and manufactures and decline
in handicrafts and gems and jewellery.
- Oil imports, as per DGCI&S data, increased by 36.9 per cent in April-September
2006 (43.7 per cent in April-September 2005), while non-oil imports recorded
a moderate growth of 11.5 per cent (47.9 per cent in April-September 2005).
- The rise in crude oil imports reflected elevated international oil prices
and also the volume growth. While the average crude oil price recorded a year
on year increase of 25 per cent during April-September 2006, volume growth
was 11 per cent.
- The average price of the Indian basket of international crude (a mix of
Dubai and Brent varieties) rose to US $ 67.2 per barrel in April-September
2006 from US $ 53.7 per barrel in the corresponding period of the previous
year (Chart 1).
Trade Deficit
- With the growth in imports outstripping the pace of export growth, merchandise
trade deficit, on a BoP basis, sharply increased to US $ 35.1 billion from
US $ 27.1 billion in April-September 2005 (Chart 2).
Invisibles
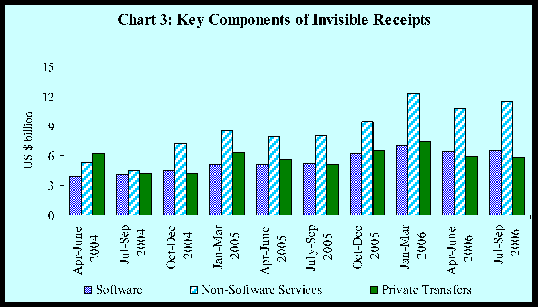
- Invisible receipts rose by 28.6 per cent mainly due to steady growth in transportation,
software exports, other professional and business services and remittances
from overseas Indians (Table 3 and Chart 3).
|
Table 3: Invisible Receipts and Payments
|
|
(US $ million)
|
|
Items
|
Invisible Receipts
|
Invisible Payments
|
| |
April-Sep
2006
|
April-Sep
2005
|
April-Sep
2006
|
April-Sep
2005
|
|
|
1
|
2
|
3
|
4
|
5
|
|
Travel
|
3,487
|
3,029
|
3,247
|
2,757
|
|
Transportation
|
3,744
|
2,897
|
3,689
|
3,579
|
|
Insurance
|
551
|
567
|
278
|
341
|
|
Govt. not included elsewhere
|
124
|
119
|
210
|
208
|
|
Transfers
|
11,883
|
10,899
|
672
|
398
|
|
Income
|
3,757
|
2,302
|
5,808
|
4,580
|
|
Investment Income
|
3,617
|
2,237
|
5,403
|
4,272
|
|
Compensation of Employees
|
140
|
65
|
405
|
308
|
|
Miscellaneous
|
27,389
|
19,791
|
13,573
|
7,792
|
|
Of
Which: Software
|
12,966
|
10,321
|
881
|
479
|
|
Total
|
50,935
|
39,604
|
27,477
|
19,655
|
- Private transfers, comprising primarily remittances from Indians working overseas,
remained steady at US $ 11.2 billion in April-September 2006 as compared with
US $ 10.5 billion in April-September 2005.
- Invisible payments also grew sharply (39.8 per cent) on account of surge in
outbound tourist traffic, business services such as business and management
consultancy, engineering and other technical services and dividend and profit
payouts.
- The miscellaneous receipts, net of software, were recorded at US $ 14.4 billion
in April-September 2006 (US $ 9.5 billion in April-September 2005). The break
up is presented in Table 4.
- Business services receipts and payments both were mainly driven by trade related
services, business and management consultancy services, architectural, engineering
and other technical services, and services relating to maintenance of offices.
These reflect the underlying momentum in trade of professional and technology
related services.
|
Table 4: Break up of Non-Software
Miscellaneous Receipts and Payments
(US $ million)
|
|
|
Receipts
|
Payments
|
|
|
Apr-Sept
2006
|
Apr-Sept
2005
|
Apr-Sept
2006
|
Apr-Sept
2005
|
|
1
|
2
|
3
|
4
|
5
|
|
Communication Services
|
935
|
785
|
291
|
141
|
|
Construction
|
185
|
682
|
463
|
315
|
|
Financial
|
1,158
|
791
|
669
|
592
|
|
News Agency
|
190
|
202
|
80
|
72
|
|
Royalties, Copyrights &
License Fees
|
59
|
58
|
390
|
267
|
|
Business Services
|
10,806
|
4,555
|
8,584
|
3,731
|
|
Personal,Cultural, Recreational
|
92
|
56
|
64
|
55
|
|
Others
|
998
|
2,341
|
2150
|
2,140
|
|
Total
|
14,423
|
9,470
|
12,691
|
7,313
|
Current Account Deficit
- Despite a net invisible surplus of US $23.5
billion, the current account deficit increased to US $ 11.7 billion in April-September
2006 from US $ 7.2 billion in the corresponding period of the previous year
mainly on account of higher oil imports resulting in large trade deficit (Chart
4).
Capital Account
- Under net capital flows, external commercial
borrowings (ECBs), foreign direct investment, and NRI deposits and short-term
trade credit showed robust growth (Table 5).
|
Table 5: Net Capital Flows during April-September 2006
|
|
(US $ million)
|
|
Components
|
April-Sep 2006
|
April-Sep 2005
|
|
1
|
2
|
3
|
|
Foreign Direct Investment
|
4,218
|
2,129
|
|
Portfolio Investment
|
1,614
|
5,413
|
|
External Assistance
|
358
|
409
|
|
External Commercial Borrowings
|
5,093
|
2,925
|
|
NRI Deposits
|
2,029
|
233
|
|
Other Banking Capital
|
1,136
|
2,545
|
|
Short-term Credit
|
1,938
|
972
|
|
Others
|
2,949
|
-1,551
|
|
Total
|
19,335
|
13,075
|
- Net FDI into India accelerated on the strength of sustained domestic activity
and positive investment climate with inflows channeling into manufacturing,
business and computer services. Outward FDI remained on track as reflecting
the appetite of Indian companies for global expansion in terms of markets
and resources.
- Higher recourse to ECBs and short-term credit was enabled by lower spreads
on external borrowings and rising financing requirements for capacity expansion.
- Other capital rose mainly representing leads and lags in exports receipts.
Reserves Accretion
- Net accretion to foreign exchange reserves on a BoP basis (i.e., excluding
valuation) at US $ 8.6 billion was enabled by strong capital inflows, notwithstanding
a sizeable current account deficit (Chart 5). Taking into account the valuation
gain of US $ 5.1 billion, foreign exchange reserves recorded an increase of
US $ 13.7 billion during April-September 2006 as against a modest increase
of US $ 1.5 billion during the corresponding period of the previous year [A
press release on sources of accretion to foreign exchange reserves is released
separately].
- At the end of September 2006, with outstanding foreign exchange reserves
at US $ 165.3 billion, India held the fifth largest stock of reserves among
the emerging markets and sixth largest in the world.
Revisions in BoP Data for 2005-06, and first quarter of 2006-07
According to the Revisions Policy announced on September 30,
2004, the data for 2005-06 and the first quarter of 2006-07 are to be revised.
The BoP data have been accordingly revised based on latest information reported
by various reporting entities. The revised data are presented in the standard
format of presentation in Statement
2.
Alpana Killawala
Chief General Manager
Press Release : 2006-2007/878 |