|
The preliminary data compiled for
the Q4 (i.e., January-March 2006), in conjunction with the partially
revised data for the first three quarters (i.e., April-June, July-September
and October-December 2005) provide an assessment of the BoP for the period April-March
2005-06. Full details of BoP data are set out in the enclosed Statements in
the standard format of presentation.
January-March 2006
The major items of the BoP for
Q4 of 2005-06 are presented in Table 1 below.
|
Table 1: India's Balance
of Payments: January-March 2006
|
|
(US $ million)
|
|
Items
|
April-June
|
July-Sept.
|
Oct.-Dec.
|
Jan.-March
|
Jan.-March
|
|
|
2005PR
|
2005PR
|
2005PR
|
2006 P
|
2005 PR
|
|
1
|
2
|
3
|
4
|
5
|
6
|
|
Exports
|
24,150
|
24,060
|
26,400
|
30,170
|
24,547
|
|
Imports
|
37,754
|
38,692
|
38,237
|
41,651
|
34,676
|
|
Trade Balance
|
-13,604
|
-14,632
|
-11,837
|
-11,481
|
-10,129
|
|
Invisibles, net
|
10,048
|
9,587
|
8,011
|
13,296
|
10,656
|
|
Current Account Balance
|
-3,556
|
-5,045
|
-3,826
|
1,815
|
527
|
|
Capital Account*
|
4,803
|
10,301
|
-846
|
11,406
|
12,102
|
|
Change in Reserves#
(- Indicates increase)
|
-1,247
|
-5,256
|
4,672
|
-13,221
|
-12,629
|
|
*: Including errors and omissions. #: On
BoP basis excluding valuation.
|
|
|
P: Preliminary PR: Partially Revised.
|
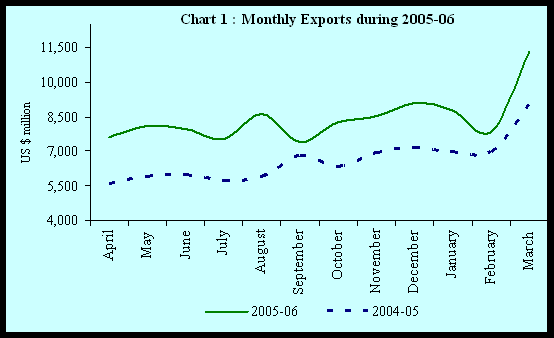
- India’s Merchandise exports, on a BoP basis,
posted a robust growth (22.9 per cent) in Q4, as compared with a year ago
(20.7 per cent) on account of a more broad-based export growth. The month-wise
movement in exports as per Directorate General of Commercial Intelligence
and Statistics (DGCI&S) data is presented in Chart 1.
Import payments showed moderation in Q4 (growth
of 20.1 per cent) representing mainly a strong base effect as imports grew
by 59.1 per cent in the corresponding quarter of 2004-05.
According to the data released by DGCI&S,
while the growth in oil imports accelerated from 43.6 per cent in January-March
2005 to 48.3 per cent in January-March 2006, non-oil imports witnessed a decline
(4.6 per cent) as against an increase of 59.7 per cent over the corresponding
period of the previous year.
Maintaining the pace of growth in travel earnings,
business and professional services, software services and remittances, invisibles
receipt rose by 22.6 per cent.
Invisibles payment grew at 20.6 per cent reflecting
the underlying pace of outbound tourist traffic from India and rising payments
towards transportation and insurance.
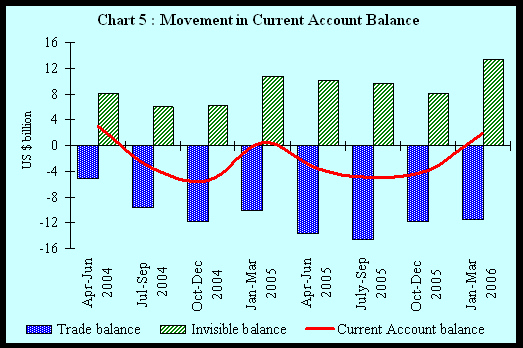
The robust growth in invisibles coupled with
moderation in trade deficit resulted in a surplus of US $ 1.8 billion in Q4
as against US $ 0.5 billion in the corresponding quarter in 2004-05.
To sum up, the surplus in current account during
January-March 2006 was mainly on account of the following.
- Buoyant growth in invisibles receipts led
by software (40.7 per cent) and private transfers (16.9 per cent) in January-March
2006 over the corresponding period of the previous year.
- Growth in imports decelerated from 59.1 per
cent in January-March 2005 to 20.1 per cent in January-March 2006.
- Growth in exports recorded an improvement
from 20.7 per cent in January-March 2005 to 22.9 per cent in January-March
2006.
- In the capital account, net flows under external
commercial borrowings, foreign direct investment, portfolio investment and
NRI deposits showed robust growth.
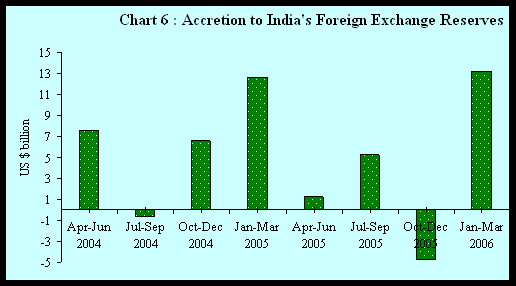
- Accretion to foreign exchange reserves (excluding
valuation) stood at US $ 13.2 billion as compared to US $ 12.6 billion in
the corresponding quarter of the previous year.
2005-06 (April-March)
The BoP position for 2005-06
has been worked out taking into account the partially revised data for the
first three Quarters and the preliminary data for Q4. As mentioned earlier,
the detailed data are set out in Statements 1 and 2. The major items are presented
in Table 2.
|
Table 2 : India's Balance
of Payments: 2005-06 (April-March)
|
|
(US $ million)
|
|
Items
|
2005-06P
|
2004-05PR
|
|
1
|
2
|
3
|
|
Exports
|
104,780
|
82,150
|
|
Imports
|
156,334
|
118,779
|
|
Trade Balance
|
-51,554
|
-36,629
|
|
Invisibles, net
|
40,942
|
31,229
|
|
Current Account Balance
|
-10,612
|
-5,400
|
|
Capital Account*
|
25,664
|
31,559
|
|
Change in Reserves#
|
-15,052
|
-26,159
|
|
(- Indicates increase)
|
|
|
|
*: Including errors and omissions. #:
On BoP basis excluding valuation.
P: Preliminary. PR: Partially Revised.
|
- Maintaining a high export growth trajectory,
merchandise exports, on BoP basis, recorded a growth of 27.5 per cent during
2005-06 (23.9 per cent in 2004-05). The commodity-wise break up, as per DGCI&S
data, revealed that manufacturing exports led the growth momentum, with transport
equipment, machinery and instruments, woolen yarn, fabrics and readymade garments,
basic chemicals and pharmaceuticals and petroleum products emerging as the
key drivers.
- Similarly, merchandise import payments maintained
high growth (31.6 per cent) in 2005-06.
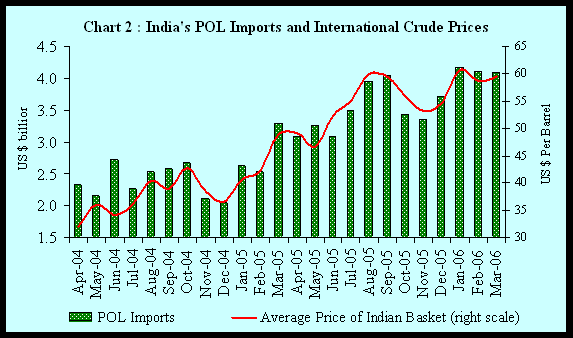
- According to DGCI&S data, the rise in petroleum,
oil and lubricants (POL) imports (47.3 per cent) in 2005-06 showed the impact
of steep rise in international crude oil prices. The average price of the
Indian basket of international crude (a mix of Dubai and Brent varieties)
rose to US $ 55.4 per barrel in 2005-06 from US $ 38.9 per barrel in 2004-05
(Chart 2).
- Non-oil import payments growth at 20.5 per cent
continued to signify underlying momentum, although moderated from a high growth
phase of 2004-05 (41.8 per cent). The key components of non-oil imports were
primarily the export related items and capital goods, signifying the growth
in domestic industrial activity.
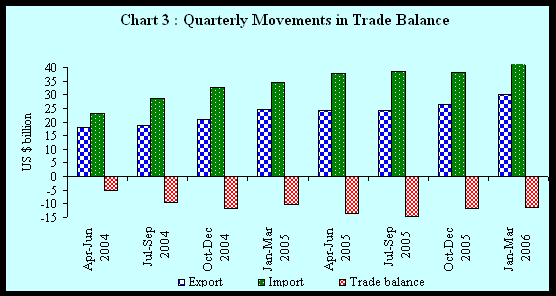
- On BoP basis, the large import payments led
to expansion in trade deficit to US $ 51.6 billion in 2005-06 as compared
with US $ 36.6 billion in 2004-05 (Chart 3).
- While invisibles receipt rose by 27.3 per cent,
invisibles payment posted a growth of 24.4 per cent, resulting in a higher
invisibles surplus of US $ 40.9 billion as compared with US $ 31.2 billion
in 2004-05 (Table 3).
|
Table 3: Invisibles Gross
Receipt and Payment: 2005-06
|
|
|
|
|
(US $ million)
|
|
Items
|
Invisibles Receipt
|
Invisibles Payment
|
|
|
2005-06P
|
2004-05PR
|
2005-06P
|
2004-05PR
|
|
1
|
2
|
3
|
4
|
5
|
|
I. Services
|
60,610
|
46,031
|
38,345
|
31,832
|
|
Travel
|
7,789
|
6,495
|
6,421
|
5,510
|
|
Transportation
|
6,277
|
4,798
|
7,394
|
4,539
|
|
Insurance
|
1,042
|
909
|
985
|
722
|
|
Govt. not included elsewhere
|
305
|
328
|
480
|
261
|
|
Miscellaneous
|
45,197
|
33,501
|
23,065
|
20,800
|
|
Of Which: Software
|
23,600
|
17,200
|
1,338
|
674
|
|
II. Transfers
|
25,220
|
21,276
|
944
|
432
|
|
III. Income (i+ii)
|
5,651
|
4,547
|
11,250
|
8,361
|
|
(i) Investment Income
|
5,477
|
4,431
|
10,504
|
7,100
|
|
(ii) Compensation of
Employees
|
174
|
116
|
746
|
1,261
|
|
Total (I+II+III)
|
91,481
|
71,854
|
50,539
|
40,625
|
|
P: Preliminary. PR: Partially Revised.
|
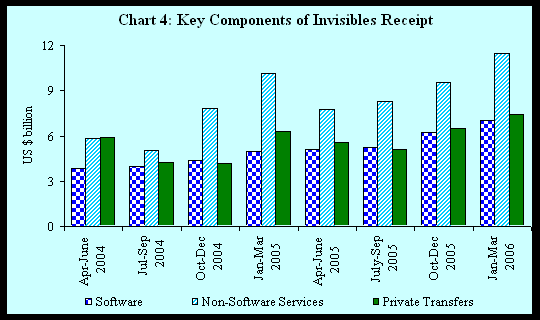
- The major components of invisibles receipt are
the software exports and private transfers, comprising primarily remittances
from Indians working overseas (Chart 4).
- Increase in invisibles payment mainly due to
increase in payments relating to investment income due to one-off effect of
IMD interest payments, transportation services and other business and technology
related services.
- Despite a large trade deficit (US $ 51.6 billion),
a net invisibles surplus of US $40.9 billion helped containing the current
account deficit to US $ 10.6 billion in 2005-06 (Chart 5).
- In the Capital Account, the net flow under foreign
direct investment, portfolio investment and NRI deposits recorded significant
increase in 2005-06 while other capital flows including those of external
assistance and external commercial borrowings showed moderation (Table 4).
|
Table 4: Net Capital Flows
during 2005-06
|
|
(US $ million)
|
|
Items
|
2005-06P
|
2004-05PR
|
|
1
|
2
|
3
|
|
Foreign Direct Investment
|
5,733
|
3,240
|
|
Portfolio Investment
|
12,489
|
8,907
|
|
External Assistance
|
1,438
|
1,923
|
|
External Commercial Borrowings
|
1,591
|
5,040
|
|
NRI Deposits
|
2,789
|
-964
|
|
Other Banking Capital*
|
-1,416
|
4,838
|
|
Short-term Credits
|
1,708
|
3,792
|
|
Others
|
361
|
4,251
|
|
Total
|
24,693
|
31,027
|
|
* Comprises foreign assets
of banks, foreign liabilities of banks (other than NRI deposits) and
movement in balances of foreign central
banks and international institutions maintained with RBI.
P: Preliminary PR: Partially Revised
|
- Net FDI inflows to India picked up on sustained
interest in India as an attractive investment destination due to strong economic
activity and continued strength of the corporate sector with inflows channeling
into manufacturing, business and computer services.
- The FII inflows remained buoyant in 2005-06,
extending the phase of high FII inflows continuing for the past two years.
The strong corporate earnings growth over the past several quarters and expectations
of continuance of high growth phase maintained FII interest in Indian markets.
- ADR/GDR issuances also remained buoyant as booming
stock markets offered corporates the opportunity to issue equities abroad.
- NRI deposits showed a significant turnaround
from net outflows in the previous year.
- Net accretion to foreign exchange reserves (excluding
valuation) stood at US $ 15.1 billion during 2005-06 (US $ 26.2 billion in
2004-05) (Chart 6).
- The outstanding foreign exchange reserves stood
at US $ 151.6 billion at the end of March 2006, placing India as the fifth
largest holder of reserves among the emerging markets and sixth largest in
the world.
Full details of quarterly and annual
data for 2005-06 are set out in the standard format of presentation in the enclosed
Statements 1 and 2.
Partial Revisions in BoP data for
the first three quarters of 2005-06
According to the Revision
Policy announced on September 30, 2004, the data for Q1, Q2 and Q3 of 2005-06
are to be revised. The BoP data have been accordingly revised based on the revised
information reported by various reporting entities. The revised data are presented
in Statements 1 and 2.
Alpana Killawala
Chief General Manager
Press Release : 2005-2006/1708
|