|
VII.1 The Reserve Bank’s debt management strategy during 2007-08 continued to be guided by the twin objectives of minimisation of cost over time and pursuit of maturity profiles consistent with rollover risk. The debt management operations were undertaken in an environment characterised by preemptive monetary tightening measures and upward shifting of yield curve. With buoyant deposit growth during the year, a major source of demand for Government securities emanated from the banking sector for complying with the statutory requirement, followed by the insurance sector.
VII.2 This Chapter reviews the debt management operations of the Reserve Bank during 2007-08. The market borrowing programme of the Central Government, which was larger than that in the previous year, was successfully completed with lower devolvement on primary dealers (PDs). The auctions for dated securities were broadly in accordance with the issuance calendar, barring one unscheduled auction in the first half of the year. The weighted average cost of market borrowings increased during the year, reflecting the hardening of the interest rate structure. The policy of passive consolidation of dated securities and elongation of maturity profile continued during the year. The weighted average maturity increased marginally during the year, reflecting the improvement in the risk profile of outstanding open market debt.
VII.3 The market borrowing programme of the State Governments during 2007-08 was conducted entirely through the auction route. The gross amount raised during 2007-08 was more than twice the amount raised in the previous year as States were sanctioned additional allocations by the Centre to meet the shortfall in National Small Savings Fund (NSSF) collections during 2007-08. The average issuance size of State Government securities, however, continued to remain relatively small. The weighted average yield firmed up during the year and the weighted average spreads of the cut-off yields in the auctions over secondary market yields of comparable Central Government securities were higher than those in the previous year.
VII.4 The combined net issuance of Government securities under the normal market borrowing programme of the Centre and the States at Rs.1,65,728 crore in 2007-08 was higher than Rs.1,25,549 crore in 2006-07. In addition, special securities amounting to Rs.38,050 crore were issued outside the market borrowing programme to various entities in 2007-08 (Rs.40,321 crore in 2006-07). The successful completion of the market borrowing programme reflected the improved market perception of the fiscal parameters, market depth and favourable liquidity conditions that necessitated large additional issuances of government securities under the MSS.
CENTRAL GOVERNMENT
Ways and Means Advances
VII.5 The limits for Ways and Means Advance (WMA) to the Central Government for 2007-08 were fixed at Rs.20,000 crore for the first half of the year (April-September) and Rs.6,000 crore for the second half of the year (October-March), thereby restoring the practice of fixing the limits on a half-yearly basis which existed prior to 2006-07. During 2006-07, WMA limits were fixed on a quarterly basis, mainly to facilitate the transition necessitated by the Fiscal Responsibility and Budget Management (FRBM) Act, 2003 which prohibited the Reserve Bank’s participation in the primary issuances of Government securities with effect from April 1, 2006. The Reserve Bank retained the flexibility to revise the limits in consultation with the Government, taking into consideration the transitional issues and prevailing circumstances. The interest rate on WMA continued to be at the repo rate and that on overdraft, at repo rate plus two percentage points.
VII.6 During 2007-08, the liquidity position of the Central Government remained, in general, comfortable although there were some pressures during the first quarter of the year and in July 2007.
The surplus cash balances of the Centre, which amounted to Rs.50,092 crore at end-March 2007, were drawn down to meet the higher than anticipated spending by the Centre. With a sharp increase in the borrowing requirements resulting from accentuated mismatches between revenue receipts and aggregate expenditure during the first four months of 2007-08, the Central Government took recourse to WMA and overdraft on three occasions, with the peak overdraft at Rs.12,305 crore. A surplus was built up in June 2007 ahead of the Central Government’s acquisition of the Reserve Bank’s stake in State Bank of India (SBI), which was used up by the end of the month to meet this expenditure and the Central Government reverted to WMA. With the transfer of surplus from the Reserve Bank on August 9, 2007, the Central Government went into surplus cash balance mode and remained so thereafter, touching a peak of Rs.1,04,741 crore on March 27, 2008 (Chart VII.1). During 2007-08, the Central Government availed WMA for a total of 91 days as compared with 39 days during 2006-07. The Central Government also resorted to overdraft for 37 days. The surplus balance (inclusive of investment balance of Rs.20,000 crore) was at Rs.76,686 crore as on March 31, 2008.
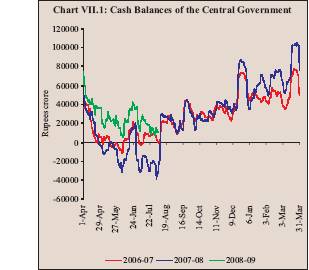
VII.7 The WMA limits for 2008-09 have been fixed at Rs.20,000 crore for the first half of the year (April-September) and Rs.6,000 for the second half of the year (October-March). The applicable interest rate on WMA and overdraft would continue to be linked to the repo rate as hitherto. The Centre began the fiscal year with a large surplus balance of Rs.76,686 crore and continued to be in surplus throughout the first quarter as against a recourse to WMA and OD for 52 days and 10 days, respectively during the corresponding quarter of the previous year. This was despite the larger net market borrowing requirement (GFD) during the quarter and reflected the larger build-up of surplus balances as at end-March 2008 and additional borrowings of Rs.20,000 crore through Treasury Bills. During the second quarter (up to August 14) the Centre took recourse to WMA for three days between August 4, 2008 and August 6, 2008 as compared with 39 days of WMA and 27 days of OD during the corresponding period of the previous year.
Treasury Bills
VII.8 The annual issuance calendar released on March 30, 2007 left the notified amounts of 91-day, 182-day and 364-day Treasury Bills (TBs) under the normal market borrowing programme unchanged at Rs.500 crore (weekly auction), Rs.500 crore (fortnightly auction) and Rs.1,000 crore (fortnightly auction), respectively. The notified amounts of TBs under the normal market borrowing programme were, however, increased on several occasions in June 2007 to, inter alia, finance the temporary cash mismatch that was anticipated to arise on account of transfer of the Reserve Bank’s stake in SBI on June 29, 2007. An additional amount of Rs.32,500 crore outside the issuance calendars (Rs.27,500 crore by way of TBs and Rs.5,000 crore by way of dated securities) was raised in this regard (Table 7.1). The notified amounts of TBs issued under the MSS were varied during the year, keeping in view the prevailing liquidity conditions. The net issuances (excluding MSS) of 91-day, 182-day and 364-day TBs declined as compared with the previous year (Appendix Table 58). The normal market borrowing component of all issues of TBs was fully subscribed by the market.
Table 7.1: Additional Borrowings through Treasury Bills to Finance Transfer of the Reserve Bank’s Stake in SBI
(Rupees crore) |
Date of Issue |
Additional
Issuances* |
1 |
2 |
91-day |
|
June 8, 2007 |
1,500 |
June 13, 2007 |
3,000 |
June 15, 2007 |
3,000 |
June 22, 2007 |
3,000 |
June 27, 2007 |
5,000 |
June 29, 2007 |
3,000 |
Total |
18,500 |
182-day |
|
June 13, 2007 |
2,000 |
June 15, 2007 |
2,000 |
June 29, 2007 |
2,000 |
Total |
6,000 |
364-day |
|
June 8, 2007 |
1,000 |
June 22, 2007 |
2,000 |
Total |
3,000 |
Grand Total |
27,500 |
*: Over and above the notified amount. |
VII.9 Primary market yields of TBs across all maturities hardened during 2007-08 (Table 7.2). Barring the sharp dip in yields on July 18, 2007, and easing of yields in February and March 2008,
Table 7.2: Profile of Treasury Bills |
(At Face Value) |
(Rupees crore) |
Type of
Treasury Bills |
Weighted average
cut-off yield (Per cent) |
Gross amount |
Net amount |
Outstanding Amount |
End-March
2007 |
End-March
2008 |
2006-07 |
2007-08 |
2006-07 |
2007-08 |
2006-07 |
2007-08 |
1 |
2 |
3 |
4 |
5 |
6 |
7 |
8 |
9 |
91-day |
6.80 |
7.09 |
1,31,577 |
2,10,365 |
28,911 |
-5,272 |
45,229 |
39,957 |
|
|
|
(48,222) |
(64,841) |
(14,473) |
(-4,841) |
(14,473) |
(9,632) |
182-day |
6.87 |
7.38 |
36,912 |
46,926 |
7,435 |
-421 |
17,206 |
16,785 |
|
|
|
(16,125) |
(20,605) |
(4,950) |
(-345) |
(7,950) |
(7,605) |
364-day |
7.07 |
7.50 |
53,813 |
57,205 |
8,795 |
3,392 |
53,813 |
57,205 |
|
|
|
(20,440) |
(25,000) |
(4,440) |
(4,560) |
(20,440) |
(25,000) |
Note: Figures in parentheses pertain to issuances under the Market Stabilisation Scheme (MSS). |
reflecting easy liquidity conditions and very low short-term interest rates, the yields during 2007-08 were higher than their respective levels a year ago (Chart VII.2). The firming up of yields reflected higher money market interest rates, removal of the ceiling on absorption through reverse repo and hikes in the cash reserve ratio. International developments, particularly, the cut in the Fed Funds target rate led to a softening of rates in October 2007 and January 2008. A notable feature during 2007-08 was a better management of the usually tight year-end liquidity
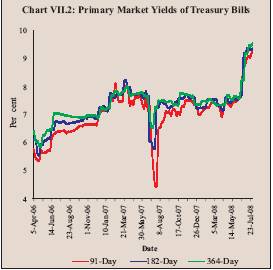
conditions than during 2006-07. Reflecting this, and trends in money market segments, the primary yields as at end-March 2008 for 91-day, 182-day and 364-day TBs were placed at 7.23 per cent, 7.36 per cent and 7.35 per cent, respectively, lower by 75, 84 and 63 basis points, respectively, than those at end-March 2007. The yield spread of 364-day TBs over 91-day TBs varied between 208 basis points (July 18, 2007) and 5 basis points (March 12, 2008) with the higher spread in July 2007 reflecting, inter alia, the ceiling of Rs.3,000 crore on reserve repo auctions under the liquidity adjustment facility (LAF). With the withdrawal of this ceiling on August 6, 2007, the average yield spread for the remaining period of the year was 31 basis points (27 basis points a year ago) (Table 7.3). The average yield spread during 2007-08 was 42 basis points (38 basis points a year ago).
Table 7.3: Treasury Bills - Primary Market |
Month |
Notified
Amount
(Rupees crore) |
Average Implicit
Yield at Minimum
Cut-off Price (Per cent) |
Bid-Cover Ratio* |
91- day |
182- day |
364- day |
91- day |
182- day |
364-
day |
1 |
2 |
3 |
4 |
5 |
6 |
7 |
8 |
2007-08 |
|
|
|
|
|
|
|
April |
15,000 |
7.53 |
7.87 |
7.72 |
2.87 |
3.36 |
3.16 |
May |
18,500 |
7.59 |
7.70 |
7.79 |
2.33 |
2.57 |
2.33 |
June |
35,000 |
7.41 |
7.76 |
6.67 |
3.23 |
4.11 |
3.97 |
July |
12,500 |
5.07 |
5.94 |
6.87 |
4.48 |
2.70 |
4.56 |
August |
20,500 |
6.74 |
7.37 |
7.42 |
2.11 |
1.41 |
2.46 |
September |
25,000 |
7.08 |
7.33 |
7.48 |
2.07 |
2.91 |
2.83 |
October |
28,500 |
7.11 |
7.45 |
7.37 |
2.16 |
1.73 |
3.23 |
November |
22,500 |
7.47 |
7.65 |
7.75 |
1.63 |
1.38 |
1.88 |
December |
7,500 |
7.41 |
7.60 |
7.69 |
4.41 |
4.67 |
3.67 |
January |
19,000 |
7.08 |
7.24 |
7.39 |
2.63 |
1.61 |
4.36 |
February |
15,500 |
7.33 |
7.40 |
7.51 |
2.15 |
2.91 |
2.78 |
March |
5,000 |
7.33 |
7.45 |
7.40 |
3.97 |
4.17 |
3.34 |
2008-09 |
|
|
|
|
|
|
|
April |
22,000 |
7.28 |
7.41 |
7.53 |
1.70 |
1.36 |
2.36 |
May |
21,000 |
7.41 |
7.55 |
7.61 |
2.65 |
2.78 |
3.05 |
June |
11,500 |
8.01 |
8.42 |
7.93 |
2.00 |
2.76 |
2.80 |
July |
16,000 |
9.07 |
9.33 |
9.39 |
2.52 |
2.72 |
3.55 |
* : Ratio of competitive bids received to notified amount |
VII.10 During 2007-08, non-competitive bids aggregating Rs.1,11,551 crore of TBs were received
as compared with Rs.72,514 crore during the previous year, indicating the enduring nature of surplus cash balances of the State Governments. The share of non-competitive bids in gross issuances of auctioned TBs increased to 35 per cent during 2007-08 from 33 per cent during 2006-07, almost entirely due to investments by the State Governments.
VII.11 The calendar for the regular auction of TBs for 2008-09 was announced on March 24, 2008. The notified amounts were kept unchanged at Rs.500 crore each for 91-day and 182-day TBs and Rs.1,000 crore for 364-day TBs. However, the notified amount (excluding MSS) of 91-day TBs was increased by Rs.2,500 crore each on ten occasions and by Rs.1,500 crore on one occasion and that of 182-day TBs was increased by Rs.500 crore each on two occasions during 2008-09 (up to August 14, 2008). Thus, an additional amount of Rs.27,500 crore (Rs.17,500 crore, net) was raised over and above the notified amount in the calendar to finance the expected temporary cash mismatch arising from the expenditure on farmers’ debt waiver scheme.
Dated Securities
VII.12 Net market borrowings through dated securities at Rs.1,10,671 crore during 2007-08, increased by 3.5 per cent over that of Rs.1,06,921 crore during 2006-07. Gross market borrowings through dated securities at Rs.1,56,000 crore during 2007-08, increased by 6.9 per cent over that of Rs.1,46,000 crore during 2006-07 (Table 7.4, Appendix Tables 34 and 59). The total devolvement on PDs was lower at Rs.957 crore during 2007-08 than Rs.5,604 crore during 2006-07.
Table 7.4: Gross and Net Market Borrowings |
of the Central Government |
(Rs. crore) |
Instrument |
2006-07
(Actual) |
2007-08
(BE) |
2007-08
(Actual) |
2008-09
(BE) |
2008-09
(Actual)* |
1 |
2 |
3 |
4 |
5 |
6 |
Total |
1,79,373 |
1,88,828 |
1,88,205 |
1,75,780 |
95,845 |
|
(1,11,275) |
(1,09,579) |
(1,09,504) |
(99,000) |
(57,199) |
of which: |
|
|
|
|
|
(i) Dated |
1,46,000 |
1,55,455 |
1,56,000 |
1,49,780 |
82,000 |
Securities |
(1,06,921) |
(1,09,579) |
(1,10,671)(1,05,205) |
(57,982) |
(ii) 364-day |
33,373 |
33,373 |
32,205 |
26,000 |
13,845 |
Treasury |
Bills (4,354) |
(-) |
(-1,167) |
(-6,205) |
(-783) |
BE: Budget Estimates
*: As on August 14, 2008
Note: Figures in parentheses represent net borrowings. |
VII.13 The Reserve Bank continued with the policy of passive consolidation of dated securities and elongation of maturity profile of securities during 2007-08. Out of 35 dated securities issued during the year, 34 securities were re-issues of existing securities; one new security of 10-year maturity was issued to provide a benchmark in the secondary market (Appendix Table 60). In 2006-07, three securities out of the 33 securities issued during the year were new issuances. Out of 102 outstanding marketable securities (inclusive of MSS) amounting to Rs.13,32,435 crore as on March 31, 2008, 20 securities, each with minimum outstanding amount of Rs.25,000 crore, accounted for as much as 54 per cent of the total outstanding amount (27 per cent as at end-March 2007), indicating the liquidity potential of these securities.
VII.14 The introduction of the Primary Auction Module in the public debt office-negotiated dealing system (PDO-NDS) has increased the efficiency of the auction process. However, the time taken to complete the entire auction process does not compare favourably with the international best practice. In this regard, an internal Working Group (Chairman: H.R.Khan) was constituted to suggest measures to improve the overall efficiency of the auction process (Box VII.1).
Box VII.1
The Working Group on Auction Process of Government of India Securities
With a view to improving the efficiency of the auction process for Government securities and bringing it on par with the international best standards, an Internal Working Group (Chairman:H.R.Khan) was constituted i) to review the extant auction procedure followed; ii) make suggestions to reduce the time taken for completion of the auction process; and iii) improve the overallefficiency. The Working Group reviewed the cross country experiences of auction processes in Government securities and consulted market participants to address the various issues relating to the existing auction procedure. The Group made several important recommendations as detailed below:
(a) The time gap between bid submission and declaration of auction results may be reduced progressively, from the existing 3 hours to 1 ½ hours in the short-term and further to 1 hour in the medium term and to 30 minutes in the long term.
(b) The time for submission of non-competitive bids in auctions of dated securities as well as Treasury Bills, both in electronic and physical form, may be advanced.
(c) Eligible entities and individuals desirous of submitting non-competitive bids may be allowed access through a bank/PD only electronically.
(d) Bank/PD may be allowed to submit a single consolidated bid on behalf of all its constituents, with the responsibility of verifying the genuineness of non- competitive bids vesting with the bank/PD concerned.
(e) Physical bids may be accepted only in exceptional circumstances and competitive bids of non-NDS members may be routed electronically through NDS members.
(f) Direct participation of non-NDS members in auctions of Government securities may be facilitated in the next phase through a secured web-based system linked to the new primary auction module for auctions in Government of India dated securities.
The recommendations of the Working Group are being examined in consultation with the Government of India.
VII.15 The aggregate amount raised through dated securities during the first half of 2007-08 was Rs.97,000 crore, which was Rs.5,000 crore more than the amount indicated in the issuance calendar. The issuance calendar for the second half of the fiscal year, which was for raising Rs.59,000 crore through dated securities, was adhered to. Thus, the actual issuance during 2007-08 aggregated to Rs.1,56,000 crore.
VII.16 The weighted average yield remained high during the first quarter of 2007-08, reflecting the hardening of overall interest rate conditions, but declined thereafter. For the year as a whole, the weighted average yield of dated securities increased for the fourth year in succession during 2007-08 and was placed at 8.12 per cent as compared with 7.89 per cent during 2006-07 and 7.34 per cent in 2005-06 (Chart VII.3). The weighted average coupon
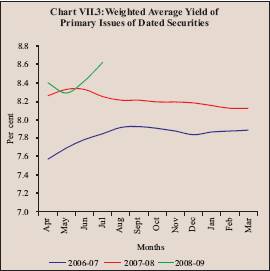
on the outstanding stock of Central Government dated securities, however, continued its downward trend, declining to 8.50 per cent as on March 31, 2008 from 8.55 per cent as at end-March 2007.
VII.17 The weighted average maturity of dated securities issued during the year was higher at 14.90 years than 14.72 years during 2006-07 (Table 7.5). The weighted average maturity of the outstanding stock increased to 10.59 years as on March 31, 2008 from 9.97 years as at end-March 2007 (excluding MSS securities).
Table 7.5: Central Government’s Market Loans- A Profile* |
(Yield in per cent/Maturity in years) |
Year |
Range of YTMs at Primary Issues |
Issues during the year |
Outstanding Stock |
|
under 5 years |
5-10 years |
Over 10 years |
Weighted Average Yield |
Range of Maturities |
Weighted Average Maturity |
Weighted Average Maturity |
Weighted Average Coupon |
1 |
2 |
3 |
4 |
5 |
6 |
7 |
8 |
9 |
1997-98 |
10.85-12.14 |
11.15-13.05 |
- |
12.01 |
3-10 |
6.60 |
6.50 |
.. |
1998-99 |
11.40-11.68 |
11.10-12.25 |
12.25-12.60 |
11.86 |
2-20 |
7.70 |
6.30 |
.. |
1999-00 |
- |
10.73-11.99 |
10.77-12.45 |
11.77 |
5-19 |
12.60 |
7.10 |
.. |
2000-01 |
9.47-10.95 |
9.88-11.69 |
10.47-11.70 |
10.95 |
2-20 |
10.60 |
7.50 |
.. |
2001-02 |
- |
6.98-9.81 |
7.18-11.00 |
9.44 |
5-25 |
14.30 |
8.20 |
10.84 |
2002-03 |
- |
6.65-8.14 |
6.84-8.62 |
7.34 |
7-30 |
13.80 |
8.90 |
10.44 |
2003-04 |
4.69 |
4.62-5.73 |
5.18-6.35 |
5.71 |
4-30 |
14.94 |
9.78 |
9.30 |
2004-05 |
5.90 |
5.53-7.20 |
4.49-8.24 |
6.11 |
5-30 |
14.13 |
9.63 |
8.79 |
2005-06 |
- |
6.70-7.06 |
6.91-7.79 |
7.34 |
5-30 |
16.90 |
9.92 |
8.75 |
2006-07 |
7.69-7.94 |
7.06-8.29 |
7.43-8.75 |
7.89 |
4-30 |
14.72 |
9.97 |
8.55 |
2007-08 |
- |
7.55-8.44 |
7.62-8.64 |
8.12 |
6-29 |
14.90 |
10.59 |
8.50 |
*: Excludes issuances under MSS; YTM: Yield to Maturity; .. :Not Available; - : No Issues |
VII.18 During 2007-08, the spread between the primary cut-off yields in the auctions of dated securities and the prevailing secondary market yields of dated securities of similar maturity ranged between (-) 48 and 8 basis points. However, of the 35 auctions of dated securities, the spread in 28 auctions ranged between (-) 5 and 5 basis points, reflecting efficient price discovery in the primary auctions (Table 7.6).
Table 7.6: Primary Cut-Off Yield and |
Prevailing Secondary Market Yield |
(Amount in Rupees crore/Yield in per cent) |
|
Residual
Maturity |
Gross
amount
raised |
Cut-off yield |
Prevailing
Secondary
market Yield |
Spread
(Basis Points)
(4)-(5) |
Bid- Cover
Ratio |
Date of Auction |
|
|
|
|
|
|
1 |
2 |
3 |
4 |
5 |
6 |
7 |
April 12, 2007 |
8.39 |
6,000 |
8.16 |
8.16 |
0.00 |
1.88 |
April 12, 2007 |
29.15 |
4,000 |
8.58 |
8.56 |
0.02 |
2.66 |
April 27, 2007 |
9.71 |
6,000 |
8.16 |
8.11 |
0.05 |
2.15 |
May 11, 2007 |
9.92 |
6,000 |
8.31 |
8.28 |
0.03 |
1.58 |
May 11, 2007 |
29.06 |
4,000 |
8.64 |
8.58 |
0.06 |
2.51 |
May 25, 2007 |
8.26 |
5,000 |
8.24 |
8.16 |
0.08 |
3.57 |
May 25, 2007 |
14.96 |
3,000 |
8.41 |
8.37 |
0.04 |
2.85 |
June 5, 2007 |
9.86 |
6,000 |
8.18 |
8.15 |
0.03 |
2.50 |
June 5, 2007 |
29.00 |
3,000 |
8.52 |
8.48 |
0.04 |
2.42 |
June 12, 2007 |
9.84 |
5,000 |
8.44 |
8.38 |
0.06 |
3.30 |
June 15, 2007 |
9.83 |
6,000 |
8.35 |
8.29 |
0.06 |
4.76 |
July 6, 2007 |
10.00 |
6,000 |
7.99 |
7.96 |
0.03 |
3.01 |
July 6, 2007 |
28.91 |
4,000 |
8.45 |
8.39 |
0.06 |
2.07 |
July 20, 2007 |
6.11 |
6,000 |
7.59 |
7.54 |
0.05 |
2.33 |
July 20, 2007 |
25.10 |
3,000 |
8.34 |
8.33 |
0.01 |
3.76 |
August 3, 2007 |
9.93 |
6,000 |
7.93 |
7.88 |
0.05 |
3.32 |
August 3, 2007 |
25.06 |
4,000 |
8.45 |
8.93 |
-0.48 |
2.45 |
August 24, 2007 |
6.02 |
5,000 |
7.87 |
7.86 |
0.01 |
2.90 |
August 24, 2007 |
9.89 |
2,000 |
7.91 |
7.91 |
0.00 |
2.93 |
September 7, 2007 |
14.43 |
4,000 |
8.16 |
8.16 |
0.00 |
3.84 |
September 7, 2007 |
28.74 |
3,000 |
8.41 |
8.36 |
0.05 |
2.89 |
October 12, 2007 |
9.73 |
6,000 |
7.91 |
7.89 |
0.02 |
2.74 |
October 12, 2007 |
24.87 |
4,000 |
8.45 |
8.43 |
0.02 |
2.56 |
October 26, 2007 |
5.84 |
4,000 |
7.74 |
7.73 |
0.01 |
2.94 |
October 26, 2007 |
14.54 |
4,000 |
8.13 |
8.12 |
0.01 |
3.59 |
November 8, 2007 |
14.26 |
5,000 |
8.26 |
8.19 |
0.07 |
1.81 |
November 8, 2007 |
28.57 |
3,000 |
8.39 |
8.38 |
0.01 |
3.10 |
November 23, 2007 |
9.62 |
3,000 |
7.90 |
7.89 |
0.01 |
2.23 |
November 23, 2007 |
14.47 |
4,000 |
8.20 |
8.18 |
0.02 |
3.35 |
December 14, 2007 |
9.56 |
5,000 |
7.92 |
7.90 |
0.02 |
2.12 |
December 14, 2007 |
28.47 |
2,000 |
8.26 |
8.25 |
0.01 |
3.69 |
January 11, 2008 |
9.49 |
6,000 |
7.55 |
7.57 |
-0.02 |
2.33 |
January 11, 2008 |
28.40 |
4,000 |
7.89 |
7.87 |
0.02 |
3.73 |
February 8, 2008 |
28.32 |
4,000 |
7.77 |
7.76 |
0.01 |
2.91 |
February 8, 2008 |
14.01 |
5,000 |
7.62 |
7.61 |
0.01 |
2.77 |
VII.19 The share of securities with residual maturity of over 10 years issued during 2007-08 declined to 43 per cent of the total issuances as compared with 46 per cent during 2006-07. There was no issue of dated securities with tenors up to 5 years during 2007-08. The share of outstanding stock under 5 years declined to 20 per cent during 2007-08 from 26 per cent during the previous year while that of the outstanding stock with over 10 years residual maturity increased to 36 per cent from 33 per cent during 2006-07 (Table 7.7).
Table 7.7: Maturity Profile of Central |
Government Dated Securities* |
(per cent) |
Year |
Issued
during the year |
Outstanding
Stock |
Under 5 Years |
5-10 Years |
Over 10 Years |
Under 5 Years |
5-10 Years |
Over 10 Years |
1 |
2 |
3 |
4 |
5 |
6 |
7 |
1997-98 |
18 |
82 |
0 |
41 |
41 |
18 |
1998-99 |
18 |
68 |
14 |
41 |
42 |
16 |
1999-00 |
0 |
35 |
65 |
37 |
39 |
24 |
2000-01 |
6 |
41 |
53 |
27 |
47 |
26 |
2001-02 |
2 |
24 |
74 |
31 |
36 |
33 |
2002-03 |
0 |
36 |
64 |
26 |
35 |
39 |
2003-04 |
5 |
15 |
80 |
24 |
32 |
44 |
2004-05 |
11 |
11 |
78 |
27 |
30 |
43 |
2005-06 |
0 |
26 |
74 |
26 |
31 |
43 |
2006-07 |
7 |
47 |
46 |
26 |
41 |
33 |
2007-08 |
0 |
57 |
43 |
20 |
44 |
36 |
*: Excluding issues under MSS. |
VII.20 Annual repayment obligation based on the repayment schedule of outstanding market loans of the Central Government as on March 31, 2008 indicates bunching of repayments in nominal terms between 2011-12 and 2017-18, with the repayments crossing Rs.1,00,000 crore in 2016-17 and 2017-18 (Table 7.8). However, relative to projected GDP, the repayment obligations would be more evenly paced out.
Table 7.8: Repayment Schedule of the |
Centre’s Outstanding Market Loans* |
(As on March 31, 2008) |
(Rupees crore) |
Year |
Amount |
1 |
2 |
2008-2009 |
44,028 # |
2009-2010 |
52,589 |
2010-2011 |
66,586 |
2011-2012 |
73,581 |
2012-2013 |
74,621 |
2013-2014 |
80,009 |
2014-2015 |
69,018 |
2015-2016 |
76,244 |
2016-2017 |
1,14,130 |
2017-2018 |
1,20,774 |
2018-2019 |
42,478 |
2019-2020 |
28,000 |
2020-2021 |
11,000 |
2021-2022 |
55,846 |
2022-2023 |
57,465 |
2023-2024 |
21,000 |
2025-2026 |
16,688 |
2026-2027 |
19,389 |
2027-2028 |
17,680 |
2028-2029 |
11,000 |
2031-2032 |
2,687 |
2032-2033 |
35,957 |
2034-2035 |
29,350 |
2035-2036 |
29,000 |
2036-2037 |
55,000 |
Total |
12,04,118 # |
* : Excluding issuances under MSS.
# : Excludes Rs. 547 crore pertaining to a security with call
and put option. |
VII.21 The share of high cost debt declined further during 2007-08 as compared with the previous year. The share of the outstanding stock with the coupon of 9 per cent and above declined to 30.4 per cent as on March 31, 2008 from 36.7 per cent as on March 31, 2007. However, reflecting the hardening of interest rates, the share of outstanding stock of debt contracted at interest rates of 7.00-8.99 per cent was about 52 per cent during 2007-08 (39.5 per cent a year ago) (Table 7.9).
Table 7.9: Interest Rate Profile of the Outstanding |
Stock of Central Government Securities* |
Interest Rate(Per cent) |
Outstanding Amount(Rupees crore) |
Share in Total(Per cent) |
End-March2007 |
End-March2008 |
End-March2007 |
End-March2008 |
1 |
2 |
3 |
4 |
5 |
4.00-4.99 |
11,000 |
4,500 |
1.0 |
0.4 |
5.00-5.99 |
82,818 |
74,818 |
7.6 |
6.2 |
6.00-6.99 |
1,63,949 |
1,29,444 |
15.1 |
10.8 |
7.00-7.99 |
3,20,540 |
4,46,540 |
29.6 |
37.1 |
8.00-8.99 |
1,07,681 |
1,81,782 |
9.9 |
15.1 |
9.00-9.99 |
71,424 |
70,751 |
6.6 |
5.8 |
10.00-10.99 |
1,01,382 |
93,067 |
9.4 |
7.7 |
11.00-11.99 |
1,18,668 |
1,10,556 |
10.9 |
9.2 |
12.00-12.99 |
93,184 |
92,660 |
8.6 |
7.7 |
13.00-14.00 |
12,700 |
0 |
1.2 |
0.0 |
Total |
10,83,346 |
12,04,118# |
100 |
100 |
*: Excluding issuances under the MSS.
#: Excludes Rs. 547 crore pertaining to a security with call and
put option.
Conversion of Recapitalisation Bonds/Special
securities issued to Nationalised Banks |
VII.22 The Union Budget 2006-07 had announced the unwinding of the entire outstanding amount of recapitalisation bonds/special securities issued to nationalised banks, amounting to Rs.20,809 crore, through conversion into tradable, SLR eligible, Central Government dated securities. While one tranche of conversion was effected during 2006-07 for Rs.8,708 crore, the remaining amount was converted in two tranches of Rs.6,831 crore and Rs.5,270 crore, respectively, during 2007-08. In each of these tranches, three new securities of 15, 20 and 25 years’ maturity were issued with SLR status in lieu of the erstwhile recapitalisation bonds.
Special Securities issued by Central Government during 2007-08
VII.23 With a view to compensating oil marketing companies (OMCs) for estimated under-recoveries on account of sale of petroleum products and settlement of contingent liabilities during 2007-08, the Central Government issued two special securities to OMCs - for Rs.11,257 crore on January 18, 2008 and for Rs.9,297 crore on March 28, 2008 -aggregating to Rs.20,554 crore.
VII.24 Two special securities were issued to fertiliser companies as compensation towards fertiliser subsidy during the financial year 2007-08.The first tranche of special securities with a 16-year maturity was issued to 22 fertiliser companies for Rs.3,890 crore on December 7, 2007. The second tranche of special securities with 18-year maturity was issued to 23 fertiliser companies for Rs.3,610 crore on February 18, 2008. Thus, the total issuances of special securities to fertiliser companies during 2007-08 aggregated Rs.7,500 crore.
VII.25 The Central Government also issued special securities with 16-year maturity for Rs.9,996 crore to SBI on March 27, 2008, as subscription towards SBI’s rights issue of equity shares. Thus, the special securities issued to various entities aggregated to Rs.38,050 crore in 2007-08 as compared with Rs.40,321 crore in 2006-07.
Market Borrowings during 2008-09
VII.26 The market borrowings (including dated securities and 364-day TBs) of the Central Government for 2008-09 are budgeted lower at Rs.1,75,780 crore (net Rs.99,000 crore) than the actual amount raised in 2007-08. On March 24, 2008, the issuance calendar for dated securities for the first half of 2008-09 (April-September) was released in consultation with the Central Government. Accordingly, an amount of Rs.96,000 crore is scheduled to be raised as compared with Rs.97,000 crore raised during the corresponding period of the previous year. The monthly amount to be raised varies from Rs.8,000 crore (September 2008) to Rs.20,000 (April and May 2008) (Table 7.10). While 36 per cent of the securities to be raised during the first half of 2008-09 would be of tenor between 10-14 years, 32 per cent of the securities would be of the tenor 20 years and above.
Table 7.10: Indicative Calendar and Actual Borrowings of the Central Government - 2008-09 |
(Amount in Rupees crore/Maturity in years/Yield in Percent) |
Sr.
No. |
Borrowings as per Auction Calendar |
Actual Borrowings |
Period of auction |
Amount |
Residual Maturity |
Date of Auction |
Amount |
Residual Maturity |
Yield |
1 |
2 |
3 |
4 |
5 |
6 |
7 |
8 |
1. |
April 4 - 11, 2008 |
6,000 |
5-9 year |
April 11, 2008 |
6,000 |
7.38 |
8.14 |
|
|
4,000 |
20- year and above |
|
4,000 |
24.37 |
8.67 |
2. |
April 18 - 25, 2008 |
6,000 |
10-14 year |
April 21, 2008 |
6,000 |
10.00 |
8.24 |
|
|
4,000 |
20- year and above |
|
4,000 |
28.13 |
8.77 |
3. |
May 2-9, 2008 |
6,000 |
5-9 year |
May 9, 2008 |
6,000 |
7.92 |
7.96 |
|
|
4,000 |
20-year and above |
|
4,000 |
24.29 |
8.35 |
4. |
May 16-23, 2008 |
6,000 |
10-14 year |
May 23, 2008 |
6,000 |
9.91 |
8.07 |
|
|
4,000 |
20-year and above |
|
4,000 |
23.72 |
8.52 |
5. |
May 30- June 6, 2008 |
6,000 |
10-14 year |
June 6, 2008 |
6,000 |
9.87 |
8.26 |
|
|
4,000 |
20 year and above |
|
4,000 |
24.22 |
8.72 |
6. |
June 13 - 20, 2008 |
6,000 |
15-19 year security |
June 20, 2008 |
6,000 |
18.64 |
9.25 |
7. |
July 4-11, 2008 |
6,000 |
10-14 year |
July 4, 2008 |
6,000 |
9.79 |
9.13 |
|
|
4,000 |
20 year and above |
|
4,000 |
23.61 |
10.03 |
8. |
July 18-25, 2008 |
6,000 |
15-19 year |
July 24, 2008 |
6,000 |
9.74 |
9.08 |
9. |
August 1-8, 2008 |
6,000 |
10-14 year |
August 8, 2008 |
6,000 |
9.70 |
9.14 |
|
|
4,000 |
20 year and above |
|
4,000 |
24.06 |
9.88 |
10. |
August 14-22 , 2008 |
6,000 |
15-19 year |
|
|
|
|
11. |
September 5-12, 2008 |
5,000 |
10-14 year |
|
|
|
|
|
|
3,000 |
20-year and above |
|
|
|
|
|
Total |
96,000 |
|
|
82,000 |
|
|
VII.27 During 2008-09 so far (up to August 14, 2008), the Central Government has raised Rs.82,000 crore through dated securities under the market borrowing programme. The borrowings were raised in accordance with the indicative calendar except for the auction on July 24, 2008, where a 10-year benchmark security was issued in place of a higher maturity security in view of uncertain market conditions. The auctions held on July 24, 2008 and August 8, 2008 were based on uniform price method. All auctions during 2008-09 (up to August 14, 2008) were for reissuance of existing securities, barring one new issue of 10-year maturity (see Appendix Table 60). The weighted average maturity of dated securities issued during 2008-09 (up to August 14, 2008) at 15.21 years was higher than 14.32 years during the corresponding period of the previous year. The weighted average yield of dated securities issued during the same period increased to 8.72 per cent from 8.24 per cent.
STATE GOVERNMENTS
Ways and Means Advances
VII.28 The revised Scheme of Ways and Means Advances (WMA) and Overdrafts (OD) for the State Governments put in place from 2006-07 following the recommendations of the Advisory Committee on WMA and OD to State Governments (Chairman: Shri.M.P. Bezbaruah), was continued for 2007-08. The aggregate normal WMA limit for the State Governments for 2007-08 was retained at Rs.9,875 crore. Furthermore, under Section 21A of the Reserve Bank of India Act, the Reserve Bank entered into an agreement with the Government of the Union Territory of Puducherry effective December 17, 2007 for carrying out its general banking business and managing rupee public debt and its normal WMA limit was fixed at Rs.50 crore. Accordingly, the aggregate normal WMA limit of all States (inclusive of Union Territory of Puducherry) was at Rs.9,925 crore for 2007-08. The rates of interest on normal/special WMA and OD were linked to the repo rate. In addition, with the objective of providing an incentive to the State Governments to build up the consolidated sinking fund (CSF) and guarantee redemption fund (GRF), the net incremental annual investment in these funds were made eligible for availing special WMA up to a ceiling equivalent to the normal WMA limit.
VII.29 During 2007-08, the average utilisation of normal WMA by the State Governments was high during the first half of the year, but moderated in the second half, particularly in the last quarter. The average utilisation of special WMA for 2007-08 was significantly higher than in 2006-07 throughout the year, barring March 2008. The average utilisation of OD was high during the first half but tapered off towards the close of the year. There was no OD in the months of February and March 2008 (Table 7.11).
Table 7.11 : WMA/Overdrafts of the State Governments* |
(Rupees crore) |
Month |
Special WMA |
Normal WMA |
Overdraft |
Total |
|
2006-07 |
2007-08 |
2008-09 |
2006-07 |
2007-08 |
2008-09 |
2006-07 |
2007-08 |
2008-09 |
2006-07 |
2007-08 |
2008-09 |
1 |
2 |
3 |
4 |
5 |
6 |
7 |
8 |
9 |
10 |
11 |
12 |
13 |
April |
25 |
235 |
489 |
723 |
114 |
287 |
37 |
15 |
139 |
785 |
364 |
916 |
May |
6 |
437 |
310 |
162 |
654 |
3 |
0 |
461 |
0 |
169 |
1552 |
313 |
June |
1 |
204 |
9 |
3 |
222 |
0 |
0 |
10 |
0 |
4 |
436 |
9 |
July |
5 |
389 |
25 |
56 |
310 |
0 |
0 |
3 |
0 |
61 |
702 |
25 |
August |
10 |
307 |
|
145 |
476 |
|
10 |
281 |
|
164 |
1064 |
|
September |
10 |
961 |
|
223 |
601 |
|
2 |
225 |
|
235 |
1787 |
|
October |
9 |
254 |
|
189 |
184 |
|
22 |
128 |
|
220 |
566 |
|
November |
10 |
279 |
|
268 |
351 |
|
48 |
127 |
|
327 |
757 |
|
December |
22 |
161 |
|
246 |
103 |
|
122 |
13 |
|
390 |
277 |
|
January |
43 |
72 |
|
297 |
81 |
|
75 |
34 |
|
415 |
187 |
|
February |
39 |
72 |
|
121 |
8 |
|
5 |
0 |
|
165 |
80 |
|
March |
35 |
5 |
|
4 |
1 |
|
2 |
0 |
|
41 |
6 |
|
Average |
18 |
281 |
365 |
203 |
259 |
73 |
27 |
108 |
46 |
248 |
648 |
316 |
*: Average of daily outstandings. |
VII.30 During 2007-08, eight States resorted to WMA while three States availed OD as compared with eight States and two States, respectively, during the previous year. The number of days for which the States were in WMA was lower than those in the previous year for Jharkhand, Kerala, Maharashtra and Uttarakhand but higher for Punjab, West Bengal, Mizoram and Nagaland (Table 7.12).
Table 7.12: State and Union Territory-wise Availment of WMA/Overdraft |
(Rupees crore) |
S.
No. |
States |
WMA |
Overdraft |
2006-07 |
2007-08 |
2006-07 |
2007-08 |
Number of days |
Number of days |
Number of Occasions* |
Number of days |
Number of Occasions* |
Number of days |
1 |
2 |
3 |
4 |
5 |
6 |
7 |
8 |
1 |
Andhra Pradesh |
0 |
0 |
0 |
0 |
0 |
0 |
2 |
Bihar |
0 |
0 |
0 |
0 |
0 |
0 |
3 |
Chhattisgarh |
0 |
0 |
0 |
0 |
0 |
0 |
4 |
Goa |
0 |
0 |
0 |
0 |
0 |
0 |
5 |
Gujarat |
0 |
0 |
0 |
0 |
0 |
0 |
6 |
Haryana |
0 |
0 |
0 |
0 |
0 |
0 |
7 |
Jharkhand |
29 |
0 |
0 |
0 |
0 |
0 |
8 |
Karnataka |
0 |
0 |
0 |
0 |
0 |
0 |
9 |
Kerala |
223 |
184 |
9 |
63 |
9 |
51 |
10 |
Madhya Pradesh |
0 |
0 |
0 |
0 |
0 |
0 |
11 |
Maharashtra |
42 |
0 |
0 |
0 |
0 |
0 |
12 |
Orissa |
0 |
0 |
0 |
0 |
0 |
0 |
13 |
Punjab |
0 |
19 |
0 |
0 |
0 |
0 |
14 |
Rajasthan |
0 |
0 |
0 |
0 |
0 |
0 |
15 |
Tamil Nadu |
0 |
0 |
0 |
0 |
0 |
0 |
16 |
Uttar Pradesh |
0 |
0 |
0 |
0 |
0 |
0 |
17 |
West Bengal |
0 |
142 |
0 |
0 |
6 |
65 |
18 |
Puducherry |
– |
0 |
– |
– |
0 |
0 |
|
Special Category States |
|
|
|
|
|
|
1 |
Arunachal Pradesh |
2 |
0 |
0 |
0 |
0 |
0 |
2 |
Assam |
0 |
0 |
0 |
0 |
0 |
0 |
3 |
Himachal Pradesh |
1 |
1 |
0 |
0 |
0 |
0 |
4 |
Manipur |
0 |
3 |
0 |
0 |
0 |
0 |
5 |
Meghalaya |
0 |
0 |
0 |
0 |
0 |
0 |
6 |
Mizoram |
1 |
4 |
0 |
0 |
0 |
0 |
7 |
Nagaland |
28 |
30 |
2 |
16 |
1 |
3 |
8 |
Tripura |
0 |
0 |
0 |
0 |
0 |
0 |
9 |
Uttarakhand |
63 |
5 |
0 |
0 |
0 |
0 |
*: Refers to fresh occurrences of overdrafts during the year. – : Not Applicable. |
VII.31 Based on the recommendations of the Committee (Chairman: Shri. M.P. Bezbaruah), the State-wise normal WMA limits for 2008-09 were reviewed towards the end of the year. Accordingly, it was decided to retain the extant State-wise normal WMA limits of Rs.9,925 crore for 2008-09 (inclusive of Rs.50 crore for the Union Territory of Puducherry) (Table 7.13). During 2008-09 (up to August 14, 2008), four States availed of WMA, out of which three States also resorted to OD for a period ranging between 4 and 14 days. While the utilisation of WMA/OD was high in April 2008, it tapered off sharply thereafter, with no State availing normal WMA/OD in June and July 2008. The average daily utilisation of WMA and OD during 2008-09 (up to August 14, 2008) was Rs.313 crore as compared with Rs.769 crore during the corresponding period of the previous year.
Table 7.13: Normal WMA Limits of States/UT |
(Rupees crore) |
State/U.T. |
2004
(effective April 1, 2004) |
2005
(effective April 1, 2005) |
2006
(effective April 1, 2006) |
2007
(effective April 1, 2007) |
2008
(effective April 1, 2008) |
1 |
2 |
3 |
4 |
5 |
6 |
Non-Special Category States/U.T. |
|
|
|
|
Andhra Pradesh |
700 |
770 |
880 |
880 |
880 |
Bihar |
340 |
380 |
425 |
425 |
425 |
Chhattisgarh |
155 |
175 |
190 |
190 |
190 |
Goa |
65 |
65 |
65 |
65 |
65 |
Gujarat |
520 |
575 |
630 |
630 |
630 |
Jharkhand |
175 |
225 |
280 |
280 |
280 |
Haryana |
245 |
280 |
295 |
295 |
295 |
Karnataka |
505 |
570 |
625 |
625 |
625 |
Kerala |
315 |
345 |
350 |
350 |
350 |
Madhya Pradesh |
395 |
420 |
460 |
460 |
460 |
Maharashtra |
1,000 |
1,050 |
1,160 |
1,160 |
1,160 |
Orissa |
250 |
270 |
300 |
300 |
300 |
Punjab |
325 |
360 |
360 |
360 |
360 |
Rajasthan |
405 |
440 |
505 |
505 |
505 |
Tamil Nadu |
615 |
670 |
730 |
730 |
730 |
Uttar Pradesh |
835 |
920 |
1,020 |
1,020 |
1,020 |
West Bengal |
480 |
495 |
545 |
545 |
545 |
Puducherry |
NA |
NA |
NA |
50# |
50 |
Sub Total |
7,325 |
8,010 |
8,820 |
8,870 |
8,870 |
|
|
|
|
|
|
Special Category States |
|
|
|
|
|
Arunachal Pradesh |
50 |
50 |
65 |
65 |
65 |
Assam |
250 |
295 |
300 |
300 |
300 |
Himachal Pradesh |
140 |
145 |
190 |
190 |
190 |
Manipur |
50 |
55 |
60 |
60 |
60 |
Meghalaya |
50 |
55 |
60 |
60 |
60 |
Mizoram |
50 |
50 |
55 |
55 |
55 |
Nagaland |
60 |
65 |
80 |
80 |
80 |
Tripura |
70 |
80 |
100 |
100 |
100 |
Uttarakhand |
95 |
130 |
145 |
145 |
145 |
Sub Total |
815 |
925 |
1,055 |
1,055 |
1,055 |
Total |
8,140 |
8,935 |
9,875 |
9,925 |
9,925 |
|
|
|
|
|
|
U.T. : Union Territory |
#: Effective December 17, 2007 |
|
|
|
|
VII.32 Despite a significant deceleration in the automatic inflow of NSSF funds due to lower collections, most State Governments accumulated sizeable cash surpluses, reflecting the State-level fiscal consolidation measures and the substantial increase in the discretionary market borrowings. The surplus cash balances of the State Governments are automatically invested in 14-day Intermediate Treasury Bills (ITBs) at a discount rate of 5 per cent. In search of higher yields, the State Governments resorted to investment in auction Treasury Bills (ATBs). As a result, during 2007-08, the monthly average investment by the State Governments in ITBs declined by 8 per cent to Rs. 39,654 crore from Rs.42,988 crore in the previous year. Correspondingly, the monthly average investment by the State Governments in ATBs increased by 64.4 per cent to Rs.34,393 crore from Rs.20,920 crore in the previous year (Table 7.14). However, in anticipation of meeting their year-end expenditure, the States appeared to have shifted from ATBs to ITBs and also temporarily parked the proceeds from market borrowings in ITBs. As a result, the outstanding investments by the States in ITBs, at Rs.68,129 crore (26 States), were higher at end-March 2008 than Rs.39,217 crore (22 States) at end-March 2007. The outstanding investment of State Governments in ATBs at end-March 2008 was lower at Rs.29,486 crore than Rs.34,186 crore at end-March 2007.
Table 7.14: Investments of the State Governments/UT* |
(Rupees crore) |
Month |
Investment in 14-day
Treasury Bills |
Investment in Auction
Treasury Bills |
Total |
2006-07 |
2007-08 |
2008-09 |
2006-07 |
2007-08 |
2008-09 |
2006-07 |
2007-08 |
2008-09 |
1 |
2 |
3 |
4 |
5 |
6 |
7 |
8 |
9 |
10 |
April |
32,538 |
31,160 |
48,192 |
14,247 |
34,496 |
31,780 |
46,785 |
65,656 |
79,972 |
May |
34,559 |
31,359 |
48,280 |
17,542 |
32,612 |
32,244 |
52,101 |
63,971 |
80,525 |
June |
40,680 |
44,430 |
42,865 |
19,262 |
32,500 |
40,285 |
59,941 |
76,930 |
83,150 |
July |
47,089 |
35,938 |
46,742 |
16,626 |
39,557 |
38,802 |
63,715 |
75,495 |
85,543 |
August |
47,538 |
36,458 |
|
17,249 |
42,477 |
|
64,787 |
78,935 |
|
September |
47,858 |
34,282 |
|
18,762 |
39,201 |
|
66,620 |
73,483 |
|
October |
38,470 |
32,052 |
|
21,529 |
35,195 |
|
59,999 |
67,246 |
|
November |
41,694 |
30,556 |
|
21,656 |
33,872 |
|
63,350 |
64,427 |
|
December |
43,879 |
38,042 |
|
25,106 |
31,565 |
|
68,985 |
69,607 |
|
January |
42,860 |
45,029 |
|
25,591 |
29,661 |
|
68,451 |
74,690 |
|
February |
48,054 |
50,633 |
|
24,554 |
32,403 |
|
72,608 |
83,036 |
|
March |
50,632 |
65,910 |
|
28,920 |
29,181 |
|
79,552 |
95,091 |
|
Average |
42,988 |
39,654 |
46,520 |
20,920 |
34,393 |
35,778 |
63,908 |
74,047 |
82,298 |
* : Average of Friday outstandings. |
VII.33 The liquidity position of most of the States has remained generally comfortable during 2008-09 so far. The average investment by State Governments in TBs (both ITBs and ATBs) during 2008-09 (up to August 14, 2008) was higher than during the corresponding period of the previous year. The outstanding investment of State Governments in TBs at Rs.84,905 crore on August 14, 2008 was higher as against Rs.78,238 crore on August 14, 2007.
VII.34 Consolidated sinking funds (CSFs) and the guarantee redemption funds (GRFs) of the State Governments were exclusively invested in Government securities held in the books of the Reserve Bank up to 2007-08. In view of the sharp increase in the quantum of the investment portfolio of the States and the finite stock of securities with the Reserve Bank, the Bank purchased Government securities amounting to Rs.2,073 crore on behalf of State Governments from the secondary market during 2008-09 so far (up to July 31, 2008) and transferred these securities to the CSF set up by the State Governments without loading any additional charge
(Box VII.2).
Box VII.2
Management of States’ Investment Portfolio by the Reserve Bank
Consolidated Sinking Fund (CSF)
Following the recommendations of the Tenth Finance Commission (1995) and subsequent discussions with the State Governments, the Reserve Bank circulated the scheme of CSF to the State Governments in June 1999. The objective of setting up the CSF by the State Governments was to provide a cushion to the repayment of open market loans. As per the scheme, the State Governments were required to contribute to the Fund every year 1 to 3 per cent of the outstanding open market loans as at the end of the previous year. Withdrawal was not allowed before 5 years from the date of notification of the scheme by the State Government. The investments in CSF were undertaken by the Reserve Bank out of its own stock of Government securities. The scheme was revised in line with the recommendations of the Twelfth Finance Commission (TFC, November 2004), the Advisory Committee on Ways and Means Advances to State Governments (Chairman: Shri M. P. Bezbaruah) (October, 2005) and the Technical Group on Borrowings by the States (Chairperson: Smt. Shyamala Gopinath) (December 2005). The revisions included (i) extending the ambit of the CSF to cover amortisation of all liabilities (and not just open market borrowings as was the case earlier); (ii) eligibility of the States to avail special WMA equivalent to their net incremental annual investment in CSF; (iii) contribution by the States of at least 0.5 per cent of the outstanding liabilities to the Fund; and (iv) provision for acquiring of securities by the Reserve Bank from the secondary market. The revised scheme was circulated by the Reserve Bank in May 2006 to the State Governments. As on August 13, 2008, 18 States notified the CSF scheme, of which 14 States notified the revised CSF scheme. The aggregate outstanding investments in CSF by the 18 State Governments increased to Rs.20,966 crore as on July 31, 2008 from Rs.3,015 crore as on July 31, 2004.
Guarantee Redemption Fund (GRF)
In accordance with the recommendations of the Technical Committee on State Government Borrowings (1999) set up by the Reserve Bank to examine the issue of State Government guarantees in all its aspects, the Reserve Bank circulated the scheme of GRF to the State Governments in August 2001. The investments in GRF were undertaken by the Reserve Bank out of its own stock of Government securities. The objective of setting up GRF was to provide a cushion to the servicing of contingent liability arising from invocation of guarantees issued by the Government in respect of bonds issued and other borrowings by state level undertakings or other bodies. As per the scheme, the State Governments were required to contribute an amount equivalent to at least 1/5th of the outstanding invoked guarantees plus an amount of likely invocation as a result of the incremental guarantees issued during the year, so as to reach the level deemed sufficient to meet the amount of anticipated guarantees devolving on the Government as a result of the likely invocation of outstanding guarantees in the succeeding 5 years. The scheme was revised in line with the recommendations of the TFC, the Advisory Committee on WMA to State Governments and the Technical Group on Borrowings by the States. The revisions included eligibility of the States to avail Special WMA equivalent to their net incremental annual investment in GRF and provision for acquiring of securities by the Reserve Bank from the secondary market. The revised scheme was circulated by the Reserve Bank in May 2006 to the State Governments. As on August 13, 2008, eight States notified the GRF scheme, of which three States notified the revised GRF scheme. The aggregate outstanding investments in GRF by the eight State Governments increased to Rs.2,869 crore as on July 31, 2008, from Rs.556 crore as on July 31, 2004.
Calamity Relief Fund (CRF)
Following the recommendations of the TFC, the Central Government had circulated the CRF scheme among the State Governments. The scheme involved the constitution of a calamity relief fund by each State for the purpose of financing natural calamity relief assistance. The TFC worked out the total size of CRF at Rs.21,333 crore with contribution from Centre and States in the ratio of 75:25, for the operative period 2005-2010. The scheme was subsequently revised and circulated in June 2006 wherein States were given discretion to choose the Reserve Bank as the fund manager. The investments under the CRF scheme are not eligible for special WMA facility. The States are yet to notify the CRF scheme with the Reserve Bank as the fund manager.
Special Reserve Fund (SRF)
The TFC had recommended that external assistance be transferred by the Central Government to the State Governments on a back-to-back basis on the same terms and conditions as attached to such assistance by external funding agencies. The recommendation was accepted by the Central Government. Furthermore, the Technical Group on Borrowings by State Governments (Chairperson: Smt. Shyamala Gopinath) (December 2005) recommended the setting up of a separate sinking fund for managing exchange rate risks which could be funded by the savings resulting from payment of lower rate of interest on external borrowings in favourable times. The modalities for setting up of the fund were discussed in the State Finance Secretaries Conference.
Market Borrowings
VII.35 The provisional net allocation under the market borrowing programme for the State Governments for 2007-08 was placed at Rs.28,781 crore. Taking into account the repayments of Rs.11,555 crore and additional allocation of Rs.40,234 crore (of which Rs.35,780 crore was on account of shortfall in collections under the NSSF), the gross allocation amounted to Rs.80,570 crore during 2007-08. The State Governments raised a gross amount of Rs.67,779 crore in 2007-08 as compared with Rs.20,825 crore in the previous year (Table 7.15 and Appendix Table 61). The entire gross amount was raised through the auction route during 2007-08 as in the previous year. Four States (Chhattisgarh, Haryana, Orissa and Tripura) did not participate in the market borrowing programme during 2007-08, while 11 States did not raise the entire amount allocated to them.
| Table 7.15: Annual Market Borrowings of the State Governments |
(Rupees crore) |
Items |
2006-07 |
2007-08# |
2008-09 |
1 |
2 |
3 |
4 |
1. |
Net Allocation |
17,242 |
28,781 |
44,692 P |
2. |
Additional Allocation |
2,803 |
4,454 |
45 P |
3. |
Additional allocation on |
|
|
|
|
account of NSSF shortfall |
- |
35,780 |
- |
4. |
Total Net allocation (1+2+3) |
20,045 |
69,015 |
44,737 P |
5. |
Repayments |
6,551 |
11,555 * |
14,371 |
|
|
|
|
(5,130) @ |
6. |
Gross Allocation (4+5) |
26,597 |
80,570 |
59,108 P |
7. |
Total Amount Raised |
20,825 |
67,779 |
10,812 @ |
8. |
Net amount raised (7-5) |
14,274 |
56,068 |
5,682 @ |
9. |
Outstanding State Development Loans(end-period) |
2,42,777 |
2,98,845 |
|
P : Provisional. *
: Excluding Rs.156 crore of buy-back of securities by Government of Orissa.
# : Includes the Union Territory of Puducherry.
@: Up to August 14, 2008. |
VII.36 During 2007-08, 18 tranches of auctions were held under the market-borrowing programme of the State Governments as compared with 12 tranches of auctions during the previous year. All the issues during 2007-08 were of 10-year maturity. The State Governments raised market loans in all the months of 2007-08 (Table 7.16 and Appendix Table 62).
Table 7.16: Month-wise Market Borrowings of |
State Governments |
Sr. No. |
Month/ Date |
Raised through Auction |
Spread over Central
Government Dated
Security(Basis points) |
No. of States /U.T. |
Amount
(Rupee scrore) |
Cut-off Yield
(Percent) |
1 |
2 |
3 |
4 |
5 |
6 |
2007-08 |
|
|
|
|
1. |
April |
5 |
1,837 |
8.30 |
22 |
2. |
May |
1 |
350 |
8.34 |
23 |
3. |
May |
2 |
1,400 |
8.40 |
28 |
4. |
June |
9 |
3,566 |
8.45-8.57 |
23-35 |
5. |
July |
5 |
1,389 |
8.00-8.25 |
19-44 |
6. |
August |
8 |
3,484 |
8.30-8.90 |
30-90 |
7. |
September |
8 |
3,074 |
8.14-8.50 |
32-68 |
8. |
October |
1 |
590 |
8.20 |
29 |
9. |
October |
4 |
4,672 |
8.31-8.40 |
37-46 |
10. |
November |
6 |
5,300 |
8.39-8.69 |
51-81 |
11. |
November |
6 |
5,212 |
8.45-8.50 |
55-60 |
12. |
December |
11 |
2,963 |
8.39-8.58 |
50-69 |
13. |
January |
6 |
5,833 |
8.03-8.12 |
33-42 |
14. |
January |
12 |
7,778 |
7.84-7.98 |
46-60 |
15. |
February |
13 |
7,776 |
7.93-8.02 |
39-48 |
16. |
February |
7 |
4,975 |
8.12-8.48 |
47-83 |
17. |
March |
4 |
4,349 |
8.28-8.45 |
63-80 |
18. |
March |
12 |
3,229 |
8.35-8.70 |
54-89 |
|
Total |
|
67,779 |
7.84-8.90 |
19-90 |
2008-09 |
|
|
|
|
1. |
April |
4 |
2,648 |
8.50-8.60 |
35-45 |
2. |
May |
5 |
3,264 |
8.39-8.68 |
30-59 |
3. |
June |
3 |
2,300 |
9.38-9.59 |
77-98 |
4. |
July |
1 |
500 |
9.81 |
49 |
5. |
July |
3 |
2,100 |
9.86-9.90 |
48-52 |
UT: Union Territory. |
VII.37 During 2007-08, while two State Governments had accessed the market as many as nine times, two other State Governments accessed the market only on one occasion. In all, 120 new securities were issued by the State Governments during 2007-08 as compared to 72 securities during 2006-07 (Table 7.17). The average issue size during 2007-08 was Rs.565 crore as compared with Rs.289 crore during the previous year.
Table 7.17: Frequency Distribution of |
Tranches of Auctions during 2007-08 |
No. of times entering
the Market/Tranches |
No. of States/U.T. |
No. of securities
issued |
1 |
2 |
3 |
1 |
2 |
2 |
2 |
4 |
8 |
3 |
2 |
6 |
4 |
7 |
28 |
6 |
3 |
18 |
8 |
5 |
40 |
9 |
2 |
18 |
Total |
25 |
120 |
UT: Union Territory. |
VII.38 The weighted average cost of market borrowings for State Governments increased significantly from 6.13 per cent in 2003-04 to 8.25 per cent in 2007-08 reflecting the general hardening of interest rates. The weighted average yield firmed up by 15 basis points during 2007-08 as compared to 47 basis points during 2006-07 (Appendix Table 63). The cut-off yield in the auction of State Government securities ranged between 7.84 per cent and 8.90 per cent during 2007-08 (Table 7.18).
| Table 7.18: Yield on State Government Securities |
(Per Cent) |
Year |
Range |
Weighted
Average |
1 |
2 |
3 |
1997-98 |
12.30-13.05 |
12.82 |
1998-99 |
12.15-12.50 |
12.35 |
1999-00 |
11.00-12.25 |
11.89 |
2000-01 |
10.50-12.00 |
10.99 |
2001-02 |
7.80-10.53 |
9.20 |
2002-03 |
6.60-8.00 |
7.49 |
2003-04 |
5.78-6.40 |
6.13 |
2004-05 |
5.60-7.36 |
6.45 |
2005-06 |
7.32-7.85 |
7.63 |
2006-07 |
7.65-8.66 |
8.10 |
2007-08 |
7.84-8.90 |
8.25 |
VII.39 The increase in the cost of borrowings during the period 2004-05 to 2007-08 was highest in respect of Uttarakhand (202 basis points), while it was the lowest for Sikkim (107 basis points). The spread between minimum and maximum weighted average yield during 2007-08 increased to 64 basis points from 45 basis points during 2006-07; the spread, however, was lower than 87 basis points during 2004-05 (Appendix Table 63).
VII.40 The spread between the cut-off yield of State Government securities in the auctions and the secondary market yield of Central Government security of comparable maturity, was above 50 basis points for 49 (out of 120) securities issued during 2007-08 (Appendix Table 62); the spread was higher than 50 basis points for only two securities (out of 72 securities) issued during 2006-07. The weighted average spread was over 50 basis points for the Union Territory of Puducherry and for seven States, viz., Andhra Pradesh, Goa, Uttar Pradesh, Bihar, Karnataka, Uttarakhand and Jammu & Kashmir (Table 7.19). Hardening of interest rates due to prevailing market conditions and large borrowings by the State Governments mainly resulted in higher spreads during 2007-08.
Weighted Average Spread(Basis Points) |
Table 7.19: Weighted Average Spreads General Category States/UTs |
during 2007-08 Special Category States |
1 |
2 |
3 |
31– 40 |
Madhya Pradesh and Rajasthan |
Nagaland |
41 – 50 |
Kerala, Tamil Nadu, Gujarat, Jharkhand, Maharashtra, Punjab and West Bengal |
Assam, Arunachal Pradesh, Himachal Pradesh, Manipur, Meghalaya, Mizoram, Sikkim |
51 – 60 |
Andhra Pradesh, Goa, Puducherry, Uttar Pradesh, Bihar and Karnataka |
Uttarakhand |
Above 60 |
- |
Jammu & Kashmir |
VII.41 As a result of increase in the cost of borrowings in 2007-08, the share of outstanding loans in the range of interest rate, 8.00-8.99 per cent increased sharply at end-March 2008 as compared with end-March 2007. The share of outstanding securities in other interest rate ranges declined significantly (Table 7.20).
| Table 7.20: Interest Rate Profile of the Outstanding Stock of tate Government Securities |
Sr. No. |
Range of Interest
Rate(per cent) |
Outstanding Amount
(Rupees crore) |
Percentage to Total |
End-March 2007 |
End-March 2008 |
End-March 2007 |
End-March 2008 |
|
1 |
2 |
3 |
4 |
5 |
1. |
5.00-5.99 |
33,825 |
33,825 |
13.9 |
11.3 |
2. |
6.00-6.99 |
58,564 |
58,564 |
24.1 |
19.6 |
3. |
7.00-7.99 |
59,638 |
69,936 |
24.6 |
23.4 |
4. |
8.00-8.99 |
18,791 |
76,272 |
7.7 |
25.5 |
5. |
9.00-9.99 |
5,412 |
5,412 |
2.2 |
1.8 |
6. |
10.00-10.99 |
14,468 |
14,418 |
6.0 |
4.8 |
7. |
11.00-11.99 |
16,934 |
16,869 |
7.0 |
5.6 |
8. |
12.00-12.99 |
25,959 |
23,550 |
10.7 |
7.9 |
9. |
13.00-13.99 |
9,186 |
0 |
3.8 |
0.0 |
|
Total |
2,42,777 |
2,98,845 |
100 |
100 |
VII.42 At end-March 2008, two-thirds of the total outstanding debt of State Governments were in the maturity bucket of 6-10 years, marginally lower than 67.1 per cent at end-March 2007. The share of loans in the maturity bucket of 6-10 years ranged between 47.4 per cent (Orissa) and 100.0 per cent (Puducherry) (Table 7.21).
Table 7.21: Maturity Profile of Outstanding |
State Government Securities |
(At End-March 2008) |
Sr. No. |
State |
Percentage to Total Amount Outstanding |
Total Amount
Outstanding
(Rupees crore) |
0-5 Years |
6-10 Years |
1 |
2 |
3 |
4 |
5 |
1. |
Andhra Pradesh |
38.8 |
61.2 |
29,186 |
2. |
Arunachal Pradesh |
17.7 |
82.3 |
598 |
3. |
Assam |
38.0 |
62.0 |
7,155 |
4. |
Bihar |
48.8 |
51.2 |
11401 |
5. |
Chhattisgarh |
43.7 |
56.3 |
1,837 |
6. |
Goa |
35.3 |
64.7 |
1,477 |
7. |
Gujarat |
33.1 |
66.9 |
19,021 |
8. |
Harayana |
42.5 |
57.5 |
4,741 |
9. |
Himachal Pradesh |
29.8 |
70.2 |
5,905 |
10. |
Jammu & Kashmir |
25.4 |
74.6 |
5,645 |
11. |
Jharkhand |
23.5 |
76.5 |
4,039 |
12. |
Karnataka |
47.9 |
52.1 |
11,988 |
13. |
Kerala |
27.9 |
72.1 |
16,481 |
14. |
Madhya Pradesh |
34.4 |
65.6 |
13,257 |
15. |
Maharashtra |
18.6 |
81.4 |
27,711 |
16. |
Manipur |
23.4 |
76.6 |
1,078 |
17. |
Meghalya |
32.6 |
67.4 |
1,268 |
18. |
Mizoram |
31.2 |
68.8 |
838 |
19. |
Nagaland |
34.6 |
65.4 |
1,998 |
20. |
Orissa |
52.6 |
47.4 |
8,024 |
21. |
Punjab |
23.0 |
77.0 |
13,228 |
22. |
Rajasthan |
39.7 |
60.3 |
19,303 |
23. |
Sikkim |
22.1 |
77.9 |
742 |
24. |
Tamil Nadu |
32.6 |
67.4 |
20,502 |
25. |
Tripura |
41.5 |
58.5 |
1,114 |
26. |
Uttarakhand |
25.5 |
74.5 |
4,620 |
27. |
Uttar Pradesh |
40.2 |
59.8 |
33,771 |
28. |
West Bengal |
21.4 |
78.6 |
31,579 |
29. |
Puducherry |
0.0 |
100.0 |
337 |
|
Total |
33.1 |
66.9 |
2,98,845 |
Note: Data are provisional |
VII.43 The maturity profile of market borrowings shows large repayment obligations from 2012-13 onwards due to high amount of borrowings between 2002-03 and 2004-05 under the Debt Swap Scheme. The repayment obligations will more than double in 2017-18 over the previous year on account of the large magnitude of borrowings during 2007-08 to meet the NSSF shortfall (Table 7.22).
Table 7.22: Maturity Profile of Outstanding |
State Loans and Power Bonds |
(At end-March 2008) |
(Rupees crore) |
Year |
State Loans |
Power Bonds |
Total Outstanding |
1 |
2 |
3 |
4 |
2008-09 |
14,371 |
2,907 |
17,278 |
2009-10 |
16,238 |
2,907 |
19,145 |
2010-11 |
15,660 |
2,907 |
18,567 |
2011-12 |
21,993 |
2,907 |
24,900 |
2012-13 |
30,628 |
2,870 |
33,498 |
2013-14 |
32,079 |
2,870 |
34,949 |
2014-15 |
33,384 |
2,870 |
36,254 |
2015-16 |
35,191 |
2,907 |
38,098 |
2016-17 |
31,522 |
1,453 |
32,975 |
2017-18 |
67,779 |
0 |
67,779 |
Total |
2,98,845 |
24,598 |
3,23,443 |
Indicative Calendar for Market Borrowings of State Governments
VII.44 The Annual Policy Statement of the Reserve Bank for 2006-07 proposed, inter-alia, that “States, at their discretion and initiative, would be encouraged to develop an advance indicative open market borrowing calendar”. Based on the decisions taken in the 18th and 19th Conferences of the State Finance Secretaries, an attempt was made to obtain the period-wise borrowing requirements from the State Governments during 2007-08. In order to initiate a step towards greater transparency in market borrowings of the State Governments in a progressive manner, the Reserve Bank issued a press release on ‘Market Borrowings of State Governments’ on September 12, 2007 detailing net allocation, maturities, the amount raised till then and the balance to be raised during the remaining period of 2007-08.
Use of Cash Balances to Retire debt
VII.45 The build up of large surplus cash balances by the State Governments in recent years and the negative spread earned on the investment of such balances prompted some State Governments to utilise them to retire outstanding debt. The scheme for the buy-back of outstanding State Development Loans (SDLs) which was made operative during 2006-07 through two rounds of reverse auctions, continued during 2007-08. A total amount of Rs.156 crore covering 11 SDLs of Government of Orissa was purchased through these operations which were conducted through secondary market purchases on NDS-OM platform in February and March 2008. Two State Governments, viz., Orissa and Tamil Nadu, also bought back the loans amounting to Rs.217 crore and Rs.1,178 crore, respectively, borrowed from the National Small Savings Fund (NSSF).
Market Borrowings of State Governments during 2008-09 so far (up to August 14, 2008)
VII.46 The estimated net market borrowings of the State Governments for 2008-09 are placed at Rs.44,737 crore inclusive of additional allocation of Rs. 45 crore. Taking into account repayments of Rs.14,371 crore, the gross market borrowings of State Governments are estimated at Rs.59,108 crore. During the current year so far (up to August 14, 2008), eight State Governments raised Rs.10,812 crore under the market borrowing programme as compared with Rs.8,542 crore during the corresponding period of the previous year. The cut-off yield in the auction ranged between 8.39 per cent and 9.90 per cent. The weighted average interest rate on market loans firmed up to 9.07 per cent during 2008-09 (up to August 14, 2008) from 8.35 per cent during the corresponding period of 2007-08. The spreads of State Government securities over the yields of Central Government security of corresponding maturity ranged between 30 and 98 basis points as against 19 and 44 basis points during the corresponding period of 2007.
Conference of State Finance Secretaries
VII.47 The 20th Conference of State Finance Secretaries was held on August 24, 2007. Apart from operational issues pertaining to Government transactions, the discussions primarily focused on issues relating to the framework for investment of the cash balances of the State Governments, investment portfolio of the States, management of foreign exchange risk by the States in the context of back-to-back transfer of external loans from the Centre and the Standing Technical Committee on the borrowings of the States. The issues focused in the 21st Conference held on May 15, 2008 related to surplus cash balances of the State Governments, market borrowings, budget management and management of various funds of the States.
Outlook
VII.48 The size of market borrowing programme of the Central Government through dated securities for 2008-09 is placed lower than the actual borrowing raised during 2007-08, reflecting the decline in the borrowing requirements as envisaged in the Union Budget 2008-09. However, the size of ‘off-budget’ borrowings by way of issuances of special securities could have implications for management of normal market borrowings. The enactment of the Government Securities Act, 2006 and Government Securities Regulations, 2007 would facilitate introduction of STRIPS. In order to carry forward the reform process to enhance efficiency in debt management, active consolidation and appropriate mix of securities could be pursued during 2008-09. An Internal Working Group was constituted by the Reserve Bank to review the extant auction procedure followed for issuances of Government securities and make suggestions to reduce the time taken for completion of the auction process and improve the overall efficiency. The recommendations of the Working Group are being examined for implementation. Measures are being initiated to introduce the scheme of non-competitive bidding facility in the auctions of State Government securities during 2008-09. Re-issuances of State Governments securities could be pursued in consultation with the State Governments to improve liquidity by building up a critical mass. |