With downside risks to the outlook for growth getting accentuated by COVID-19 and outweighing concerns around inflation exceeding the upper tolerance band for the target during December 2019-February 2020, the monetary policy committee reduced the policy rate by a cumulative 250 basis points (bps) during February 2019-June 2020, including a sizeable 115 bps in its off-cycle meetings in March and May 2020, and shifted the stance from neutral to accommodative in June 2019. Systemic liquidity remained in large surplus starting June 2019. The Reserve Bank undertook a series of measures to counter the effects of COVID-19. Monetary transmission improved in the second half of 2019-20. III.1 The conduct of monetary policy in 2019-20 was guided by the objective of achieving the medium-term target for consumer price index (CPI) inflation of 4 per cent with a tolerance band of +/- 2 per cent, while supporting growth. Inflation remained benign during the first half of 2019-20 but exceeded the upper tolerance band around the target during December 2019-February 2020 on the back of rising food price pressures. Real gross domestic product (GDP) growth, however, slowed down over the course of the year. The COVID-19 outbreak and the nation-wide lockdown from the final quarter of the year brought in unprecedented downside risks to the growth outlook. The monetary policy committee (MPC) cut the policy repo rate by a cumulative 185 basis points (bps) during 2019-20, including a sizeable 75 basis points in its off-cycle meeting in March 2020. The MPC shifted the stance from neutral to accommodative in June 2019 and in March 2020, it committed on maintaining the accommodative stance as long as necessary to revive growth and mitigate the impact of COVID-19 on the economy. III.2 During 2019-20, systemic liquidity remained in surplus beginning June 2019, with the overhang increasing in the subsequent months. The Reserve Bank employed multiple tools to manage both frictional and durable liquidity and simplified the liquidity management framework with a focus on a clearer communication of the objectives and the toolkit for liquidity management. III.3 In response to the COVID-19 pandemic, the Reserve Bank undertook a series of measures – long-term repo operations (LTROs); targeted LTROs (TLTROs) for specific sectors and entities; cut in the cash reserve ratio (CRR); more flexibility to banks in the daily maintenance of CRR; increase in the limit under the marginal standing facility (MSF); widening of the policy corridor and making it asymmetric; refinance facility to all-India financial institutions; and special liquidity facility for mutual funds. These measures were aimed at expanding liquidity in the system sizeably to ensure that financial markets and institutions are able to function normally in the face of COVID-related dislocations. Monetary transmission improved especially in the second half of 2019- 20 after new floating rate loans were linked to an external benchmark. III.4 Against this backdrop, section 2 presents the implementation status of the agenda set for 2019-20 while section 3 sets out the agenda for 2020-21. The chapter has been summarised at the end. 2. Agenda for 2019-20: Implementation Status Goals Set for 2019-20 III.5 In last year’s Annual Report, the Department had set out the following goals: -
Refining the liquidity forecasting framework, sharpening the estimation of currency in circulation at various frequencies and an overall reviewing of operational aspects of the liquidity management framework, including aspects relating to structural liquidity balance and distributional asymmetry in liquidity (Utkarsh) [Para III.16 and III.38]; -
An analysis of food inflation dynamics to understand the sources of volatility and to examine the relative role of cyclical and structural factors at play to improve inflation forecasts (Para III.38); -
Spatial dimensions of inflation to better understand the divergences in inflation rates across major groups/sub-groups and changes in them over time and implications for aggregate inflation (Para III.38); -
An analysis of sectoral credit flows to understand monetary transmission (Para III.38); and -
Implications of the asset quality/health of the banking sector and NBFCs on credit flows to the commercial sector (Para III.38). Implementation Status of Goals Monetary Policy III.6 In April 2019, in its first bi-monthly monetary policy meeting for the year 2019-20, the MPC reduced the policy repo rate by 25 bps on top of reduction by 25 bps in February 2019. The first bi-monthly statement projected headline inflation in the range 2.9-3.0 per cent for H1:2019-20 and 3.5-3.8 per cent for H2:2019-20, with risks broadly balanced. Real GDP growth was projected at 7.2 per cent for 2019-20, while noting headwinds, especially on the global front. The MPC voted to reduce the policy repo rate by 25 bps to 6.0 per cent, with a majority of 4 to 2; it persevered with a neutral policy stance by a vote of 5 to 1. III.7 The second bi-monthly policy review of June 2019 was held against the backdrop of a further weakening of domestic growth impulses. Although inflation had edged up, it was projected to remain within the target of 4 per cent over the course of the year. Concerned over the sharp slowdown in investment activity and the continuing moderation in consumption demand, the MPC saw scope to accommodate growth concerns while remaining consistent with the flexible inflation targeting mandate. It, therefore, unanimously reduced the policy repo rate by another 25 bps to 5.75 per cent and also changed the stance of monetary policy from neutral to accommodative. III.8 At the time of the third bi-monthly monetary policy review of August 2019, there was a further loss of momentum in growth and forward-looking surveys pointed to muted demand conditions ahead. The inflation scenario continued to be benign and the outlook was largely unchanged from the second bi-monthly review – it was projected to remain within the target over a 12-month horizon. This provided the MPC headroom for policy action to address growth concerns by boosting aggregate demand, especially private investment. The MPC unanimously decided on a rate reduction and a continuation of the accommodative monetary policy stance. The MPC reduced the policy repo rate by 35 bps with a majority vote of 4 to 2 (2 members voted for a cut of 25 bps). III.9 The MPC met for the fourth bi-monthly review in October 2019 against the backdrop of a further weakening of economic activity, both global and domestic. Real GDP growth projection for 2019-20 was revised downwards by 80 bps from 6.9 per cent in the third bi-monthly resolution to 6.1 per cent on the back of moderation in both investment and consumption demand. On the inflation front, the outlook for H2:2019-20 and Q1:2020-21 was unchanged from the third bi-monthly projections, although the near-term projections were revised upwards due to an uptick in food inflation. Given the policy space and the growth concerns, the MPC unanimously voted for a further reduction of 25 bps in the policy rate, with a majority vote of 5 to 1 (one member voted for a cut of 40 bps). The MPC also unanimously voted to continue with an accommodative stance as long as necessary to revive growth, while ensuring that inflation remained within the target. III.10 The inflation trajectory underwent a dramatic change when the MPC met for the fifth bi-monthly policy in December 2019. After remaining benign for more than a year, headline inflation rose sharply to 4.6 per cent in October, propelled by a surge in food inflation, which spiked to a 39-month high in October. Vegetable prices soared due to heavy unseasonal rains and the incipient price pressures in other food items such as milk, pulses, and sugar were expected to sustain. By contrast, inflation in CPI excluding food and fuel moderated to a historic low in October. The sudden and unanticipated spike in food prices significantly altered the near-term inflation trajectory and the CPI inflation projections were revised upwards to 5.1-4.7 per cent for H2:2019-20 and 4.0-3.8 per cent for H1:2020-21, with risks broadly balanced. On the other hand, real GDP growth projection for 2019-20 was further revised downwards to 5.0 per cent, reflecting more than anticipated loss of momentum in domestic economic activity. The MPC felt it was prudent to carefully monitor incoming data to gain clarity on the inflation outlook and, therefore, paused while recognising that there was monetary policy space for future action. The MPC reiterated its commitment to continue with the accommodative stance as long as necessary to revive growth, while ensuring that inflation remained within the target. III.11 In the run up to the sixth bi-monthly policy in February 2020, headline inflation had breached the upper inflation tolerance band around the target and surged to 7.4 per cent in December 2019 – the highest reading since July 2014 – as the unseasonal rains led to an unprecedented increase in onion prices and exacerbated price pressures in other vegetables. Kharif pulses, cereals and milk also exhibited price pressures, along with an increase in input costs for services. CPI inflation was projected to moderate from 6.5 per cent for Q4:2019-20 to 5.4-5.0 per cent for H1:2020-21 and to 3.2 per cent for Q3:2020-21. GDP growth for 2020-21 was projected at 6.0 per cent; the coronavirus outbreak was seen as impacting tourist arrivals and global trade. The MPC noted that the trajectory of inflation excluding food and fuel needed to be carefully monitored in view of the pass-through of remaining revisions in mobile phone charges, the increase in prices of drugs and pharmaceuticals and the impact of new emission norms. With economic activities remaining weak and the output gap negative, the MPC noted that the outlook for inflation was highly uncertain. Given the evolving growth-inflation dynamics, the MPC felt it appropriate to maintain status quo while recognising policy space for future action. III.12 The COVID-19 pandemic and its increasingly adverse impact on both the global and domestic economy, amidst elevated volatility in financial markets necessitated an advancement in the MPC’s meeting scheduled for March 31, April 1 and 3, 2020 to March 24, 26 and 27, 2020. Headline inflation had fallen by a full percentage point in February 2020 to 6.6 per cent, with the ebbing of onion and other food prices. The MPC noted that food prices could soften even further under the beneficial effects of record foodgrains and horticulture production. The collapse in crude prices was seen as working towards easing both fuel and core inflation pressures, depending on the level of the pass-through to retail prices. As a consequence of COVID-19, aggregate demand could weaken and ease core inflation further. Heightened volatility in financial markets could also have a bearing on inflation. On the growth outlook, the MPC observed that most sectors of the economy would be adversely impacted by the pandemic, depending upon its spread, intensity, and duration. The slump in international crude prices could, however, provide some relief in the form of terms of trade gains. The MPC took note of the several measures undertaken by the Reserve Bank to inject substantial liquidity in the system. It was of the view that macroeconomic risks, both on the demand and supply sides, brought on by the pandemic could be severe and there was a need to do whatever necessary to shield the domestic economy from the pandemic. The MPC, therefore, unanimously voted for a sizeable reduction in the policy repo rate, but with some differences in the view on quantum of reduction. With a 4-2 majority, the repo rate was cut by 75 bps to 4.40 per cent (2 members voted for a reduction of 50 bps). All members voted unanimously to continue with the accommodative stance as long as necessary to revive growth and mitigate the impact of COVID-19 on the economy, while ensuring that inflation remained within the target. III.13 The subsequent releases of data indicated that the macroeconomic impact of the pandemic was more severe than initially anticipated and the MPC advanced its scheduled meeting of June 3-5, 2020 to May 20-22, 2020. On inflation, the MPC noted that it had softened for the second successive month in March as food inflation eased from its earlier double-digit levels. However, supply disruptions punctuated the softening and food prices spiked in April. The MPC expected food prices to moderate as supply lines get restored with gradual relaxations in lockdown. Given the forecast of a normal monsoon, the likelihood of international crude oil prices remaining low in view of the global demand-supply balance and deficient demand conditions, inter alia, the MPC expected headline inflation to fall below the target in Q3 and Q4 of 2020-21. The growth outlook, on the other hand, remained sombre and various sectors of the economy were seen as experiencing acute stress. Against this backdrop, the MPC decided to reduce the policy repo rate from 4.4 per cent to 4.0 per cent even while maintaining headroom to back up the revival of activity when it takes hold. The MPC also voted to maintain accommodative stance as long as necessary to revive growth and mitigate the impact of COVID-19, while ensuring that inflation remained within the target. Five members voted for a reduction in policy repo rate by 40 bps and one member voted for a reduction of 25 bps. III.14 The MPC, since its inception, has faced a number of challenges and uncertainties, requiring it to continuously balance growth-inflation trade-offs (Box III.1). Box III.1
Voting Diary of the Monetary Policy Committee, 2016-20 From September 2016, when a six-member monetary policy committee (MPC) was constituted to determine the policy rate to achieve the inflation target, the MPC met 23 times till May 2020. While the three external MPC members have remained unchanged over this period, the internal members, being ex officio, have changed. In all, eleven different members1 have served on the MPC so far. The minutes of the MPC, including individual statements of members, suggest that voting differences were typically confined to the size of the change in the policy rate rather than contesting the overarching policy stance (Patra, 2017). This pattern remained broadly unchanged in the subsequent two years as well. Thirteen of the 23 decisions of the MPC on the repo rate have been with unanimity in terms of direction of policy rate change. Within these thirteen decisions, however, there were four decisions where the MPC differed over the quantum of interest rate cut – in two such meetings, there was one dissent vote, while in another two meetings there were two dissent votes. These reflected differences in individual members’ macroeconomic assessment and outlook, and policy preferences. A word count analysis of MPC members’ statements indicates that discussions on inflation were dominant – around 60 per cent of the MPC discussion universe – during August-October 2018. In the more recent period in March 2020, discussions on growth occupied more than 50 per cent of the MPC discussion space (Chart 1). Parsing of the voting pattern of each MPC member suggests that among external members there were greater differences over direction and quantum of policy rate change. In all the meetings, the proposal of the chairman of the MPC (Governor) was carried through to the decision (Table 1).
| Table 1: MPC Voting Pattern | | Internal/ External | MPC Member | Total Votes | Direction of Rate Change Compared to MPC Decision | Quantum of Rate Change Compared to MPC Decision | | Same | Different | Same | Lower | Higher | | 1 | 2 | 3 | 4 | 5 | 6 | 7 | 8 | | External Members | Prof. Chetan Ghate | 23 | 20 | 3 | 17 | 0 | 6 | | Prof. Pami Dua | 23 | 23 | 0 | 21 | 0 | 2 | | Prof. Ravindra H. Dholakia | 23 | 19 | 4 | 17 | 6 | 0 | | Internal Members | Dr. Urjit R. Patel | 14 | 14 | 0 | 14 | 0 | 0 | | Shri R. Gandhi | 2 | 2 | 0 | 2 | 0 | 0 | | Dr. Viral V. Acharya | 15 | 13 | 2 | 13 | 0 | 2 | | Shri Bibhu Prasad Kanungo | 3 | 3 | 0 | 3 | 0 | 0 | | Shri Shaktikanta Das | 9 | 9 | 0 | 9 | 0 | 0 | | Dr. Michael Debabrata Patra | 23 | 20 | 3 | 20 | 0 | 3 | | Dr. Janak Raj | 3 | 3 | 0 | 3 | 0 | 0 | Note: Blue highlighted names are MPC members as at end-June 2020.
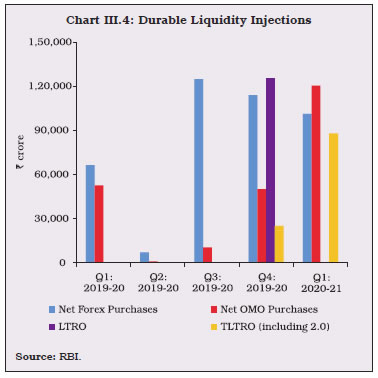
Source: Monetary policy minutes, RBI. | Reference: Patra, Michael Debabrata (2017), “One Year in the Life of India's Monetary Policy Committee”, Reserve Bank of India Bulletin, December. | The Operating Framework: Liquidity Management III.15 The operating framework of monetary policy aims at aligning the operating target – the weighted average call rate (WACR) – with the policy repo rate through proactive liquidity management, consistent with the stance of monetary policy. Amplifying reduction of 185 bps in the policy repo rate during 2019-20, the Reserve Bank undertook a number of liquidity measures, both conventional and unconventional, especially to mitigate the adverse impact of COVID-19 on the real economy. III.16 Based on the recommendations of an Internal Working Group, the Reserve Bank revised the liquidity management framework to clearly communicate the objectives and the toolkit for liquidity management. The salient features of the revised framework, operationalised on February 14, 2020, are: (i) A single 14-day term repo/reverse repo operation at a variable rate to coincide with the cash reserve ratio (CRR) maintenance cycle is the main liquidity management tool for managing frictional liquidity; (ii) The main liquidity operation will be supported by fine-tuning operations, overnight and/or longer tenor up to 13-days; longer-term variable rate repo/ reverse repo operations beyond 14 days to be conducted, as required; (iii) Daily fixed rate repo and four 14-day term repos are discontinued; (iv) Liquidity management instruments will include fixed and variable rate repo/ reverse repo auctions, outright open market operations (OMOs), forex swaps and other instruments; (v) Direct participation by standalone primary dealers (SPDs) is allowed in all overnight liquidity management operations; (vi) Margin requirements under the liquidity adjustment facility (LAF) will be periodically reviewed; (vii) Greater transparency in communication will be brought through: (a) dissemination of both the daily flow as well as the stock impact of the liquidity operations; and (b) publication of a quantitative assessment of durable liquidity conditions of the banking system with a fortnightly lag; and (viii) Certain features of the erstwhile liquidity management framework such as (a) the WACR being the operating target; and (b) minimum daily maintenance of 90 per cent of the CRR requirement were retained.2 III.17 The revised liquidity management framework envisaged a symmetric LAF corridor of 50 bps. In view of the COVID-19 pandemic and its adverse impact on global and domestic financial markets and the significant increase in the banking system liquidity, however, the Reserve Bank made the policy interest rate corridor asymmetric on March 27, 2020, with the reverse repo rate 40 bps below the policy repo rate (from 25 bps) and the MSF rate 25 bps above the repo rate, thereby widening the corridor from 50 bps to 65 bps. The reverse repo rate was cut by another 25 bps on April 17, taking it 65 bps below the repo rate and widening the corridor to 90 bps. This was done to make it relatively unattractive for banks to passively park funds with the Reserve Bank and to encourage their deployment for on-lending to productive sectors of the economy. Furthermore, taking cognisance of hardships faced by banks in terms of social distancing of staff and consequent strains on reporting requirements, the requirement of minimum daily CRR balance maintenance was reduced from 90 per cent to 80 per cent effective from the first day of the reporting fortnight beginning March 28, 2020 (as a one-time dispensation initially available up to June 26, 2020 and subsequently extended to September 25, 2020). III.18 Scheduled commercial banks (SCBs) were allowed exemption from the maintenance of CRR on incremental credit to retail (automobiles and residential housing) and micro, small and medium enterprises (MSMEs) sectors disbursed by them between January 31 to July 31, 2020 to revitalise the flow of bank credit to productive sectors having multiplier effects on growth. Drivers and Management of Liquidity III.19 During 2019-20, liquidity conditions remained in surplus mode starting from June 2019. The Reserve Bank employed multiple tools to manage both frictional and durable liquidity. While liquidity amounting to ₹1.37 lakh crore was injected through variable rate repos of maturities ranging from overnight to 16 days in addition to the regular 14-day repos, surplus liquidity of ₹284.4 lakh crore was absorbed through reverse repos of maturities ranging from overnight to 63 days during 2019-20. The Reserve Bank also injected durable liquidity of ₹1.1 lakh crore through purchase of securities under OMOs during the year. III.20 The Reserve Bank’s forex operations and drawdown of Government of India (GoI) cash balances were the main drivers of liquidity expansion, which more than offset the leakage of liquidity due to currency demand during 2019-20. The surplus liquidity was mopped up through reverse repos of varying maturities under the LAF. With capital inflows gaining momentum during the second half of the year (except in the latter half of March), forex operations largely mirrored net LAF positions (Chart III.1). 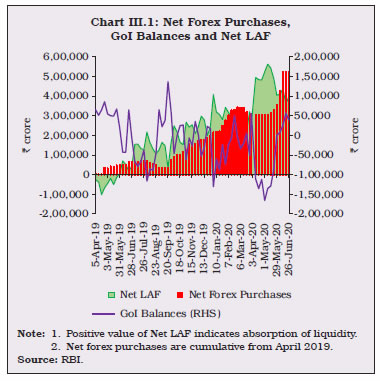 III.21 In the first two months of Q1:2019-20, i.e., April and May 2019, liquidity conditions were in deficit on account of restrained government spending on the back of the model code of conduct in the run up to the general election and high demand for cash. The Reserve Bank conducted a USD/INR buy/sell swap auction of US$ 5 billion (₹34,874 crore) for a tenor of 3 years in April and two OMO purchase auctions in May amounting to ₹25,000 crore to inject durable liquidity into the system. It also injected liquidity of ₹51,403 crore on a daily net average basis under the LAF during these two months. The situation changed in June – along with the shift in policy stance to accommodative – when liquidity conditions turned into surplus due to increased spending after the government formation at the Centre, net forex purchases by the Reserve Bank and return of currency to the banking system post-elections. The Reserve Bank also conducted two OMO purchase auctions amounting to ₹27,500 crore during the month (Chart III.2). Surplus liquidity of ₹51,710 crore (on a daily net average basis) was absorbed under the LAF in June. 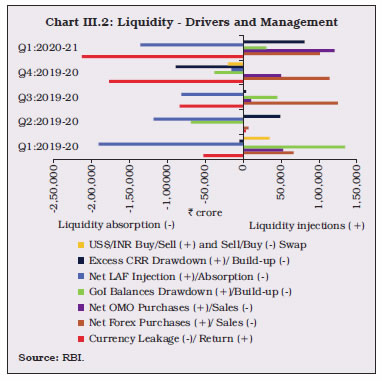 III.22 Surplus liquidity conditions built up during Q2:2019-20 mainly on account of (i) drawdown of GoI cash balances; (ii) return of currency to the banking system; and (iii) the Reserve Bank’s net forex purchase operations, especially in September 2019. The absorption of liquidity on a daily net average basis under the LAF soared to ₹1.31 lakh crore during Q2 in contrast to a net injection of ₹17,409 crore in Q1:2019-20. Simultaneously, transient liquidity needs were met through variable rate repos of smaller tenors (1-3 days) in addition to the regular 14-day term repos. III.23 With the persistence of surplus liquidity conditions, the average daily net liquidity absorption under the LAF increased to ₹2.33 lakh crore in Q3:2019-20. Expecting the continuance of surplus liquidity, the Reserve Bank conducted four longer term reverse repo auctions in November – two of 21 days and one each of 42 days and 35 days tenor – thereby absorbing ₹78,934 crore. Forex operations coupled with the drawdown of GoI cash balances increased systemic liquidity. The Reserve Bank also conducted four simultaneous purchase and sale of securities under OMOs (special OMOs) between December 23, 2019 and January 23, 2020, which augmented net banking system liquidity by ₹11,724 crore (Chart III.3).3 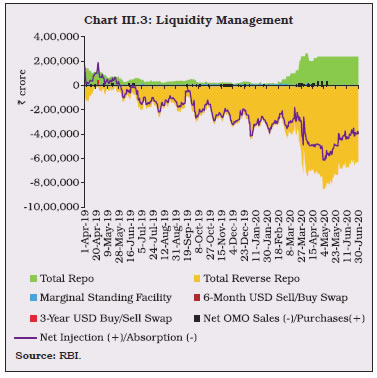 III.24 With a view to reinforcing monetary transmission and augmenting credit flows to productive sectors, the Reserve Bank conducted five LTROs at fixed repo rate (one of one year and four of three years tenors) between February 17 and March 18, 2020, providing banks with durable liquidity of ₹1.25 lakh crore at reasonable cost relative to prevailing market rates. With the government continuing to rely on ways and means advances/overdraft (WMA/OD) almost entirely during the quarter, average absorption of surplus liquidity further increased to ₹3.06 lakh crore in Q4:2019-20. Net average absorption of surplus liquidity further soared to ₹4.72 lakh crore in Q1:2020-21, reflecting several liquidity augmenting measures and sustained government spending through higher average recourse to WMA/OD (of ₹0.61 lakh crore) during this period.4 III.25 Following the declaration of COVID-19 as a pandemic by the World Health Organisation (WHO) on March 11, global financial markets were gripped by bearish sentiments. Heightened global turbulence resulted in a significant tightening of financial conditions in domestic financial markets beginning March 11, 2020. The Reserve Bank undertook several conventional and unconventional measures in March to unfreeze financial market activity and revitalise financial institutions to function normally in the face of COVID-19 related dislocations. These measures, inter alia, included: (i) two 6-month USD/INR sell/buy swap auctions on March 16 and March 23, 2020 to meet the increased demand for US dollars, which cumulatively provided dollar liquidity of US $ 2.7 billion; (ii) three OMO purchases on March 20, 24 and 26, 2020 to inject ₹40,000 crore cumulatively; (iii) announcement of TLTRO auctions of up to three years’ tenor of appropriate sizes for a total amount of up to ₹1 lakh crore on March 27, 2020 for investment in corporate bonds, commercial paper, and nonconvertible debentures;5 (iv) reduction in the CRR requirement of banks by 100 bps – from 4.0 per cent of net demand and time liabilities (NDTL) to 3.0 per cent – effective fortnight beginning March 28, 2020, for a period of one year ending March 26, 2021, augmenting primary liquidity in the banking system by about ₹1.37 lakh crore; and (v) raising banks’ limit for borrowing overnight under the MSF by dipping into their Statutory Liquidity Ratio (SLR) to 3 per cent of NDTL from 2 per cent (effective up to June 30, 2020 and subsequently extended up to September 30, 2020), allowing the banking system to avail an additional ₹1,37,000 crore of liquidity. III.26 In order to maintain adequate liquidity in the system and its constituents in the face of COVID-19 related dislocations, facilitate and incentivise bank credit flows, ease financial stress and enable the normal functioning of markets, the Reserve Bank took further liquidity injection measures on April 17, 2020 targeted at specific sectors and entities. These included: (i) TLTRO 2.0 auctions for an initial aggregate amount of ₹50,000 crore in tranches of appropriate sizes,6 with funds to be invested in investment grade bonds, commercial paper, and non-convertible debentures of non-banking financial companies (NBFCs), with at least 50 per cent of the total amount availed going to small and mid-sized NBFCs and micro finance institutions (MFIs); (ii) special refinance facilities for a total amount of ₹50,000 crore at the policy repo rate to the National Bank for Agriculture and Rural Development (NABARD), the Small Industries Development Bank of India (SIDBI) and the National Housing Bank (NHB). The inter se allocation of funds was ₹25,000 crore to NABARD for refinancing regional rural banks (RRBs), cooperative banks and MFIs; ₹15,000 crore to SIDBI for on-lending/refinancing; and ₹10,000 crore to NHB for supporting housing finance companies (HFCs). Furthermore, the Reserve Bank announced a special liquidity facility for mutual funds (SLF-MF) of ₹50,000 crore on April 27, 2020 to alleviate intensified liquidity pressures faced by them. Banks availed ₹2,430 crore under this facility. In order to enable Export-Import Bank of India (EXIM Bank) to meet its foreign currency resource requirements, the Reserve Bank extended a line of credit of ₹15,000 crore to the EXIM Bank on May 22, 2020 for a period of 90 days (with rollover up to one year) so as to enable it to avail a US dollar swap facility. III.27 Following the monetary and liquidity measures announced on March 27, April 17 and May 22, 2020, financial conditions eased as reflected in the variation in spreads on money and bond market instruments (Table III.1). Corporate bond market activity revived, with several corporates making new issuances. III.28 Overall, the Reserve Bank’s various operations (including forex purchases, OMOs, LTROs and TLTROs) injected durable liquidity of ₹5.76 lakh crore in 2019-20 and ₹3.09 lakh crore in Q1:2020-21 (Chart III.4). III.29 Given surplus liquidity conditions, fine-tuning operations through variable rate reverse repo auctions with maturities ranging from overnight to 3 days were extensively used for absorbing liquidity till February 14, 2020. As a pre-emptive measure to tide over any frictional liquidity requirements caused by dislocations due to COVID-19, three fine-tuning variable rate repo auctions of 12-16 days maturity were conducted on March 23, March 24, and March 26, 2020, injecting ₹89,517 crore (Table III.2).7 As a special case, SPDs were allowed to participate in these auctions along with other eligible participants. Furthermore, the Reserve Bank temporarily enhanced liquidity available to SPDs under the Standing Liquidity Facility (SLF) from ₹2,800 crore to ₹10,000 crore in order to facilitate their year-end liquidity management. | Table III.1: Variation in Spread of Financial Market Instruments over Policy Repo Rate | | (Basis points) | | Period | CP-3 Month | CD-3 Month | AAA Corporate Bond | | 1-Year | 3-Year | 5-Year | | 1 | 2 | 3 | 4 | 5 | 6 | | (i) March 10 - 26, 2020 | 128 | 272 | 45 | 55 | 68 | | (ii) March 26 - April 16, 2020 | 106 | -255 | 85 | 82 | 82 | | (iii) April 16 - May 21, 2020 | -165 | -118 | -61 | -67 | -83 | | (iv) May 21 - June 30, 2020 | -133 | 16 | -50 | -18 | 12 | | (v) Change (ii-i) | -22 | -527 | 40 | 27 | 14 | | (vi) Change (iii-ii) | -271 | 137 | -146 | -150 | -165 | | (vii) Change (iv-iii) | 32 | 134 | 11 | 49 | 95 | | Source: RBI, FBIL, Bloomberg and RBI staff estimates. |
| Table III.2: Fine-tuning Operations through Variable Rate Auctions during 2019-20 | | Maturity in Days | Frequency
(number of operations) | Total Volume
(₹ crore) | Average Volume
(₹ crore) | | 1 | 2 | 3 | 4 | | Repo | | | | | 1-3 | 4 | 47,128 | 11,782 | | 12 | 1 | 11,772 | 11,772 | | 16 | 2 | 77,745 | 38,873 | | Reverse Repo | | | | | 1-3 | 222 | 2,71,84,097 | 1,22,451 | | 4 | 6 | 6,11,686 | 1,01,948 | | 7 | 33 | 4,31,458 | 13,074 | | 14 | 1 | 550 | 550 | | 21 | 2 | 28,923 | 14,462 | | 28 | 2 | 35,665 | 17,833 | | 29 | 1 | 11,500 | 11,500 | | 31 | 1 | 12,790 | 12,790 | | 35 | 1 | 25,004 | 25,004 | | 42 | 2 | 30,507 | 15,254 | | 63 | 4 | 65,833 | 16,458 | | Source: RBI. | Operating Target and Policy Rate III.30 During 2019-20, the WACR – the operating target – remained within the corridor with a downward bias (9 bps below the repo rate on an average basis), reflecting sustained surplus liquidity (Chart III.5). The WACR spiked in the typical financial year-end phenomenon, accentuated by reduced market participation because of the COVID-19 induced nation-wide lockdown. With the LAF corridor becoming asymmetric and with the persistence of surplus liquidity, the WACR continued to trade below the repo rate in Q1:2020-21. Monetary Policy Transmission III.31 Monetary transmission – changes in banks’ deposit and lending rates in response to the changes in the policy repo rate – improved during 2019-20, especially in the second half of the year (Table III.3). This was catalysed by the mandated linking of the interest rates on new loans to certain sectors such as personal and MSE loans, effective October 2019, to an external benchmark, viz., the policy repo rate, 3-month, 6-month T-bill rates or any other benchmark published by Financial Benchmark India Pvt. Ltd. (FBIL).8 | Table III.3: Transmission to Deposit and Lending Interest Rates | | (Basis points) | | Period | Repo Rate | Term Deposit Rates | Lending Rates | | Median Term Deposit Rate | WADTDR | 1 - Year Median MCLR | WALR - Outstanding Rupee Loans | WALR - Fresh Rupee Loans | | 1 | 2 | 3 | 4 | 5 | 6 | 7 | | April 2018 to March 2019 | 25 | 5 | 22 | 45 | 0 | 39 | | April 2019 to March 2020 | -185 | -49 | -51 | -60 | -25 | -91 | | Tightening Phase: | | June 2018 to January 2019 | 50 | 0 | 20 | 35 | 2 | 57 | | Easing Phase: | | February 2019 to September 2019 | -110 | -9 | -7 | -30 | 2 | -40 | | October 2019 to June 2020 | -140 | -124 | -84 | -80 | -55 | -122 | | February 2019 to June 2020 | -250 | -147 | -91 | -105 | -53 | -162 | WADTDR: Weighted Average Domestic Term Deposit Rate. WALR: Weighted Average Lending Rate.
MCLR: Marginal Cost of Funds based Lending Rate.
Source: Special Monthly Return VIAB, RBI and banks’ websites. | III.32 During the easing cycle since February 2019, transmission has been faster in respect of fresh rupee loans sanctioned by private sector banks vis-à-vis public sector banks. This was similar to the experience during the tightening cycle of June 2018-January 2019 when the transmission was quicker for private sector banks (Chart III.6). III.33 The weighted average lending rate (WALR) on fresh rupee loans of private sector banks is usually higher than that of public sector banks, reflecting higher cost of funds and, hence, higher marginal cost of funds-based lending rate (MCLR) as also the higher median spread9 (Chart III.7). The share of loans to sectors such as agriculture, MSME, vehicle and credit card in total loans sanctioned by private sector banks was higher than that of public sector banks for the month of June 2020. The sectoral WALRs in respect of fresh rupee loans to these sectors were also higher than the respective WALRs of public sector banks. Sectoral Lending Rates III.34 Monetary transmission remained uneven across sectors due to idiosyncratic features. During the current easing cycle so far (February 2019-June 2020), interest rates on outstanding loans declined for majority of the sectors, including agriculture, industry (large), infrastructure, trade, housing and education (Table III.4). Table III.4: Sector-wise WALR of SCBs (Excluding RRBs) - Outstanding Rupee Loans
(at which 60 per cent or more business is contracted) | | (Per cent) | | End-Month | Agriculture | Industry (Large) | MSMEs | Infrastructure | Trade | Professional Services | Personal Loans | Rupee Export Credit | | Housing | Vehicle | Education | Credit Card | Other$ | | 1 | 2 | 3 | 4 | 5 | 6 | 7 | 8 | 9 | 10 | 11 | 12 | 13 | | Dec-18 | 10.69 | 10.70 | 11.23 | 10.90 | 10.97 | 10.65 | 9.48 | 10.64 | 11.36 | 38.74 | 11.56 | 10.04 | | Jan-19 | 10.70 | 10.57 | 11.02 | 10.98 | 10.59 | 10.59 | 9.54 | 10.60 | 11.40 | 37.97 | 11.59 | 9.92 | | Mar-19 | 10.56 | 10.41 | 11.42 | 10.70 | 10.86 | 10.72 | 9.41 | 10.48 | 11.35 | 38.91 | 12.20 | 9.51 | | Jun-19 | 10.48 | 10.20 | 11.26 | 10.68 | 9.98 | 10.42 | 9.44 | 10.45 | 11.34 | 38.63 | 12.39 | 9.73 | | Sep-19 | 10.58 | 10.28 | 10.94 | 10.49 | 9.84 | 10.37 | 9.46 | 10.57 | 11.14 | 38.61 | 12.56 | 9.78 | | Dec-19 | 10.39 | 10.03 | 10.91 | 10.22 | 10.17 | 10.43 | 9.30 | 10.70 | 11.03 | 38.39 | 12.16 | 9.01 | | Mar-20 | 10.56 | 9.66 | 11.29 | 10.05 | 9.75 | 10.24 | 9.15 | 10.57 | 10.78 | 37.90 | 12.37 | 8.94 | | June-20 | 10.40 | 9.53 | 10.84 | 9.62 | 9.35 | 10.17 | 8.94 | 10.53 | 10.47 | 38.35 | 12.35 | 8.62 | | Variation (Percentage Points) | | 2019-20 | 0.00 | -0.75 | -0.13 | -0.65 | -1.11 | -0.48 | -0.26 | 0.09 | -0.57 | -1.01 | 0.17 | -0.57 | | Easing Phase | | Feb-19 – Sep-19 | -0.12 | -0.29 | -0.08 | -0.49 | -0.75 | -0.22 | -0.08 | -0.03 | -0.26 | 0.64 | 0.97 | -0.14 | | Oct-19 – June 20 | -0.18 | -0.75 | -0.10 | -0.87 | -0.49 | -0.20 | -0.52 | -0.04 | -0.67 | -0.26 | -0.21 | -1.16 | | Feb-19 – June 20 | -0.30 | -1.04 | -0.18 | -1.36 | -1.24 | -0.42 | -0.60 | -0.07 | -0.93 | 0.38 | 0.76 | -1.30 | $: Other than housing, vehicle, education and credit card loans.
Source: Special Monthly Return VIAB, RBI. | External Benchmark III.35 Following the introduction of the external benchmark-based system of the pricing of loans as mentioned earlier, 36 out of 66 banks adopted the policy repo rate as the external benchmark for floating rate loans to the retail and MSME sectors (Table III.5). Seven banks have adopted sector-specific benchmarks. III.36 The median spread in respect of fresh rupee loans linked to the policy repo rate (i.e., median WALR over the repo rate) was the highest for other personal loans (Table III.6). Among the domestic bank-groups, private sector banks typically charged a higher spread vis-à-vis public sector banks. III.37 The transmission to fresh rupee loans sanctioned has been better in respect of sectors, such as housing, other personal loans and MSME loans, where new floating rate loans have been linked to an external benchmark. During October 2019-June 2020, the WALRs of domestic (public and private sector) banks declined in respect of fresh rupee loans sanctioned for housing loans by 104 bps, vehicle loans by 102 bps, other personal loans by 115 bps and MSME loans by 198 bps (Chart III.8). | Table III.5: External Benchmarks of Commercial Banks - June 2020 | | Bank Group | Policy Repo | CD Rate | MIBOR | 3-Month T-Bill Rate | Sector- specific Benchmark | | 1 | 2 | 3 | 4 | 5 | 6 | | Public Sector Banks (11) | 11 | - | - | - | - | | Private Banks (21) | 18 | 1 | - | - | 2 | | Foreign Banks (34)@ | 7 | - | 2 | 7 | 5 | | Commercial banks (66)@ | 36 | 1 | 2 | 7 | 7 | @: 13 foreign banks did not have any exposure to retail loans and MSME loans segments.
Note: Figures in parentheses refer to the number of banks that submitted their return.
Source: RBI. |
| Table III.6: Loans Linked to the Policy Repo Rate - Median Spread (June 2020) | | (Percentage points) | | Bank Group | Personal Loans | Loans to MSME | | Housing | Vehicle | Education | Other Personal Loans | | 1 | 2 | 3 | 4 | 5 | 6 | | Public Sector Banks | 3.3 | 4.6 | 4.2 | 6.7 | 5.8 | | Private Sector Banks | 5.0 | 6.7 | 7.0 | 6.7 | 7.0 | | Domestic Banks | 4.3 | 4.8 | 4.8 | 6.7 | 6.3 | | Source: RBI. | III.38 A number of studies were undertaken during 2019-20 to strengthen the analytical inputs for the conduct of monetary policy and liquidity management. They included: refining the methodology of forecasting currency in circulation (a major item of leakage of liquidity from the banking system) at various frequencies for better liquidity assessment; nowcasting food inflation with high frequency data; spatial dimensions of food inflation with special focus on transmission of vegetable price shocks; impact of asset quality of banks on monetary transmission through credit channel; behaviour of credit cycles; updated estimates of exchange rate pass through (ERPT), with a focus on asymmetry and non-linearity; an assessment of inflation forecasts; inflation forecast combination approaches for projections; transmission of international food price inflation to domestic inflation; drivers of private savings; and impediments to monetary policy transmission. 3. Agenda for 2020-21 III.39 Against the backdrop of COVID-19 pandemic induced volatility in domestic financial markets and the output losses, the Department would undertake the following: -
Strengthening nowcasting of inflation with wider information system, including commodity price monitoring (Utkarsh); -
Augmenting the external sector block of the quarterly projection model (QPM) by incorporating capital inflows dynamics for an improved analysis of the external spillovers and feedback mechanisms and recalibration of the QPM based on recent empirical estimates (Utkarsh); -
Analysis of MPC voting pattern (Utkarsh); -
An assessment of the efficacy of the conventional (OMO) and the unconventional (LTRO and TLTRO) monetary policy instruments; and - Dynamics of banks’ holdings of government securities and credit growth to assess the relative roles of crowding-out and portfolio re-balancing.
4. Conclusion III.40 In sum, the COVID-19 pandemic continues to have unprecedented adverse impact on output in India as in other countries. Sizeable monetary policy and liquidity measures since February 2020 have been taken to address growth and liquidity concerns. On the inflation front, going forward, a more favourable food inflation outlook may emerge from the bumper rabi harvest, moderate increases in minimum support prices for kharif crops and prospects of normal south-west monsoon, while upside pressure in food may emanate from tight demand-supply balance in the case of pulses and weather related supply disruptions in the case of key vegetables. High taxes on petroleum products, rise in telecom charges and volatility in financial markets pose upside risks to non-food inflation. Overall, headline inflation may remain elevated in Q2:2020-21 but may moderate during H2:2020-21 aided by large favourable base effects. With significant downside risks to domestic growth remaining, monetary policy would continue, as the MPC has reiterated, to maintain accommodative stance as long as necessary to revive growth and mitigate the impact of COVID-19 on the economy, while ensuring that inflation remains within the target going forward. The Reserve Bank would continue to conduct liquidity operations to maintain adequate liquidity in the system to ensure conducive financial conditions and normalcy in the functioning of financial markets and institutions. The mandated linking of interest rates on new floating rate loans to external benchmark in respect of personal and MSME loans is leading to faster monetary transmission, although it remains uneven across sectors. The Reserve Bank would persevere with its initiatives to further improve monetary transmission.
|