Sakshi Awasthy, Rekha Misra and Sarat Dhal* Received on: October 11, 2022
Accepted on: June 23, 2023 While the digital payments ecosystem in India has taken off, the demand for currency persists - a trend accentuated by the pandemic. The simultaneous increase in digital payments and currency in circulation might appear paradoxical, which warrants an analysis of the various motives for holding cash. Using descriptive analysis and empirical insights, this paper finds that the sustained growth in currency demand is influenced by the precautionary and store-of-value motives, while the use of cash as a payment medium continues to fall. This is indicative of the growing substitution of cash by digital payments for transactional purposes. Although income remains the dominant driver of currency demand in India, the rapid growth momentum in digital payments, combined with its statistically significant inverse association with cash, has the potential to moderate the positive income effect. JEL Classification: E41, E42, E47, Q55, C22, C58 Keywords: Money demand, currency in circulation, payment systems, payment paradox, ARDL model, monetary policy. Introduction India’s payments ecosystem has undergone a transformative revolution in the last two decades. The pandemic-induced conditions further bolstered the adoption of digital payments (Das, 2021). Reflecting the success of the policy thrust of the Reserve Bank of India (RBI) and the Government, digital retail payments, led by the Unified Payments Interface (UPI), have grown rapidly between 2016-17 and 2022-23 with a compounded annual growth rate (CAGR) of 51 per cent and 27 per cent in volume and value terms, respectively. Despite the surge in digital payments, the growth in currency in circulation (CiC) continues with the CiC-to-GDP ratio peaking at 14.4 per cent in 2020-21. Owing to the perceived substitutability between digital payments and cash, the simultaneous growth in both seems counterintuitive, giving rise to a ‘currency demand’ paradox that necessitates a detailed analysis of the underlying drivers of different payment modes. Decoding this conundrum could be useful for policy purposes in various ways. First, as the sole issuers of currency, central banks are required to project currency demand to determine the appropriate supply of banknotes, considering technological innovations in payments. Second, as currency constitutes a significant driver of system-wide liquidity, shifts in its demand pattern can have implications for liquidity management operations and monetary policy implementation. Third, the degree of substitution between cash and digital modes can guide appropriate retail payment strategies and enable the assessment of the efficacy of digital payment initiatives. Against this backdrop, this paper attempts to demystify the paradox by unravelling the reasons behind the unusually high cash demand witnessed during the COVID-19 pandemic, while examining the various motives behind cash usage in India. We present several stylised facts to substantiate our analytical perspectives. Employing an autoregressive distributed lag model, we estimate currency demand as a function of its proximate drivers, such as income, interest rate, digital payments, and precautionary variables, viz., uncertainty and credit-to-deposit ratio. Our findings suggest that the transactional use of cash is showing signs of decline, while the ‘precautionary’ and ‘store-of-value’ motives significantly influence the demand for CiC. Illustratively, this is evident from the growing share of large-denomination banknotes contrasted with muted growth in small-value notes and coins; subdued cash withdrawals; diminishing cash velocity and a shift towards digital modes for effecting small-value retail transactions. Further, we posit that the CiC-to-GDP ratio in recent past may not be an appropriate indicator to gauge efficacy of ongoing digital initiatives due to possible overestimation, driven by a sharp fall in the denominator (GDP) combined with uncertainty-fueled uptick in the numerator (CiC) during the pandemic. Factors like the falling interest rates on deposits (or the opportunity cost of holding currency), growing informalisation of workforce, and the larger-than-normal direct benefit transfer (DBT)-based cash transfers during the pandemic may have contributed to the increased preference for cash. Further, the surplus precautionary financial savings in cash reflected partly the lack of opportunities to spend during the pandemic and partly the need to deal with the uncertain outlook for income and employment, as the economy was normalising from the pandemic shock. Empirical insights from the augmented money demand function reveal the statistically significant impact of income and precautionary variables on cash demand. Digital payments are inversely associated with currency use, although the negative and statistically significant substitution effect between cash and digital modes is outweighed by the combination of positive income and precautionary effects. While this suggests the potential of both cash and digital payments to rise in a growing economy like India due to increased transactional activity, it also underscores the significance of precautionary variables in determining cash demand. Overall, however, the ongoing rapid growth momentum in digital payments has the potential to moderate the positive income effect on currency demand. The remaining part of the paper is presented in eight sections. Section II briefly encapsulates the related literature. Section III explores the trends in CiC and digital payments, followed by a cross-country evaluation in Section IV. Section V decodes the payments conundrum by undertaking an incisive examination of the reasons behind the higher-than-usual CiC-to-GDP ratio witnessed during the pandemic and disentangles the transactional component in total CiC. Section VI discusses the data and the autoregressive distributed lag (ARDL) methodology. Empirical findings are enumerated in Section VII, followed by concluding observations in Section VIII. Section II
Insights from Literature There is sizeable theoretical and empirical literature on money demand and its various determinants (Friedman, 1999; Alvarez and Lippi, 2009). The purpose of holding cash can be distinguished into three main motives: the transactional motive that is mainly driven by economic activity, as introduced traditionally by the Quantity Theory of Money (Fisher, 1911), followed by the precautionary and the speculative motives postulated by Keynes (1954). The seminal inventory (Baumol, 1952) and portfolio (Tobin, 1956) theoretical models further extend the money demand function by incorporating the roles of interest rates and transaction costs in influencing the demand for cash. In addition to the traditional drivers of cash demand, such as economic activity and interest rates, payment innovations through digital modes can also shift demand for money by substituting cash (Columba, 2009; Lippi and Secchi, 2009; Oyelami and Yinusa, 2013, and Huynh et al., 2014). However, there is no clear consensus on the nature of the relationship between advanced payment options and currency use, with some studies indicating a muted impact as well (Drehmann et al., 2002 and Chen et al., 2017). In the Indian context, studies show a significant negative effect of digital modes on currency demand (Chaudhari et al., 2019 and Raj et al., 2019). The magnitude of the impact of digitalisation may depend on the denomination of the underlying currency, as examined in detail by researchers. Digital modes are expected to substitute low-value banknotes and coins given their higher propensity to facilitate transaction needs (Amromin and Chakravorti, 2009). Alternatively, as large-denomination notes are used for conducting high-value transactions, digital modes are more likely to replace these notes owing to enhanced safety and convenience (Arango-Arango and Suárez-Ariza, 2020). A pre-COVID survey of retail payment habits in India has shown cash to be the preferred form of payment, especially for transacting smaller value payments (up to ₹500), while a transition is underway in payment preferences to digital modes for transactions of higher amounts (Bhuyan et al., 2021). Most studies investigating the parallel rise in digital payments and cash are focused on advanced economies. Their common explanation is that the growing circulation of cash is driven by precautionary tendencies and a trend decline in opportunity costs rather than its use as a payment medium (Boeschoten, 2012; Bech et al., 2018; Zamora-Perez, 2021; and Rogoff, 2021). The persistence in cash usage also stems from its ability to serve as a safety cushion in case of disruptions in existing electronic payment systems (Scholten, 2017) and heightened uncertainty (Jobst and Stix, 2017). The evidence pertaining to the impact of increased uncertainty on cash balances is, however, mixed. While there is a growing evidence of an increased migration to digital modes during COVID-19 (Jonker et al., 2020; Wisniewski et al., 2021), cash demand may have also simultaneously peaked owing to the fear of logjams in the cash distribution system and uncertainty regarding the future (Ardizzi et al., 2020). In India, the pandemic-induced lockdown led to an ‘inflection point’ in digital adoption with onboarding of new users and return of users who had abandoned these modes in the past (Saroy et al., 2022). Overall, there are a few studies that examine the conundrum of simultaneous increase in cash and digital payments in the context of emerging economies like India (Tagat and Trivedi, 2020)1. This study aims to fill this gap in the literature. Section III
Trends in Banknote Circulation and Digital Payments III.1. Currency in Circulation Currency in Circulation (CiC), defined as the sum of notes, rupee coins and small coins, is typically taken as a proxy for cash-based economic and financial transactions due to their anonymity and lack of traceability. In India, CiC data show interesting trends (Chart 1 (a)). A significant break in this series was observed during 2016-17 induced by the withdrawal of specified bank notes (SBN) of denominations ₹500 and ₹1000. The subsequent remonetisation led to high CiC growth (37 per cent y-o-y in 2017-18) before moderating to 17 per cent in the following year. 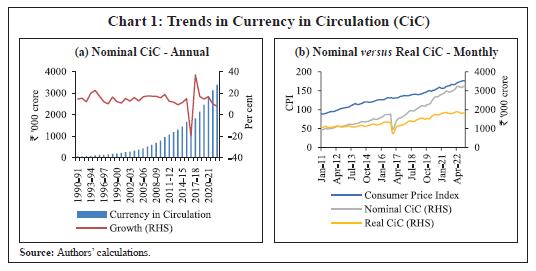 The nationwide lockdown during COVID-19 had a significant impact on cash demand that exceeded its trend growth in the weeks following the relaxation of the mobility guidelines from July 2020 (Chart 2). In 2020-21, CiC grew by 16.6 per cent as compared to the average annual growth rate of 12.7 per cent over the previous decade (2010-11 to 2019-20). The following year witnessed an expansion in CiC, albeit at the slowest pace in nearly four decades (9.8 per cent). As a result, CiC as a percent of GDP moderated from the high of 14.4 per cent in 2020-21 to 13.2 per cent in 2021-22. Overall, the decadal average growth rates in CiC have been moving southwards since the turn of the new millennium. The real CiC, i.e., CiC deflated by the consumer price index (CPI) has also shown an increase over time, but at a slower pace owing to an increase in price levels (Chart 1 (b)). 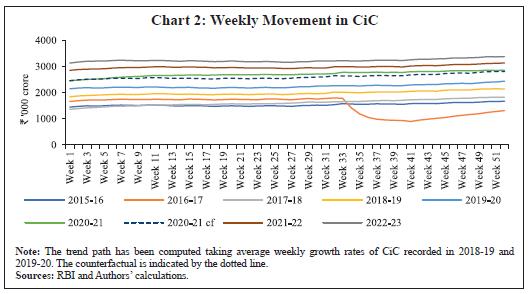 A month-wise analysis shows that nominal CiC recorded a y-o-y growth of 10 per cent or below since August 2021, averaging to 8.4 per cent up till June 9, 2023. This may partially suggest the impact of heightened base effect and the reversal of the expansion observed in currency during the pandemic. To ascertain whether these declining trends are embedded into the long-run trend path, we obtain the trend growth rate using the Hodrick Prescott (HP) filter. Specifically, we adopt the Ravn Uhlig frequency method since this technique is the most suited for data series with shorter cycles and for isolating cyclicality in annual frequency data (Ravn and Uhlig, 2002). The movements observed in the trend growth path mirror important episodes in Indian history (Chart 3). The period from 1969 to 1980 showed a significant hike in CiC from 8.4 per cent to 14 per cent. This can be attributed to policy measures like nationalisation of banks and expansion in bank branches observed during the period. The next jump came during the 1986 to 1995 phase owing to inflationary pressures, building up of the balance of payments crisis and the subsequent structural reforms. This phase (excluding the transition years of 1991 to 1993) was characterised by relatively high inflation and high nominal GDP growth. This was followed by a decline in CiC growth as the focus shifted to price stability through significant monetary contraction (1996 to 2001). As a result of the first- and second-generation reforms in India, the economic revival witnessed during 2001-2009 led to another spurt in CiC. 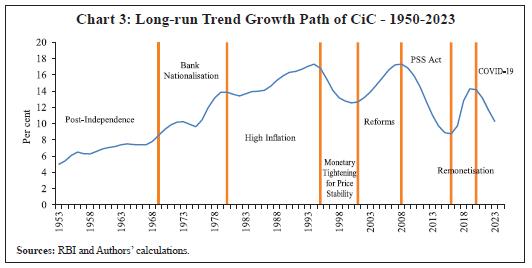 With the implementation of the Payment and Settlement Systems (PSS) Act in 2008, which paved the way for development of alternative modes of payments, the CiC trend growth nearly halved from 16.9 per cent (2007-08) to 9.5 per cent in 2015-16. Other key government initiatives related to the Jan Dhan-Aadhaar-Mobile (JAM) trinity, combined with measures under the Digital India scheme, further catalysed the shift towards digital means. All these developments possibly led to a level shift in currency usage as the next peak in 2020 (15.3 per cent) was lower than the pre-PSS Act peak in 2008 (16.9 per cent). The next upsurge in CiC from 2016 to 2021 could have been a confluence of two factors: remonetisation of the economy and the COVID-induced uncertainties. Post-2021, the long-term growth momentum in CiC has shown signs of tapering. Overall, both the peaks and troughs are coming down gradually with time. Demand deposits serve as the basis for digital payments. Ceteris paribus, a higher currency-to-demand deposits ratio indicates preference for currency over digital modes, and a lower ratio would indicate the reverse. The monthly currency-to-demand deposits ratio was at its lowest during 2005-2010 as a result of branch expansion coupled with higher interest on deposits (Chart 4). Following the rising trend between 2010 and 2014, the ratio showed a decline after 2014 owing to the opening of accounts as part of the Pradhan Mantri Jan-Dhan Yojana (PMJDY). The ratio exhibited a downward trend during the pandemic, notwithstanding a modest increase following the remonetisation in 2017. III.2. Trends in Digital Payments Propelled by policy measures and changing payment habits, the digital payment ecosystem has expanded phenomenally in recent years. India’s share in global real-time digital payments rose by 6 percentage points to reach the highest at 46 per cent in 2022 from 40 per cent a year ago (ACI Worldwide and Global Data, 2023). The pandemic reduced human contact and led people to adopt the contactless, safe and convenient modes of payments. Consequently, digital payments grew by 64 per cent and 23 per cent in volume and value terms, respectively, in 2021-22. In 2022-23, the corresponding growth rates were 58 per cent and 19 per cent, respectively. In keeping with the increasing demand for digital transactions, the underlying payment infrastructure too expanded, resulting in an increased number and density of point of sale (PoS) terminals and quick response (QR) codes. Interestingly, the pandemic-induced digital adoption continues to rise. This shift has been largely driven by growing digital awareness, deepening access to smartphones and debit cards, and directed welfare transfers during the pandemic (Saroy et al., 2022). Evidently, substitution of CiC with digital payments is underway in the recent period (Chart 5). 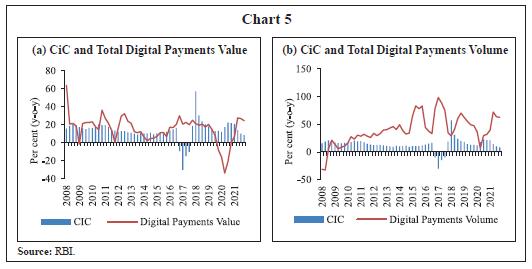 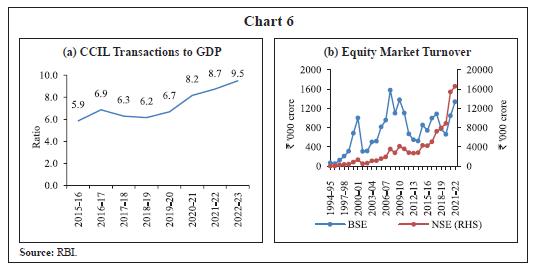 The secular decline in the traditional paper-based clearing in recent years also bears out the growing shift towards the digital modes (Annex 1: Chart 1)2. The settlements through the Clearing Corporation of India Limited (CCIL)-operated systems, viz., government securities clearing, forex clearing, and rupee derivatives have all seen a rise since 2018-19. Notably, these transactions witnessed a sharp uptick during the pandemic period (Chart 6 (a)). There has also been an increased interest by retail investors in the equity markets in digital brokerages since the outbreak of the pandemic resulting in high turnovers in the equity markets (Chart 6 (b)). This increased activity in the equity market could have in turn given a boost to UPI and card transactions since these are the preferred mode of payment to load money into trading accounts. Section IV
A Cross-Country Comparison of the Use of Currency and Digital Payments India is not the only country showing an increased growth in digital payments alongside currency. Among developed countries, currency usage experienced a long trend decline after the Second World War, followed by a stasis before rising gradually during the 1990s (Ashworth and Goodhart, 2020). According to the Bank for International Settlements (BIS) Red Book Statistics, the simultaneous increase in CiC and card payments has been observed since 2007 for most countries. In fact, the increase in CiC even as the transactional use of cash ebbs is famously known as the “paradox of banknotes” (Bailey, 2009). The literature associates the persistent desire to use cash with precautionary motives more than simple transactional needs (Caswell et al. (2020) for a study of the Euro area; Chen et al. (2020) for Canada; and Bech et al. (2018) for a study of a group of countries). Sweden, being the bellwether of digital payments, is the only country bucking this trend and showing a secular decline in CiC as digital payments attain near-ubiquity. Following the outbreak of the pandemic, although cashless payments gained momentum, the CiC-to-GDP ratio remained high for many countries in 2020 (Chart 7 (a)). The circulation of large-denomination notes, which are typically used for precautionary purposes, grew more strongly than other notes and coins in 2020 for most countries (BIS, 2021). In 2020, CiC increased, on an average, by 15 per cent in eight advanced economies, as compared to the growth of 12 per cent for 11 emerging market economies (EMEs) in 2020.3 Importantly, the CiC-to-GDP ratio increased by about 12 per cent for these advanced economies in 2020, while the corresponding increase was much higher, at 17 per cent, for the EMEs covered by the study (BIS, 2021). 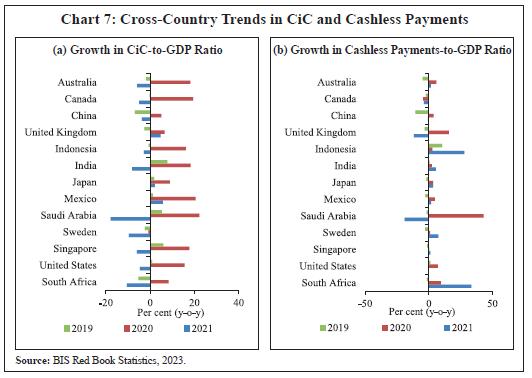 Interestingly, in 2020, the number of cash withdrawals in most countries fell owing to the restrictions on mobility, placing limits on consumption. As the decline in the number of withdrawals outpaced the moderation in their value, the withdrawal size grew during the first wave of the pandemic for most countries. Simultaneously, the average value of cashless payments declined significantly, indicating a shift in favour of digital modes for meeting small-value transactional needs (BIS, 2021). In per capita terms, cross-country differences ranged from 50 annual withdrawals in Indonesia and Saudi Arabia to the lowest of five in India. The high growth in CiC coupled with a noticeable shift towards digital payments suggests weak transactional use of cash. In 2021, there was a fall in the growth of CiC-to-GDP ratio for most countries owing to the high base and the normalisation of cash demand as the pandemic abated. Concurrently, however, cashless payments have maintained a strong growth momentum in many EMEs, including India (Chart 7 (b)). Section V
Decoding the Currency Demand Paradox V.1. Overestimation of CiC-to-GDP ratio A perfunctory analysis of data may imply that the pandemic led to a discernible uptick in currency demand. However, a deep dive into the data reveals that this could be an upshot of heightened demand for non-transactional purposes given the tendency of public to hold more cash during periods of uncertainty. Owing to contraction in the base (nominal GDP) and uncertainty-induced extraordinary surge in currency demand, the CiC-to-GDP metric may not be an appropriate measure to evaluate the effectiveness of the ongoing digital drive. Illustratively, the data indicates an overestimation of the CiC-to-GDP ratio. To gauge the pandemic’s impact on CiC and GDP, we construct simple counterfactuals of 2020-21 and 2021-22 figures, estimating the values that these variables would have taken if the exogenous shock of the pandemic had not occurred. A back-of-the-envelope calculation shows that if CiC had grown at a compounded annual growth rate (CAGR) of 9.5 per cent (calculated from 2011-12 to 2019-20), a positive gap would have emerged between the actual and ‘without COVID’ CiC values of ₹1.75 lakh crore and ₹2 lakh crore in 2020-21 (first wave) and 2021-22 (second wave), respectively (Chart 8 (a)). Constructing similar projections for nominal GDP (at the CAGR of 11 per cent) shows an expected decline owing to disruptions in economic activity; a negative output gap of ₹25 lakh crore and ₹10 lakh crore emerges for GDP in 2020-21 and 2021-22, respectively (Chart 8 (b)). Following these ‘without COVID’ figures, the ratio would have been 12 per cent in 2020-21 and 11.8 per cent in 2021-22 relative to the actual ratios of 14.4 per cent and 13.2 per cent, respectively (Chart 8 (c)). V.2. Decomposition of Cash Demand Motives Cash has many purposes. Disentangling these roles, however, is fraught with many methodological issues. For instance, a ₹500 bank note in a wallet may be serving the dual purpose of a means of payment and a temporary store-of-value. Moreover, not all large-denomination notes are essentially held for hoarding purposes; some people may also be storing cash for genuine reasons. Most studies use either micro-surveys or payment diaries to estimate the transactional cash demand. The next piece of the payment puzzle, thus, seeks to isolate the transactional and precautionary components of cash usage. Based on existing literature, we analyse the trends in notes of various denominations and ATM withdrawals to capture the retail use of cash (Guttman et al., 2021). V.2.1. Trends in Currency Denomination The use of large denomination notes is often associated with precautionary motive since they are deemed easier to store (Zamora-Perez, 2021) and ensure anonymity in payments (Drehmann et al., 2002). Given that change (or balance) is given only in case of cash transactions, variations in the stock of low denomination notes and coins can reflect cash usage for retail spending (Amromin and Chakravorti, 2009). V.2.1. Trends in Currency Denomination The use of large denomination notes is often associated with precautionary motive since they are deemed easier to store (Zamora-Perez, 2021) and ensure anonymity in payments (Drehmann et al., 2002). Given that change (or balance) is given only in case of cash transactions, variations in the stock of low denomination notes and coins can reflect cash usage for retail spending (Amromin and Chakravorti, 2009). A denomination-wise analysis of the CiC reveals that the strong growth observed in the total CiC in India in recent years is largely driven by the demand for higher denomination notes namely ₹200, ₹500, ₹10004 and ₹20005 banknotes. Owing to the withdrawal of SBN from circulation (₹500 and ₹1000 banknotes) during 2016-17, there was a sharp drop in their growth rates in 2016-17 accompanied by a surge in lower-denomination counterparts. An analysis of variations in weekly data shows that it took 1.25 years for remonetisation. Subsequently, while the value of the low-denomination notes has remained largely unchanged, the circulation of large-value notes has increased, especially during the pandemic with a growth of 19.4 per cent in 2020-21 and 11.3 per cent in 2021-22 (Chart 9). The sum of the weekly change in CiC from April 2018 to March 2022 can be a proxy for transactional cash usage. Scaling the total sum obtained to the CiC outstanding as at end-March 2022, we find that 42 per cent of the change in CiC could be attributed to the transactional motive. 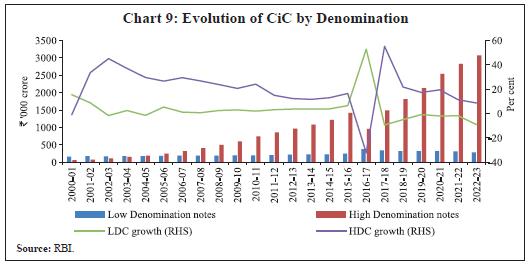 Furthermore, there was an increase in the share of high denomination notes (by number) in the total notes in circulation from an average of 21 per cent in 2010-16 to 33.1 per cent in 2020-21, 36.5 per cent in 2021-22 and 44 per cent in 2022-23 (Chart 10 (a)). In value terms, large denomination notes accounted for a share of 90 per cent, a rise of 8 percentage points from the 2010-16 average (Chart 10 (b)). This growth in the circulation of ₹500 denomination banknotes can be ascribed to a combination of factors – buildup of larger-than-normal cash buffers as a safety measure for pandemic-induced uncertainties; withdrawal of ₹1000 note from circulation; moderation in the circulation of the highest denomination of ₹2000 banknotes (RBI, 2021); and a tendency of banks to dispense higher denomination notes through ATMs given the operating cost advantage. 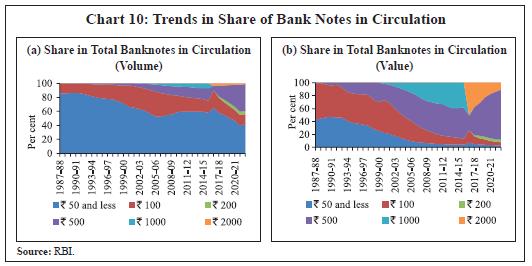 Meanwhile, the share of small denomination notes has been on a decline. This has been in part due to the substitution of small-value cash payments by the UPI; the share of UPI payments in total volume of retail payments increased to 73 per cent in 2022-23 from 63 per cent a year ago. The average per transaction value for person-to-merchant (P2M) transactions through UPI stood at nearly ₹750 in 2022-23, while it was below ₹500 for pre-paid mobile wallets. Growing evidence shows that the pandemic accelerated the pace of digitalisation in payments with 33 per cent of Indian households adopting digital modes, including third-party mobile apps, UPI and cards for the first time during the lockdown phase (NPCI, 2020). Importantly, the pick-up in digital payment adoption during COVID-19 was spread across all income groups (Chart 11). V.2.2. Trends in Cash Withdrawals CiC can serve as a proxy for cash demand, although the transactional component represents only a small portion of total CiC (Stix, 2004). To assess the usage of cash for payment purposes, ATM withdrawals data can be examined. Owing to their flow nature, the value of cash withdrawn from ATMs is adjusted to account for changes in velocity resulting from the substitution of digital payment modes for cash (Khiaonarong & Humphrey, 2023)6. In India, there is an array of methods for cash procurement - ATMs, Micro ATMs (through business correspondents), bank branches and PoS. Since their inception in 1969, ATMs have been an important channel for accessing cash. Given the limit on the number and value of cash withdrawals at ATMs in India, these withdrawals can serve as an indicator of both the transactional component of cash demand as well as ‘genuine’ precautionary balances (excluding hoarding). In other words, higher ATM withdrawals would indicate a higher need for cash for day-to-day transactions. 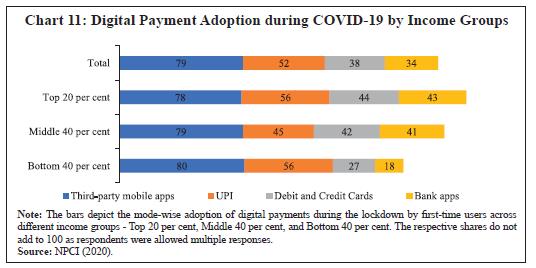 At the onset of the lockdown in 2020, there was a substantial fall in ATM withdrawals. The number and value of withdrawals mirrored each other closely (Chart 12). However, this trend was upended during and after the first wave of the pandemic, as the wedge between the number and value of withdrawals widened. As the pandemic spread, the number of cash withdrawals declined by 52 per cent in April-June quarter of 2020 over the corresponding quarter of 2019, while the drop in the value was to the tune of 36 per cent. The uncertainty surrounding the pandemic might have driven households to preserve cash to avoid frequent visits to the bank or ATMs. If history is anything to go by, events that are characterised by significant uncertainty typically elicit a dash towards cash as a tool for crisis management (Rösl and Seitz, 2021). Overall, there was a decline in cash withdrawals of about 32 per cent in 2020-21, while the decline was by just about 16 per cent in value terms (Chart 13). The rise in the size of average withdrawal indicated uncertainty-driven larger-than-usual withdrawals through a fewer ATM visits. Notwithstanding the COVID-induced surge, the trend growth in cash withdrawals has nearly stagnated in recent months posting a near zero growth (Annex 1: Chart 2). 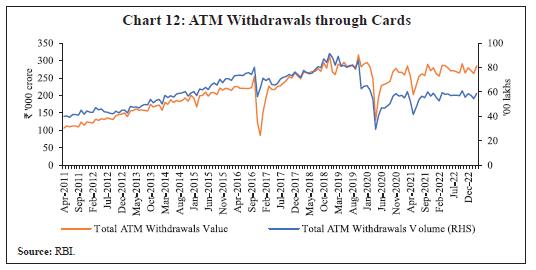 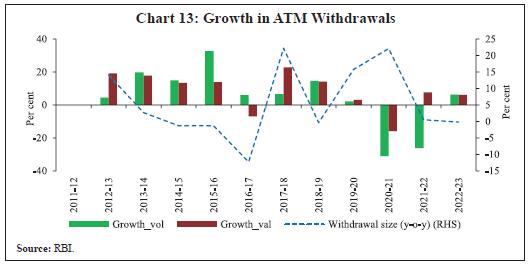 The narrowing difference between CiC and ATM withdrawals (both scaled to GDP) from 2018-19 point towards reduced transactional cash demand. Additionally, the cash velocity measured by the ratio of GDP to the outstanding CiC has exhibited a consistent downward trend, notwithstanding the minor uptick during the remonetisation in 2016-17. This trend indicated a reduction in the frequency of using currency for transactions and implied that a larger proportion of cash was being stored rather than spent and invested. There was also a downward trend in the cash-to-card ratio, i.e., the ratio of monthly average value of ATM withdrawals to monthly average ticket size of card payments since the peak of the first wave in April 2020. Since cards can also be used for withdrawing cash, the fall in this ratio suggests that the pandemic conditions propelled a declining preference for cash to serve transactional purposes, with cards being used more for effecting digital payments. Further, the cash usage at the PoS terminals decreased to 27 per cent in 2022 from 71 per cent in 2019 (FIS, 2023). V.3. Other Drivers of CiC V.3.1. Direct Benefit Transfers The efficiency gains associated with benefit transfers through digital mediums is well-documented (Aker et al., 2013). The Aadhaar-linked bank accounts for disbursing government subsidies have been instrumental in driving financial inclusion and digital adoption in the country. During the pandemic, social protection programmes, especially cash transfers, took the centrestage (Gentilini et al., 2020). The Government ramped up total cash-based direct benefit transfers (DBTs) by 24 per cent in 2020-21 from 12 per cent in 2019-20, with the number of intended beneficiaries expanding by 27 crores (Chart 14). The uptick in cash transfers of ₹56,849 crore amounted to 14 per cent of the total variation in CiC in 2020-21. During 2021-22, the uptick in cash transfer over the pre-COVID period accounted for about 10 per cent of the variation in CiC. Various State Governments, including Rajasthan, Tamil Nadu, Bihar, and Madhya Pradesh, also launched various one-time cash-transfer schemes in the wake of the pandemic in addition to pre-existing DBT schemes, such as Telangana’s Rythu Bandhu and Odisha’s KALIA. Such directed transfers strengthened the complementarity between cash and digital modes. While benefits were routed electronically to beneficiary accounts through the National Automated Clearing House – NACH (the digital leg), these were subsequently withdrawn in cash through banks or micro- ATMs that facilitated cash withdrawals in underserved areas (the cash leg), resulting in simultaneous growth in both. In some instances, they reached the last mile through other intermediaries like BCs who withdrew and distributed cash to the beneficiaries. V.3.2. Informal Sector and Labour Market Dynamics The informal sector is primarily associated with cash settlements, thus, signifying its crucial role in driving cash demand (Amromin and Chakravorti, 2009). An index compiled by a cash management company (CMS Infosystems) shows that there were widespread swings in cash-intensive sectors during 2020 and 2021. Interestingly, the relative intensity of cash, i.e., average cash picked up from industry for further processing and vaulting grew by a significant margin. This was especially the case for sectors, such as jewellery, accessories transportation, and various small, medium and large enterprises (SMLE). There was an increased movement of lumpy cash payments, particularly with the easing of restrictions from July 2020 onwards (Chart 15). A part of this rise could be attributed to rising prices. However, the increase in retail inflation explained approximately 40 per cent of the total increase in CiC7, indicating the presence of other factors in perpetuating cash use. 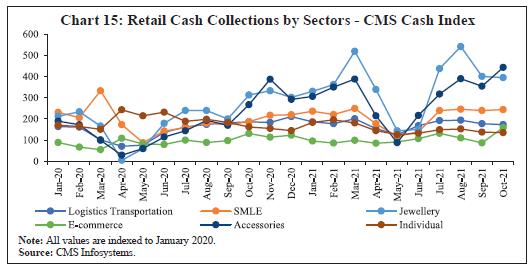 V.3.3. Portfolio Adjustment of Households The currency demand paradox can also be explained by the growing need to store cash, driven essentially by lower global interest rates and lower price levels worldwide since the early-1990s. In India, deposit rates declined from 2016 owing to the policy stimulus to boost growth and the implementation of the Flexible Inflation Targeting (FIT) framework that improved inflation anchoring. Between 2016-17 and 2022-23, the average deposit rates have fallen to 5.8 per cent from 7.5 per cent in the preceding seven years (2009-10 to 2015-16), although it may be noted that deposit rates rose during 2022-23 and 2023-24 so far. The lower return on alternative investments (or negative real return) during the period prior to 2022-23 might have translated into increased demand for non-interest-bearing assets like currency. Notably, while the share of currency in M3 has witnessed a steady fall since 1951-52, it has exhibited faster growth than total deposits during periods of crisis and major policy shifts (Chart 16). The precautionary behaviour in cash usage is also evident from the excess financial savings of households, which rose to 15.5 per cent of the Gross National Disposable Income (GNDI) in 2020-21 from 11.7 per cent a year ago8. One contributing factor for this could have been the readjustments in household budgets on account of stimulus measures, such as targeted benefit schemes and deferral of loan and interest repayments. In addition, a significant decline in private consumption expenditure due to mobility constraints and the uncertain outlook for income and employment could have led to an increase in household savings. Households primarily retained their financial flows in the form of physical currency and deposits in 2020-219 (Chart 17). The shares of both bank deposits and currency increased in 2020-21 as compared to previous year. While deposits should typically substitute currency holdings, a simultaneous rise in both indicated a persistent use of cash as a savings vehicle during crises (Jobst and Stix, 2017). 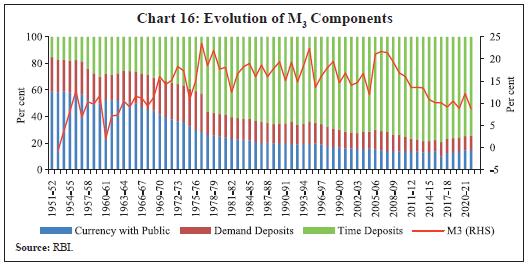 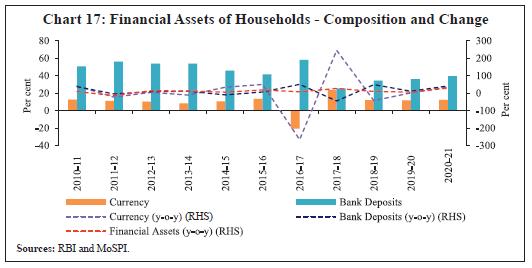 The stylised facts presented in this section indicate the presence of precautionary and store-of-value motives for the high CiC. The analysis also suggests that the transactional needs served by cash are being increasingly substituted by digital means. Section VI
Empirical Modelling of Currency Demand In consonance with the existing literature, we investigate the main drivers of CiC, including the GDP, deposit interest rates, value of digital transactions, uncertainty, and credit-to-deposit ratio (CDR), representing the role of income, financial and technological innovations, and precautionary demand. We perform similar empirical exercise for modelling the real currency demand in order to isolate the price effects on CiC. Despite the data on digital payments being available from April 2004 onwards, we conduct our empirical exercise based on the quarterly series available from Q2:2009 to Q2:2022. This is because the major thrust to the digital payment ecosystem was provided after the enactment of the PSS Act in 2008. Through this sub-sample, we also minimise the effect of the global financial crisis on our results. For interest rates, we consider the lower bound of the rates provided by major banks on deposits with less than one-year maturity. The uncertainty index is sourced from Baker et al. (2016), while the data for other series are taken from the RBI. The nominal and real CiC, and the nominal and real GDP data are seasonally adjusted using the X-13 ARIMA filter. All variables employed for empirical analysis, except interest rates and the CDR, are converted to natural logarithms. We also control for the effects of the withdrawal of SBN from circulation (2016Q4, 2017Q1) and the first COVID-induced nationwide lockdown (2020Q2) by way of dummy variables. We use the autoregressive distributed lag (ARDL) model (Pesaran and Shin, 1995 and Pesaran et al., 2001) for estimating the long-run currency demand function. Given the limited sample size of 50 observations, other time series methods involving multiple equation modelling, such as vector autoregression (VAR) and vector error correction models (VECM) are not suitable. Since there exists a one-to-one association between ECM of a VAR model and an ARDL model (Banerjee et al., 1993), the latter is often considered a workhorse model for estimating outcome and predictor variables that exhibit correlation both contemporaneously and across lagged values. For smaller samples, ARDL can preserve degrees of freedom and provide unbiased estimates of the underlying short-run error correction and long-run cointegration relationships. It has another advantage of not being restricted by the differences in the order of integration, and thus, can encompass a mix of stationary and non-stationary variables, which is typically not feasible in traditional cointegration methodologies propounded by Engle-Granger (1987) and Johansen (1995). Since the ARDL model cannot be applied in case the variables under consideration are integrated of order 2 or higher, we conduct stationarity tests using the Augmented Dickey-Fuller (ADF) test of unit root, the results of which indicate stationarity (Annex 2). We formalise and estimate the following long-run models in nominal terms: Baseline Model 1: Under the conventional money demand equation, we model the log of CiC as a function of log of nominal income (LYN), giving the income effect and short-term interest rates (INT), giving the opportunity cost effect. The changes in economic activity, as measured by the nominal GDP growth, are a key determinant of currency demand in an economy (Knell and Stix, 2005). Other things being equal, the circulating currency is expected to increase with the income growth. Since currency has no associated nominal rate, the return on deposits forms the opportunity cost of holding cash. Under the Baumol- Tobin framework, the transactional cash demand is influenced by interest rates. However, the precautionary demand is expected to be more interest-sensitive than the transactional component (Bech et al., 2018). Model 2: In the second model, we add the log of the value of total digital payments to the baseline model. Given the potential of the innovations in transaction technology to shift money demand, this inclusion culls out the substitution effect between cash and digital means. Since the shift to digital means reduces the transactional costs associated with cash procurement, handling and management, we expect this sign to be negative in line with prevailing literature. Exclusion of this variable in modelling the modern currency demand function may lead to omitted variable bias (Columba, 2009). While studies usually take cards and ATM/ PoS densities to determine technological innovation, we take the total value of digital payments since Indian users have a wide range of digital modes at their disposal. Model 3: In the third model, we supplement the currency demand function with a set of variables to capture the precautionary effect and ascertain the underlying positive impact of uncertainties on cash usage. First, we take the log values of the uncertainty index (LUt)10, which warrants a positive association with CiC as public tends to hold more cash to maintain liquidity during uncertain periods (Ivanovski and Churchill, 2019). Further, to proxy for uncertainty in the informal sector, we use the CDR. Since the credit flow reduces with increase in uncertainty owing to risk aversion on part of banks and reduced credit demand by customers due to tapered economic activities, the lower values of CDR can denote uncertain periods and thus, increased demand for cash (Valencia, 2017). For robustness checks, we also include the BIS-sourced credit-to-GDP gap (CGAP)11 and the actual credit-to-GDP ratio, whose signs are expected to be negative, as reduced credit in the economy can increase currency demand. While other drivers, such as the socio-demographic profile of the population and tax-to-GDP ratio can also be added to make the analysis more robust, we follow a parsimonious approach due to data constraints. Finally, we also estimate the real currency demand function using real income and real digital payments with similar set of additional explanatory variables used for the nominal currency demand analysis. Section VII
Empirical Results Income emerges as the dominant driver of cash demand across all the models. In the baseline model, the coefficient for income is underestimated when compared to models with digital innovations and precautionary motives for money demand (Table 1). The inclusion of these variables brings the income coefficient closer to unity, thereby substantiating the choice of the augmented currency demand function. Overall, the long-run income coefficient is broadly aligned with the empirical literature on the standard quantity theory of money, indicating a coefficient of one (Brunner and Meltzer, 1967). However, it deviates from the coefficient of 0.5 postulated by inventory theoretic models. | Table 1: Long-run Coefficients of Nominal Currency Modelling Regression | | Dependent Variable: LCIC (Natural Log of Currency in Circulation) | | | Baseline Model 1 | Model 2 | Model 3 (a) | Model 3 (b) | | Model Type | ARDL (3,1,0) | ARDL (3,3,0,2) | ARDL (3,2,0,2,1) | ARDL (3,3,0,0,2,2) | | | (a) | (b) | (c) | (d) | | Nominal Income (LYN) | 0.88***
(0.04) | 1.19***
(0.20) | 1.26***
(0.18) | 1.47***
(0.18) | | Interest Rate (INT) | -0.06***
(0.01) | -0.07***
(0.01) | -0.07***
(0.01) | -0.06***
(0.01) | | Digital Payments Value (LDIGVAL) | | -0.30**
(0.16) | -0.31**
(0.15) | -0.42***
(0.14) | | Uncertainty (LU) | | | 0.06**
(0.03) | 0.08**
(0.03) | | Credit-Deposit Ratio (CDR) | | | | -0.008
(0.008) | | Intercept | 1.53**
(0.81) | 1.96**
(0.84) | 0.83
(0.84) | 0.16
(0.84) | | Error Correction | -0.24***
(0.01) | -0.24***
(0.01) | -0.27***
(0.01) | -0.27***
(0.01) | | Bounds Test: F statistic # | 48.52 | 33.89 | 33.73 | 27.35 | | Model Tests | | | | | | Adjusted R-squared | 0.99 | 0.99 | 0.99 | 0.99 | | Akaike Information Criterion (AIC) | -4.81 | -5.06 | -5.08 | -5.29 | | Schwartz Information Criterion (SIC) | -4.46 | -4.52 | -4.50 | -4.59 | | Durbin-Watson Stat. | 2.18 | 1.84 | 2.05 | 1.71 | Note: The standard errors are in parentheses.
* p<10 per cent; ** p<5 per cent; *** p<1 per cent.
# Critical values for F statistic at 5 per cent level are around 3.0 and 4.0 for I(0) and I(1) assumptions, respectively.
Source: Authors’ calculations. | The inclusion of uncertainties in the model results in an increased income elasticity of currency, indicating a greater sensitivity of currency demand to fluctuations in income levels. This heightened responsiveness can be attributed to factors such as high risk aversion, an increase in precautionary savings, reduced levels of confidence, and amplified volatility in financial markets, which are characteristic of uncertain periods. Further, a rise in income is typically associated with two distinct effects. Firstly, it leads to higher levels of consumption and increased utilisation of all payment systems, whether cash-based or digital. Secondly, it may accelerate the substitution of cash with electronic payments (Titova et al., 2021). The positive sign and growth of the income coefficient, even with the inclusion of digital payments in the model, may thus indicate the stronger “consumption” effect of income within the Indian payments ecosystem (Model 2). The coefficient attached with the opportunity cost of holding cash balances, i.e., the interest rate on deposits, is negative and statistically significant across all models in both nominal and real terms. The sensitivity of currency demand to changes in interest rate increases with the addition of digital modes of payments in the model. This may suggest, for instance, during periods of monetary tightening, the reduction in currency demand would be relatively more pronounced for a given increase in interest rates due to the availability of digital alternatives, which will encourage individuals to part with currency and opt for interest-bearing bank deposits (Model 2). Further, uncertainties can also increase the interest elasticity of currency demand due to the inclination towards safety and greater preference for liquidity (Model 3 a). These findings are in line with the existing literature that indicates a persistent role of cash as a store-of-value despite the digital juggernaut (Attanasio et al., 2002). Digital modes captured under Model 2 show a negative relationship with currency demand in both nominal and real terms, indicating that increasing digital adoption can shift the preference away from holding cash. However, the substitution effect, albeit significant, is overshadowed by the dominant income effect. At the same time, this suggests that digital transactions can potentially moderate the impact of income on currency demand and lower the currency-to-deposit ratio over time, given the significant growth observed in digital payment modes. These findings are in line with existing literature (RBI, 2023; Chaudhari et al., 2019). Model 3 (a and b) brings to fore the impact of precautionary variables on cash usage. The coefficient for the uncertainty index is positive and significant, indicating higher CiC during periods of uncertainty. The impact of CDR is negative, albeit statistically not significant, in the nominal currency demand function. To check for the robustness of uncertainty variables, we use alternative measures of credit-GDP gap and the actual credit-GDP ratio as well. Both these variables negatively impact cash usage, suggesting that lack of access to formal and quick sources of credit during crises can increase cash holdings. The impact of these uncertainty variables becomes more pronounced in real currency demand function with the coefficient of log uncertainty (LUt) doubling from 0.06 to 0.12 (Table 2). This can be ascribed to individuals’ adaptive response to uncertain periods, wherein they modify their currency holding behaviour to safeguard their purchasing power and mitigate potential inflationary risks. The robustness checks conducted using other uncertainty variables also hold true, corroborating our hypothesis that the unusual uptick in CiC during the pandemic period was significantly shaped by the precautionary motives. We also control for major events in the sample period characterised by high uncertainty. Owing to the withdrawal of SBN, the dummy coefficient for 2016Q4 and 2017Q1 was negative and statistically significant, whereas the dummy variable for the pandemic was positive and statistically significant, suggesting that the increase witnessed in currency demand during the lockdown was driven by precautionary and store-of-value motives. | Table 2: Long Run Coefficients of Real Currency Modelling Regression | | Dependent Variable: LCICR (Natural Log of Real Currency in Circulation) | | | Baseline Model 1 | Model 2 | Model 3 (a) | Model 3 (b) | | Model Type | ARDL (3,1,0) | ARDL (3,0,1,1) | ARDL (3,0,3,1,1) | ARDL (3,0,3,1,1,1,) | | | (a) | (b) | (c) | (d) | | Real Income (LYR) | 0.71***
(0.06) | 1.01***
(0.14) | 1.18***
(0.10) | 1.23***
(0.12) | | Interest Rate (INT) | -0.05***
(0.01) | -0.06***
(0.01) | -0.07***
(0.01) | -0.07***
(0.02) | | Real Digital Payments Value (LRDIGVAL) | | -0.26**
(0.11) | -0.32***
(0.08) | -0.35***
(0.10) | | Uncertainty (LU) | | | 0.12***
(0.02) | 0.12***
(0.03) | | Credit-Deposit Ratios (CDR) | | | | -0.01
(0.00) | | Intercept | 4.00***
(1.09) | 2.46**
(1.18) | 0.44
(0.94) | 0.01
(1.41) | | Error Correction | -0.23***
(0.01) | -0.24***
(0.01) | -0.30***
(0.01) | -0.29***
(0.01) | | Bounds Test: F statistic # | 46.72 | 50.29 | 57.92 | 43.87 | | Model Tests | | | | | | Adjusted R-squared | 0.99 | 0.99 | 0.99 | 0.99 | | Akaike Information Criterion (AIC) | -5.32 | -5.39 | -5.70 | -5.68 | | Schwartz Information Criterion (SIC) | -4.98 | -4.96 | -5.12 | -5.02 | | Durbin-Watson Stat. | 1.34 | 1.44 | 1.85 | 1.87 | Note: The standard errors are in parenthesis and significance levels are * p<10 per cent; ** p<5 per cent; *** p<1 per cent.
# Critical values for F statistic at 5 per cent level are around 3.0 and 4.0 for I(0) and I(1) assumptions, respectively.
Source: Authors’ calculations. | The speed of convergence of the short-run coefficients to the long-run cointegrating dynamics given by the error correction coefficient does not change significantly. Throughout the models, 23 to 30 per cent of the divergences are corrected and aligned with the long-run path within one period. Upon further checks, we find that the residuals are uncorrelated and homoscedastic across specifications. These empirical findings are stable as they satisfy the cumulative sum (CUSUM) test and CUSUM of squares test. Since the value of the F-statistic is greater than the I (1) critical value bound, we can establish the existence of a long-run equilibrating relationship between our variables; the error-correction form is laid out in Annex 2. There is a caveat to the empirical analysis. While it allows us to identify the impact of exclusive precautionary variables, such as uncertainty, it cannot be used to fully decompose the cash demand into transactional and precautionary motives. This is because both these motives are intertwined with the income effect, making it challenging to disentangle them. Therefore, to assess the role of cash in transactional demand in India, we rely on comparative numerical analysis. Drawing from existing literature, transactional cash demand broadly encompasses the cash withdrawals at ATMs, PoS and Micro ATMs; small denomination notes and coins12 as well as cash held in banks. The sum of the monthly averages of these components can provide a flow measure of currency demand. Further, to approximate economic transactions, we use private final consumption expenditure (PFCE) as it tends to be closely related to cash payments (Reimers et al., 2020)13. Our analysis shows that the estimated average monthly cash-based transactions relative to average monthly PFCE has declined to 40 per cent in 2022-23 from 47 per cent in 2020-21. This indicates diminishing significance of cash in facilitating transactions as digital payment methods gain prominence. Section VIII
Conclusion Given the perceived substitutability between cash and digital payments, the simultaneous growth in both may appear paradoxical. This atypical scenario calls for an exploration of the underlying drivers of these payment modes. Empirical analysis of the long-run currency demand function reveals the statistically significant impact of income and precautionary variables on cash demand. Digital payments exhibit an inverse and statistically significant association with currency use, although this substitution effect is overshadowed by the dominant income effect. This suggests that the heightened intensity of transactions provides opportunities for both cash and digital payments to rise in an emerging economy like India. The rapid growth momentum in digital payments, however, has the potential to moderate the positive income effect on currency demand over time. In addition to being a medium of transaction, cash serves as a hedge against uncertain periods, such as the COVID-19 pandemic, which are marked by an increased demand for cash driven by precautionary motives. Empirical evidence indicates that precautionary variables increase currency demand. Overall, it is seen that digital payments are substituting the transactional demand for cash, but the store-of-value motive of holding cash remains intact. Illustratively, this is evident from the CiC growth being primarily driven by the demand for large-denomination banknotes, which have witnessed an increase in their proportion of total CiC. There has also been a decline in the share of low denomination notes, partly due to the substitution of small-value payments through UPI and mobile wallets, as corroborated by their narrowing ticket sizes. Further, lower transactional cash demand is also indicated by reduced cash withdrawals from ATMs. Despite the traction observed in digital payments, cash persists due to a strong inclination of the populace to transact and save in cash. Moreover, cash serves as the de facto foundation for all types of payments. It also plays a crucial role in facilitating transactions between the formal and informal sectors as well as with segments of the population that are financially excluded and lack digital awareness. Furthermore, the usage and adoption of digital payments remain concentrated in regions characterised by higher levels of development. To sustain the momentum towards digital payments initiated by the pandemic, concerted efforts are needed to (a) ensure the cost-effectiveness of payment modes and relevant acceptance infrastructure from both the demand (consumers) and supply sides (merchants and intermediaries); (b) ensure universal access to enablers, such as smartphones and internet connectivity; (c) bolster financial inclusion and literacy; and (d) safeguard cybersecurity and customer protection. To give stimulus to the digital drive, the RBI has taken several measures such as round-the-clock operability of centralised payment systems, implementation of a Payment Infrastructure Development Fund for subsidised deployment of payment acceptance infrastructure, launch of the UPI123Pay for feature phone users, prepaid payment instrument (PPI) interoperability, launch of the retail and wholesale central bank digital currency (CBDC) pilot projects, among others (Annex 3). Finally, the success of digitalisation extends beyond mere cash substitution; it has broader implications for economic growth, development of financial markets, financial well-being of households, and effective governance. In sum, given the ongoing expansion of digital payments and the moderation in the growth of currency demand witnessed post-pandemic, the high cash usage observed during the pandemic may not translate into a permanent shift.
References ACI Worldwide and Global Data, 2023. It’s Prime Time for Real-Time 2023. https://insiderealtime.aciworldwide.com/prime-time-report-23 Aker, J., Boumnijel, R., McClelland, A., & Tierney, N. (2013). How do electronic transfers compare? Evidence from a mobile money cash transfer experiment in Niger. Tufts University Working Paper. Alvarez, F., & Lippi, F. (2009). Financial innovation and the transactions demand for cash. Econometrica, 77(2), 363-402. Amromin, G., & Chakravorti, S. (2009). Whither Loose Change? The Diminishing Demand for Small‐Denomination Currency. Journal of Money, Credit and Banking, 41(2‐3), 315-335. Arango-Arango, C. A., & Suárez-Ariza, N. (2020). Digital payments adoption and the demand for cash: New international evidence. Journal of Payments Strategy & Systems, 14(4), 392-410. Ardizzi, G., Nobili, A., & Rocco, G. (2020). A Game Changer in Payment Habits: Evidence from Daily Data during a Pandemic. Bank of Italy Occasional Paper, 591. Ashworth, J., & Goodhart, C. A. (2020). The surprising recovery of currency usage. International Journal of Central Banking, 16(3), 239-277. Attanasio, O. P., Guiso, L., & Jappelli, T. (2002). The demand for money, financial innovation, and the welfare cost of inflation: An analysis with household data. Journal of Political Economy, 110(2), 317-351. Bailey, A. (2009, December). Banknotes in Circulation–Still Rising. What Does this Mean for the Future of Cash?. In Speech at the Banknote 2009 Conference, Washington DC (Vol. 6). Baker, S. R., Bloom, N., & Davis, S. J. (2016). Measuring economic policy uncertainty. The Quarterly Journal of Economics, 131(4), 1593-1636. Banerjee, A., Dolado, J. J., Galbraith, J. W., Hendry, D., et al., (1993). Co-integration, error correction, and the econometric analysis of non-stationary data. Oxford university press Catalogue. Baumol, William J. (1952). The Transactions Demand for Cash: An Inventory Theoretic Approach. The Quarterly Journal of Economics. 66 (4), 545–556. Boston Consultancy Group and PhonePe Pulse. April 2022. Digital Payments in India: A US$10 Trillion Opportunity Bech, M. L., Faruqui, U., Ougaard, F., & Picillo, C. (2018). Payments are a-changin’but cash still rules. BIS Quarterly Review, March, 67–80 Bhuyan, P., Roy J., & Priyadarshi R. R. (2021). Retail Payment Habits in India - Evidence from a Pilot Survey. RBI Bulletin April 2021. BIS. 2021. Covid-19 accelerated the digitalisation of payments. Commentary on the BIS Committee on Payments and Market Infrastructures (CPMI). Boeschoten, W. C. (2012). Currency use and payment patterns. Springer Science & Business Media, Vol. 23 Brunner, K., & Meltzer, A. H. (1967). Economies of scale in cash balances reconsidered. The Quarterly Journal of Economics, 422-436. Caswell, E., Smith, H., Learmonth, D., & Pearce, G. (2020). Cash in the Time of Covid. Bank of England Quarterly Bulletin, Q4. Chandak, Bhawarlal. (2022). Why cash is still king in India. Hindu Business Line, November 2022. https://www.thehindubusinessline.com/opinion/why-cash-is-still-king-in-india/article66179749.ece Chaudhari, D. R., Dhal, S., & Adki, S. M. (2019). Payment systems innovation and currency demand in India: some applied perspectives. Reserve Bank of India Occasional Papers, 40(2), 33-63. Chen, H., Engert, W., Huynh, K., Nicholls, G., Nicholson, M., & Zhu, J. (2020). Cash and COVID-19: The impact of the pandemic on the demand for and use of cash. Bank of Canada Staff Discussion Paper 2020-6. Chen, H., Felt, M. H., & Huynh, K. P. (2017). Retail payment innovations and cash usage: accounting for attrition by using refreshment samples. Journal of the Royal Statistical Society: Series A (Statistics in Society), 180(2), 503-530. Columba, F. (2009). Narrow money and transaction technology: new disaggregated evidence. Journal of Economics and Business, 61(4), 312-325. Das, Shaktikanta (2021). “Financial Inclusion – Past, Present and Future”. Reserve Bank of India. https://www.rbi.org.in/Scripts/BS_SpeechesView.aspx?Id=1110 Drehmann, M., Goodhart, C., & Krueger, M. (2002). The challenges facing currency usage: will the traditional transaction medium be able to resist competition from the new technologies?. Economic Policy, 17(34), 193-228. Engle, R. F. and Granger, C. W. (1987). Co-integration and error correction: representation, estimation, and testing. Econometrica, 55, 251-276 Fisher, I. (1911). The Purchasing Power of Money, its Determination and Relation to Credit, Interest and the Crises. Macmilln. FIS (2023), The Global Payments Report https://www.fisglobal.com/-/media/fisglobal/files/campaigns/global-payments report/FIS_TheGlobalPaymentsReport_2023.pdf Friedman, B. M. (1999). The future of monetary policy: The central bank as an army with only a signal corps?. International finance, 2(3), 321-338. Gentilini, U., Almenfi, M., Orton, I., & Dale, P. (2020). Social Protection and Jobs Responses to COVID-19. A Real-Time Review of Country Measures. COVID-19 Living Paper Washington, D.C. World Bank Group Guttmann, R., Pavlik, C., Ung, B., & Wang, G. (2021). Cash Demand during COVID-19. Bulletin–March Quarter 2021. Huynh, K. P., Schmidt-Dengler, P., & Stix, H. (2014). The role of card acceptance in the transaction demand for money. Bank of Canada Working Paper No. 14-44 Ivanovski, K., & Churchill, S. A. (2019). Economic policy uncertainty and demand for money in Australia. Applied Economics, 51(41), 4516-4526. Jobst, C., & Stix, H. (2017). Doomed to disappear? The surprising return of cash across time and across countries. CEPR Discussion Papers 12327. Johansen, S. (1995). Likelihood-based inference in cointegrated vector autoregressive models. Oxford University Press. Jonker, N., van der Cruijsen, C., Bijlsma, M., & Bolt, W. (2020). Pandemic Payment Patterns. DNB Working Paper No. 701 Keynes, J. M. (1954). The General Theory of Employment, Interest, and Money: By John Maynard Keynes. Macmillan. Khiaonarong, T., & Humphrey, D. (2023). Measurement and Use of Cash by Half the World’s Population. IMF Working Paper No. 2023/062 Knell, M., & Stix, H. (2006). Three decades of money demand studies: differences and similarities. Applied Economics, 38(7), 805-818. Lippi, F., & Secchi, A. (2009). Technological change and the households’ demand for currency. Journal of Monetary Economics, 56(2), 222-230. National Payments Corporation of India (2020), ‘Digital Payments Adoption in India, 2020’, NPCI-PRICE Report. Oyelami, L. O., & Yinusa, D. O. (2013). Alternative payment systems implication for currency demand and monetary policy in developing economy: A case study of Nigeria. International Journal of Humanities and Social Science, 3(20), 253–260. Pesaran, M. H., & Shin, Y. (1995). An autoregressive distributed lag modelling approach to cointegration analysis (Vol. 9514). Cambridge, UK: Department of Applied Economics, University of Cambridge. Pesaran, M. H., Shin, Y., and Smith, R. J. (2001). Bounds testing approaches to the analysis of level relationships. Journal of Applied Econometrics, 16(3), 289-326. Raj, J., Bhattacharyya, I., Behera, S. R., John, J., & Talwar, B. A. (2020). Modelling and Forecasting Currency Demand in India: A Heterodox Approach. Reserve Bank of India Occasional Papers, 41(1). Ravn, M. O., & Uhlig, H. (2002). On adjusting the Hodrick-Prescott filter for the frequency of observations. Review of Economics and Statistics, 84(2), 371-376. RBI, 2020. Assessment of the progress of digitisation from cash to electronic. Reserve Bank of India Report. RBI. 2021. Annual Report. RBI. 2023. Annual Report. 2023. RBI, 2022. Benchmarking India’s Payment Systems. Reimers, H. E., Schneider, F., & Seitz, F. (2020). Payment innovations, the shadow economy and cash demand of households in euro area countries. CESifo Working Paper, No. 8574 Rogoff, K., & Scazzero, J. (2021). Covid Cash. Cato J., 41, 571. Rösl, G., & Seitz, F. (2021). Cash and Crises: No surprises by the virus. IMFS Working Paper Series No. 150. Saroy, R., Awasthy, S., Singh, N. K., Adki, S. M., & Dhal, S. (2022). THE IMPACT OF COVID-19 ON DIGITAL PAYMENT HABITS OF INDIAN HOUSEHOLDS. Buletin Ekonomi Moneter Dan Perbankan, 25, 19-42. Scholten, B. (2017). Decline management: the case of cash. Policy response in the Netherlands and the Nordic countries. International Cash Conference 2017. Tagat, A., & Trivedi, P. L. (2020). Demand for cash: An econometric model of currency demand in India. Macroeconomics and Finance in Emerging Market Economies, 13(2), 205-222. Titova, Y., Cornea, D., & Lemeunier, S. (2021). What Factors Keep Cash Alive in the European Union? De Economist, 169(3), 291-317. Tobin, James (1956). “The Interest Elasticity of the Transactions Demand for Cash”. Review of Economics and Statistics. 38 (3), 241–247. Valencia, F. (2017). Aggregate uncertainty and the supply of credit. Journal of Banking & Finance, 81, 150-165. Wisniewski, T. P., Polasik, M., Kotkowski, R., & Moro, A. (2021). Switching from Cash to Cashless Payments during the COVID-19 Pandemic and Beyond. NBP Working Paper 337, Narodowy Bank Polski Zamora-Pérez, A. (2021). The paradox of banknotes: understanding the demand for cash beyond transactional use. Economic Bulletin Articles, 2.
Annex 1 Annex 2 | Table A1: Unit Root Test of Variables | | Variable | ADF Test Statistic | | Level Form | | | LCIC | -0.35 | | LCICR | -0.38 | | LYN | -1.09 | | LYR | -1.27 | | INT | -0.32 | | LDIGVAL | -0.91 | | LRDIGVAL | -1.26 | | LU | -2.86* | | CDR | -3.12** | | First Difference Form | | | D(LCIC) | -6.89*** | | D(LCICR) | -6.29*** | | D(LYN) | -8.61*** | | D(LYR) | -10.2*** | | D(INT) | -4.12*** | | D(LDIGVAL) | -2.95** | | D(LRDIGVAL) | -3.07** | | D(LU) | -8.51*** | | D(CDR) | -5.30*** | Note: (a) D: first differences; LCIC: Natural Log of seasonally adjusted Currency in Circulation; LCICR: Natural Log of seasonally adjusted Real CiC; LYN: Natural Log of seasonally adjusted Nominal Income; LYR: Natural Log of seasonally adjusted Real Income; INT: Deposits rates of major banks; LDIGVAL: Natural Log of Digital Payments Value; LRDIGVAL: Natural Log of Real Digital Payments Value; LU: Natural Log of Uncertainty Index; CDR: Credit-to-Deposit Ratio.
(b) ***, **, and * denote significance levels at 1%, 5% and 10%, respectively.
Source: Authors’ calculations. |
| Table A2: Error Correction Model Regressions | | Dependent Variable: LCIC (Natural Log of Nominal Currency in Circulation) | | | Baseline Model 1 | Model 2 | Model 3a | Model 3b | | Model Type | ARDL (3,1,0) | ARDL (3,3,0,2) | ARDL (3,2,0,2,1) | ARDL (3,3,0,0,2,2) | | | (a) | (b) | (c) | (d) | | D(LCIC (-1)) | -0.27***
(0.04) | -0.24***
(0.01) | -0.20***
(0.04) | -0.26***
(0.01) | | D(LCIC (-2)) | -0.16***
(0.04) | -0.15***
(0.04) | -0.13***
(0.03) | -0.12***
(0.03) | | D(LYN) | 0.43***
(0.07) | 0.31***
(0.08) | 0.30***
(0.07) | 0.59***
(0.05) | | D(LYN (-1)) | | -0.24***
(0.07) | -0.23**
(0.06) | | | D(LDIGVAL) | | -0.01
(0.03) | -0.02*
(0.01) | | | D(LDIGVAL (-1)) | | -0.16***
(0.03) | -0.16***
(0.03) | | | D(LU) | | | -0.001
(0.008) | -0.006
(0.00) | | D(LU (-1)) | | | | -0.01*
(0.00) | | D(CDR) | | | | -0.002
(0.00) | | D(CDR (-1)) | | | | 0.01
(0.00) | | DUM 2020Q2 ^ | 0.16***
(0.02) | 0.10***
(0.02) | 0.11***
(0.02) | 0.16***
(0.02) | | DUM 2016Q4 + DUM 2017Q1 ^ | -0.32***
(0.01) | -0.32***
(0.01) | -0.31***
(0.01) | -0.29***
(0.01) | | Error Correction Coefficient | -0.24***
(0.01) | -0.25***
(0.01) | -0.27***
(0.01) | -0.26***
(0.01) | | Model Tests | | | | | | Adjusted R-squared | 0.92 | 0.95 | 0.95 | 0.96 | | Akaike Information Criterion (AIC) | -4.93 | -5.23 | -5.28 | -5.53 | | Schwartz Information Criterion (SIC) | -4.71 | -4.84 | -4.89 | -5.07 | | Durbin-Watson Stat. | 2.18 | 1.84 | 2.05 | 1.71 | Note: The standard errors are in parenthesis and significance levels are * p<10 per cent; ** p<5 per cent; *** p<1 per cent.
^ Fixed Regressors: DUM 2016Q4 + DUM 2017Q1 for SBN withdrawal and DUM 2020Q2 for COVID.
Lag Selection Criteria: AIC with maximum 3 lags.
Source: Authors’ calculations. |
| Table A3: Error Correction Model Regressions | | Dependent Variable: LCICR (Natural Log of Real Currency in Circulation) | | | Baseline Model 1 | Model 2 | Model 3a | Model 3b | | Model Type | ARDL (3,1,0) | ARDL (3,0,1,1) | ARDL (3,0,3,1,1) | ARDL (3,0,3,1,1,1) | | | (a) | (b) | (c) | (d) | | D(LCICR (-1)) | -0.14***
(0.04) | -0.14***
(0.04) | -0.11***
(0.03) | -0.10***
(0.01) | | D(LCICR (-2)) | -0.10***
(0.04) | -0.11***
(0.04) | -0.07**
(0.03) | -0.07**
(0.03) | | D(LYR) | 0.30***
(0.07) | | | | | D (INT) | | -0.01
(0.00) | -0.01
(0.00) | -0.00
(0.00) | | D (INT (-1)) | | | 0.01**
(0.00) | 0.01*
(0.00) | | D (INT (-2)) | | | 0.01**
(0.00) | 0.01*
(0.00) | | D (LRDIGVAL) | | -0.01
(0.02) | -0.02*
(0.01) | -0.05**
(0.02) | | D (LRDIGVAL (-1)) | | -0.16***
(0.03) | | | | D(LU) | | | 0.00
(0.00) | 0.00
(0.00) | | D(CDR) | | | | 0.00
(0.00) | | DUM 2020Q2 ^ | 0.10***
(0.02) | 0.10***
(0.02) | 0.10***
(0.02) | 0.10***
(0.02) | | DUM 2016Q4 + DUM 2017Q1 ^ | -0.28***
(0.01) | -0.28***
(0.01) | -0.28***
(0.01) | -0.27***
(0.01) | | Error Correction Coefficient | -0.23***
(0.01) | -0.24***
(0.01) | -0.30***
(0.01) | -0.29***
(0.01) | | Model Tests | | | | | | Adjusted R-squared | 0.93 | 0.95 | 0.95 | 0.99 | | Akaike Information Criterion (AIC) | -5.45 | -5.23 | -5.70 | -5.68 | | Schwartz Information Criterion (SIC) | -5.21 | -4.84 | -5.12 | -5.02 | | Durbin-Watson Stat. | 1.34 | 1.84 | 1.84 | 1.88 | Note: The standard errors are in parenthesis and significance levels are * p<10 per cent; ** p<5 per cent; *** p<1 per cent.
^ Fixed Regressors: DUM 2016Q4 + DUM 2017Q1 for SBN withdrawal and DUM 2020Q2 for COVID.
Lag Selection Criteria: AIC with maximum 3 lags.
Source: Authors’ calculations. | Annex 3 | Chronology of Major Policy Measures in India’s Payment Systems – 2020-21 to 2022-23 | | Month/Year | Major Measures | | March 2020 | • Press release informing round the clock availability of payment systems.
• Issuance of guidelines covering regulation of payment aggregators and payment gateways.
• Extension of timeline for compliance with various payment system requirements due to COVID-19. | | June 2020 | • Further extension in timeline for compliance by payment system operators.
• Authorised payment system operators were advised to undertake targeted multi-lingual campaigns to augment digital awareness. | | July 2020 | • Report of the Committee for Analysis of QR (Quick Response) Code was released. | | August 2020 | • Online Dispute Resolution (ODR) systems mandated for use in phased manner for Payment System Operators (PSOs).
• Pilot project for offline payment solutions announced.
• Release of ‘Framework for authorisation of pan-India umbrella entity for retail payments’. | | September 2020 | • Positive pay system for cheque truncation announced for all cheques of value- ₹50,000 and above. | | October 2020 | • Framework for recognition of a Self-Regulatory Organisation (SRO) for PSOs.
• Measures announced for streamlining QR codes for digital payment transactions. | | November 2020 | • Establishment of Reserve Bank Innovation Hub (RBIH).
• Commencement of the testing phase of first cohort- Retail Payments under the regulatory sandbox (RS). | | December 2020 | • RTGS made operational 24*7*365 from December 14, 2020.
• The per transaction limit for relaxation of Additional Factor of Authentication (AFA) for contactless card transactions was enhanced from ₹2,000 to ₹5,000.
• Guidelines to grant authorisation for all PSOs (both new and existing) on a perpetual basis issued.
• Second cohort under the RS with theme of ‘Cross Border Payments’ was announced.
• The theme for third cohort was also announced as ‘MSME Lending’.
• Net worth requirement for entities under RS was reduced from the existing ₹25 lakh to ₹10 lakh. | | January 2021 | • Digital Payments Index (DPI) was introduced.
• Framework for operationalisation of payments infrastructure development fund (PIDF) scheme introduced.
• Legal Entity Identifier (LEI) for payments of ₹50 crore and above using centralised payment systems (CPS). | | February 2021 | • Major payment system operators would be required to facilitate setting-up of a centralised industry-wide 24x7 helpline. | | March 2021 | • Guidelines for extending cheque truncation system across all bank branches issued.
• Extension provided till December 31, 2021, to PAs and merchants on-boarded for ensuring no storing of customer card credentials on database.
• Timeline extended to September 30, 2021, for processing and registering e-mandates for recurring online transactions. | | May 2021 | • Guidelines were issued mandating prepaid payment instruments (PPIs) interoperability, enhancing the limit for full KYC PPIs to ₹2 lakh, and permitting cash withdrawals using full-KYC PPIs of non-bank PPI issuers. | | June 2021 | • National Automated Clearing House (NACH) made available on all days of the week, effective August 1, 2021.
• Guidelines were issued with the revised interchange fee and customer charges for ATM transactions.
• Mobile prepaid recharge was permitted as a biller category in Bharat Bill Payment System (BBPS). | | July 2021 | • Authorised non-bank PSOs, viz., PPI issuers, card networks and white label ATM operators allowed to participate in CPS as direct members. | | August 2021 | • A framework for outsourcing of payment and settlement-related activities by PSOs was issued. | | | • Scope of device-based tokenisation was extended to include consumer devices – laptops, desktops, wearables, Internet of Things (IoT) devices, etc.
• PIDF beneficiary list expanded to include Street vendors, identified under Pradhan Mantri Street Vendor’s Aatma Nirbhar Nidhi (PM SVANidhi Scheme) in tier-1 and tier-2 centres. | | September 2021 | • Instructions were issued to extend the device-based tokenisation framework to Card-on-File Tokenisation (CoFT).
• Linkage of fast payment systems in India (UPI) and Singapore (PayNow). | | October 2021 | • The per-transaction limit in Immediate Payment Service (IMPS) was increased from ₹2 lakh to ₹5 lakh. | | December 2021 | • Enablement of small value transactions through an “on-device” wallet in UPI application was announced.
• The transaction limit for payments through UPI for Retail Direct Scheme and IPO applications was increased from ₹2 lakh to ₹5 lakh. | | January 2022 | • Framework for small value digital payments in offline mode issued. | | February 2022 | • The NACH mandate limit was increased from ₹1 crore to ₹3 crore for Trade Receivables Discounting System (TReDS) settlements.
• Payment and Settlement Systems Regulations, 2008 were amended. | | March 2022 | • UPI123Pay was launched to enable UPI payments for feature phone users.
• DigiSaathi, a 24x7 helpline was launched.
• Framework for geotagging of payment system touchpoints prescribed. | | April 2022 | • Issuance of the Master Direction – Credit Card and Debit Card – Issuance and Conduct Directions, 2022. | | May 2022 | • Interoperable card-less cash withdrawal facility introduced.
• Reduction in the minimum net worth criterion for Bharat Bill Payment Operating Units (BBPOUs) from ₹100 crore to ₹25 crore.
• Commencement of the test phase under the third cohort of the RS on ‘MSME Lending’.
• Opening of the fourth cohort with ‘Prevention and Mitigation of Financial Frauds’ as the theme under RS. | | June 2022 | • Enhancement in limit for e-mandate payments from ₹5,000 to ₹15,000.
• Modification of the PIDF Scheme. | | July 2022 | • Linkage of UPI and RuPay Credit cards proposed.
• Relaxation of the card-on-file data storage norms related to guest accounts on e-commerce platforms. | | August 2022 | • Enablement of the Bharat Bill Payment System (BBPS) to accept cross-border inward payments.
• Discussion Paper on Charges in Payment Systems floated. | | September 2022 | • A pilot project for end-to-end digitalisation of Kisan Credit Card (KCC)-based lending launched.
• First leg of the Guidelines on Digital Lending issued for implementation. | | Source: RBI. |
|