Deepa S. Raj and Edwin Prabu A.* This paper examines the impact and implications of Tamil Nadu’s agricultural loan waiver scheme of 2016, based on data collected through a field survey of seven districts of the state as well as farm loan transactions data obtained from select primary agricultural co-operative credit societies. The state government’s loan waiver scheme was applicable only to agricultural loans availed by small and marginal farmers, while other farmers with land holdings of above 5 acres were not eligible for the waiver benefit. Empirical findings using Regression Discontinuity Design (RDD) suggest that in the immediate post-waiver period near the cut-off acreage of 5 acres, the probability of obtaining credit was higher for non-beneficiary farmers than for beneficiary farmers. However, the differentiation in post-waiver access to credit to the beneficiary farmer and the non-beneficiary farmer comes down as the supply of funds for agricultural loans normalises. JEL Classification : G20, G28, Q14, Q18 Keywords : Agricultural loan waiver, credit, small and marginal farmers, regression discontinuity design Introduction Farmers in India take recourse to debt, both from formal and informal sources, not only to meet their investment needs but also to smoothen consumption in the face of adverse income shocks. At very high levels of debt, apart from the inability to repay it, the loss of creditworthiness no longer acts as a deterrent for non-repayment of loans, particularly those acquired through formal channels (Chakraborty and Gupta, 2017a). Debt relief/waiver schemes are, therefore, used by governments as a quick means to extricate farmers from their indebtedness, helping to restore their capacity to invest and produce. The costs and benefits of such debt relief schemes are, however, widely debated in the literature (Patel, 2017). Apart from adding to the financial stress of governments whose fiscal space may already be constrained, they may work against the borrowing farmers if lending institutions refrain from extending loans to defaulters by construing that they are likely to default again. Borrowers’ expectation of repeated bailouts by the government may vitiate credit culture among farmers and may further constrict farm lending (De and Tantri, 2016). Empirical research on agricultural debt waivers in India are mostly centred around the Agricultural Debt Waiver and Debt Relief Scheme (ADWDRS) 2008 of the Government of India (GoI), under which ₹525.16 billion of agricultural debt issued by commercial and cooperative banks were waived.1 Past research found mixed evidence of the impact of ADWDRS on agricultural households (Annex 1). On the borrower’s side, while debt relief was found to help reduce the overall household debt (Giné and Kanz, 2017; Kanz, 2016), there appears to be differential impact on distressed beneficiaries who benefit significantly from it compared to non-distressed beneficiaries whose loan performance worsens after the waiver (Mukherjee et al., 2017). Although agricultural debt waivers aim to increase investment and productivity of beneficiary households, empirical evidence does not support it (Kanz, 2016). Waiver impact on beneficiary farmers’ consumption and savings indicates that while the level and pattern of consumption remained unaffected, there was a rise in precautionary savings in the form of increased investment in jewellery, likely due to anticipation of higher credit constraints in the post-waiver period (Mishra et al., 2017). There appears to be no evidence of improvement in the ex post repayment behaviour of the waiver beneficiaries. In fact, an expectation of similar debt relief in future generates moral hazard and strategic loan default, i.e., loan defaults become sensitive to the electoral cycle after debt relief (Giné and Kanz, 2017). On the credit supply side, post-waiver lending slowed down in districts where the exposure to waivers was high, as banks shifted credit to observably less risky regions (ibid.). While this indicates improvement in efficiency of credit allocation post-waiver, on the flip side, restricted lending to backward districts could widen regional disparities. Difficulties in obtaining formal credit post-waiver could lead farmers to factor in future credit constraints and hence shift to informal sources of credit (Kanz, 2016). Consequently, loan waivers can have a dampening impact on lending by rural credit institutions (RBI, 2018). Against the backdrop of several state governments announcing agricultural loan/debt waiver schemes in the recent past, this study has taken up Tamil Nadu’s agricultural loan waiver scheme of 2016 as a case study. This is the second instance when the state has waived farm loans, the first being in 2006, even before the central government's ADWDR scheme of 2008. The study differs from the existing literature on agricultural loan/debt waivers in India—it examines the impact and implications of a state-level debt waiver scheme, taking into account policies which are more specific to the state2, unlike most other studies which have largely concentrated on the impact of the central government's debt waiver scheme. Like most other agricultural loan/debt waivers, Tamil Nadu’s scheme was implemented in fulfilment of an electoral promise, but the structure of the scheme differed significantly from other schemes (Annex 2). First, the scheme was applicable only to agricultural loans taken from rural co-operative institutions and not to loans from commercial banks3. Second, it was restricted to loans taken by small and marginal farmers with landholdings of 5 acres or less. Third, the scheme did not make a distinction between running loans and overdue loans. Hence, all the farmers who had an outstanding loan (as on March 31, 2016) were entitled to the waiver. Fourth, although there was no explicit ceiling on the waiver amount per farmer, the average loan size per farmer did not exceed ₹100,000 since lending by co-operatives was based on scale of finance. Fifth, although the farmers were provided loan/debt relief by the co-operative institutions on the year of the implementation, the state government spread the reimbursement of the same to these institutions over a five-year horizon, thereby reducing its fiscal burden. Given the structure of the waiver scheme, as elucidated above, it is clear that the fiscal cost of the agricultural loan waiver is not too high for Tamil Nadu. The focus of this study, therefore, is on the ramifications of the waiver on farmers and co-operative institutions. With regard to farmers, the study seeks to find the major sources of funding to meet repayment obligations in the absence of the waiver. It also attempts to ascertain whether there has been an increase in the number of new borrowers post-waiver indicating moral hazard associated with debt waivers. With regard to co-operatives, it examines whether the waiver has affected the ability and willingness to lend to beneficiary farmers vis-à-vis non-beneficiary farmers. The remainder of the paper is organised as follows. Section II provides an overview of agricultural credit extended by co-operatives in Tamil Nadu and discusses in detail the agricultural loan waiver schemes, both by the central government and the Tamil Nadu government, including the latest scheme of 2016. Section III sets out the empirical strategy covering data sources, descriptive statistics of the study, and the methodology for the empirical exercise using Regression Discontinuity Design (RDD). The results of the empirical exercise and the discussion thereof are explored in Section IV. Section V presents the concluding observations and sets out the way forward. Section II Agricultural Credit by Co-operatives in Tamil Nadu Co-operative Credit Structure in Tamil Nadu Short-term rural credit structure in the state consists of three tiers: (a) Tamil Nadu State Apex Co-operative Bank Ltd (TNSCB) at the state level; with 47 branches, (b) 23 district central co-operative banks at the district level, with 855 branches; and (c) 4,462 primary agricultural co-operative societies at the village level. The long-term credit structure consists of the Tamil Nadu Co-operative State Agriculture and Rural Development Bank at the state level and 180 primary co-operative agriculture and rural development banks at the taluk/block level. The urban co-operative banks provide banking services to the people in the towns and cities. Agricultural credit by the co-operative sector is extended through primary agricultural cooperative credit societies/banks (PACCS) with resources from the district central co-operative banks (DCCBs) for issuing both short-term and medium-term agricultural loans to the farmers. Apart from their own resources, the DCCBs also avail credit from TNSCB which, in turn, utilises its own funds as well as channelises the refinance from National Bank for Agriculture and Rural Development (NABARD), for agricultural purposes and for activities allied to agriculture. The short-term loans, also known as crop loans, with a maturity period of less than 15 months, are issued by PACCS for agricultural purposes depending on the crop cultivated. PACCS do not use their own funds but extend these loans from the funds provided by the DCCBs, TNSCB and NABARD. Crop loans upto ₹100,000 are provided against standing crops on personal surety. The farmers can obtain crop loans above ₹100,000 by providing adequate security in the form of property mortgage or by pledging jewellery for the loans. Medium-term loans with a maturity of three to five years are provided to members who are farmers, for undertaking allied activities such as dairying, sheep rearing and poultry farming. Primary agricultural co-operative societies, which have a sound financial position, also sanction loans for purposes such as purchase of tractors, power tillers and other agricultural implements. Overview of Agricultural Debt Waiver Schemes in the State Agricultural Loan Waiver Scheme, 2006 In an unprecedented step, the Government of Tamil Nadu waived off agricultural loans taken by farmers from co-operative banks/societies and outstanding as on March 31, 2006. This differs strinkingly from all the previous occasions, wherein the Tamil Nadu government had only waived off the interest/penal interest to be paid by the farmers (Table 1). To ensure continued services of co-operative institutions in providing loans to the farmers, the state government decided to reimburse the co-operatives, the entire amount which was to be waived off in five equal instalments between 2006–07 and 2010–11, with an interest of 8 per cent per annum. The government also took over the liabilities of the TNSCB and Tamil Nadu Co-operative State Agriculture and Rural Development Bank that was owed to NABARD.4 While the state government had disbursed four instalments in full, the last instalment was only partially disbursed in 2010–11 due to administrative reasons. | Table 1: State Government Measures for Agricultural Loans from Co-operative Institutions | | Year of announcement | Policy measures | Extent of relief borne by the Government | Cost to the exchequer
(₹ million) | | 1 | 2 | 3 | 4 | | 1996 | Waiver of penal interest rate on agricultural loans | 3 per cent on overdue loans | 200 | | 1999 | Interest waiver for prompt payment within due date for crop loans taken from July1, 1999 to June 30, 2000 | 7 per cent on outstanding loans | 360 | | 2001 | Waiver of interest and penal interest for farmers who had paid their dues before November 30, 2001 with respect to overdue outstanding as on June 30, 2000 | | 2,560 | | 2003 | Conversion of short-term loans to medium term loans for loans issued from April 1, 2002 to September 30, 2002 | Waiver of interest | 200 | | March 2004 | Interest waiver for prompt payment within due date for crop loans taken from April 1, 2003 to March 31, 2004 | | 610.5 | | September 2004 | Rescheduling of crop loans as on March 2004 | | 6,450 | | 2006 | Waiver of principal and interest/penal interest on all agricultural loans taken by farmers from co-operative banks/ societies as on March 31, 2006 | Principal and interest on outstanding loans, interest @ 8 per cent for staggered payment over five years | 65,263 | | 2009 | Full interest waiver for prompt payment of all crop loans | 6 per cent | 1,400 | | 2016 | Waiver of principal and interest/penal interest on all outstanding agricultural loans as on March 31, 2016 taken by marginal and small farmers from co- operative banks/societies | Principal and interest on outstanding loans, interest @ 8 per cent for staggered payment over five years | 60,950 | | Source: Compiled from various budget documents of the Tamil Nadu government and S. Vydhianathan (2006). | Although the waiver helped farmers who could not repay loans due to successive droughts, there were certain complaints regarding issuance of loans by banks in some districts. Crop verification as well as cross-verification of landholdings were not done at the time of issue of loans. At the same time, loans for certain crops were issued in regions where cultivation of such crops was not tenable in the first place. Agriculture Debt Waiver and Debt Relief Scheme, 2008 The Government of India (GoI) announced the ADWDRS, 2008 in the Union Budget for 2008–09. The scheme sought to mitigate the distress of the farming community in general, and small and marginal farmers in particular, to de-clog institutional credit channels, to catalyse flow of credit to agriculture and to enhance agricultural production and productivity. The scheme covered direct agricultural loans disbursed by commercial banks and co-operative societies between March 31, 1997 and March 31, 2007 which were overdue as on December 31, 2007 and remained unpaid until February 29, 2008. The scheme made a distinction between loans taken by small and marginal farmers and other farmers. With respect to small and marginal farmers, the scheme covered their short-term production loans (subject to a ceiling in respect of plantation and horticulture) and installments of investment loans which were overdue. However, in the case of other farmers, the scheme provided for a one-time settlement, under which a rebate of 25 per cent of the eligible amount was given on the condition that the farmer repaid the balance 75 per cent in three instalments. Out of the total beneficiary farmers of 1.76 million in Tamil Nadu, 1.43 million small and marginal farmers were given a debt waiver and 0.33 million other famers were given debt relief (GoI, 2014). Tamil Nadu accounted for 5.2 per cent of the total amount provided by GoI as debt waiver/relief and 4.8 per cent in terms of the number of beneficiary farmers under the scheme. Out of the total outstanding debt of ₹33.5 billion waived off for small and marginal farmers in Tamil Nadu, only ₹1.25 billion constituted the outstanding debt from co-operative institutions. Debt relief for other farmers who had borrowed from co-operative institutions in the state amounted to ₹0.18 billion. Agricultural Debt Waiver Scheme, 2016 The Government of Tamil Nadu waived off all crop loans, as well as medium-term and long-term agricultural loans availed by small and marginal farmers from co-operative societies that were outstanding in their books as on March 31, 2016. As per the scheme, the principal and interest on all outstanding loans would be reimbursed to the co-operative institutions, while the institutions themselves would have to bear penal interest and other charges on overdue loans. As the reimbursement will be spread over five years, the state government is paying an interest of 8 per cent on reduced balance for the staggered reimbursements. Thus, although the loan waiver benefit to the farmers was ₹ 53.19 billion, the total cost to the state exchequer on account of the debt waiver scheme amounts to ₹ 60.95 billion (Table 2). | Table 2: Details of Agricultural Loans Waived in 2016 | | Amount in ₹ Billion | | Loan type | No. of beneficiary farmers | Principal waived | Interest waived | Penal interest on outstanding loans | Other charges | Total amount waived | Amount to be borne by the co- operatives | Interest @ 8 % for staggered payment | Amount to be borne by the state government* | | 1 | 2 | 3 | 4 | 5 | 6 | 7=3+4+5+6 | 8=5+6 | 9 | 10 | | Crop loans and Medium Term Agricultural Loans | 11,99,535 | 48.81 | 3.77 | 0.34 | 0.04 | 52.95 | 0.38 | 7.55 | 60.67 | | Long term loans | 2,540 | 0.13 | 0.10 | 0.01 | 0.00 | 0.23 | 0.01 | 0.05 | 0.28 | | Total | 12,02,075 | 48.93 | 3.87 | 0.34 | 0.04 | 53.19 | 0.38 | 7.61 | 60.95 | | *: Includes commitment to NABARD | | Source: Department of Co-operation, Food and Consumer Protection, Government of Tamil Nadu. | Section III Empirical Strategy Governments, in general, grant loan waivers to reduce debt overhang and help spur agricultural investment. However, as can be seen in Table 2, the penal interest on outstanding loans at the time of the loan waiver was very low, reflecting the low overdue status of existing loans. This begs the following question: How do farmers repay the loans when they continue to face financial stress, as is widely reported? Furthermore, one of the major criticisms raised against the grant of loan waivers by governments is that it affects credit discipline, thereby limiting future access of waiver beneficiaries to institutional credit. Against this backdrop, our study attempts to test the following hypotheses: Hypothesis 1: Why is agricultural loan default low despite farmers facing financial stress and what are the sources of funds for repayment? In order to test this hypothesis we use data collected from field surveys conducted on beneficiary and non-beneficiary farmers in the selected districts. Hypothesis 2: Post-waiver access to short-term agricultural credit is higher for non-beneficiary farmers compared to beneficiary farmers. RDD using loan transaction-level data obtained from the selected PACCS is employed to test this hypothesis. Data Sources (i) Primary Data Collection through Survey A field survey was conducted in seven districts of Tamil Nadu, namely Salem, Namakkal, Tiruchirappalli, Thanjavur, Vellore, Thiruvannamalai and Ramanathapuram. While the selection of these districts was largely governed by their relative share in the number of beneficiary farmers and the amount of debt waived off, care was also taken to cover four out of the seven agro-climatic zones of the state (Chart 1). These include the Cauvery Delta region (Thanjavur and Tiruchirappalli districts), the moderately drought-prone, north-western region (Salem and Namakkal districts), semi-arid districts of the north-eastern region (Vellore and Thiruvannamalai districts) and the arid terrain of Ramanathapuram. Although the state receives maximum rainfall during the north-east monsoon season, districts of Salem and Namakkal also receive significant quantum of rainfall during the south-west monsoon season. The rainfall pattern during the monsoons in the three years prior to the waiver is given in Annex 3. Twenty-two PACCS were selected for the survey, with 10 PACCS from the north-western region which had the maximum number of waiver beneficiaries, five each from the Cauvery Delta region and the semi-arid north-eastern region and two from the arid terrain. We randomly selected around 50 farmers who had loans outstanding as of end-March 2016, i.e., the period reckoned for the waiver, in each of the selected PACCS. Out of the selected total 1,100 farmers, responses were obtained from 1,018 farmers. The sample included both beneficiary farmers (less than or equal to 5 acres) and non-beneficiary farmers (above 5 acres). The survey was conducted during the period June–October 2017 through a questionnaire. The questionnaire covered various aspects such as cost of cultivation, income, formal and informal debt. The findings of the survey are given in Annex 4. (ii) Cooperative Bank Data To analyse the supply-side impact of debt waiver, this study used transaction-level data from the selected 22 PACCS in the seven districts, taking into consideration short-term agricultural credit5 given to small and marginal farmers (less than or equal to 5 acres) and other farmers (more than 5 acres) for three years, i.e., 2015–16, 2016–17 and 2017–18 (up to December 15, 2017). The summary statistics show that the number of small and marginal farmers (treatment group) were more than five times the number of other farmers (control group) (Table 3). | Table 3: Summary Statistics – Agricultural Loan Amount | | | No. of observations | Mean | Median | Standard deviation | Minimum | Maximum | | Agricultural loan amount in log terms | 6813 | 10.8 | 10.8 | 0.658 | 8.17 | 12.6 | | Treated [acres ≤ 5 ] | 5713 | 10.6 | 10.7 | 0.630 | 8.17 | 12.6 | | Control [acres > 5 ] | 1100 | 11.3 | 11.4 | 0.514 | 9.21 | 12.6 | The characteristics of cooperative agricultural lending during 2016–17, the year of implementation of the waiver, as given in Table 4, underlines the following: (i) There is a positive relationship between short-term agricultural loan and acreage, in line with the scale of finance. It may be mentioned that besides acreage, scale of finance is also determined by cost of cultivation for various crops. (ii) In terms of share in the respective groups, more than half of the non-beneficiary farmers got credit as compared to around 46 per cent for small farmers and 44 per cent for marginal farmers. Methodology for Empirical Exercise using RDD Given the features of the debt waiver programme discussed above, i.e., loan waiver benefit extended only to farmers with less than or equal to 5 acres, but not to farmers with more than 5 acres, we use the RDD strategy to test hypothesis 2, i.e., whether post-waiver access to short-term agricultural credit was higher for non-beneficiary farmers as compared to beneficiary farmers. In this design, acre (x) is the running variable as it determines whether the farmer gets the debt waiver or not. The treatment Di is equal to 1 if the farmer has acreage less than or equal to 5 (small and marginal farmers) and Di is equal to 0 if the farmer has more than 5 acres. Yi(1) is the outcome under treatment and Yi(0) is the outcome under control. The observed outcome can be depicted as: | Table 4: Agricultural Loan Characteristics – Farmer Type | | Farmer Type | Average Acre | Average Loan Amount (₹) | Average Interest Rate (Per cent) | Post-waiver Credit in 2016–17 | | No | Yes | Per cent | | Marginal Farmers | 1.60 | 36,243 | 7 | 1655 | 1296 | 43.9 | | Small Farmers | 3.73 | 65,966 | 7 | 1487 | 1275 | 46.2 | | Other Farmers | 7.35 | 91,764 | 7 | 499 | 601 | 54.6 |
However, the problem is that the same individual cannot be observed on both sides of the cut-off. RDD states that under the assumption that Yi(0) and Yi(1) are functions of acre (x) and are continuous at the cut-off (i.e., acreage at 5), we can measure the average treatment effect between the small farmers vis-à-vis large farmers near the cut-off, i.e., 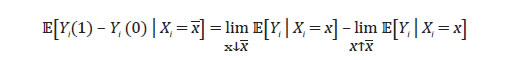 The average treatment, i.e., obtaining credit after a debt waiver is estimated using the local linear probability model (p = 1) with triangular kernel weights (Cattaneo et al., 2017) to avoid overfitting. In order to capture the treatment effect, two separate regression functions were fitted above and below the cut-off. The difference between the intercept of these two equations, i.e., above-the-cut-off equation and below-the-cut-off equation, gives the probability of obtaining credit post-waiver for the non-beneficiary farmers vis-à-vis the beneficiary farmers. The major issue in the estimation of RDDs is the selection of bandwidth around the cut-off (at 5 acres), as the results of the treatment effect are crucially determined by the bandwidth chosen to estimate the model. A wider bandwidth increases the number of observations for estimation but also increases potential bias due to the influence of far end observations on average treatment effect. On the contrary, if the bandwidth is small, the variance of the average treatment may be high. For our estimation model, we use the Coverage Error Rate (CER) optimal bandwidth given by Calonico et al., (2018). As a robustness check, we use several other bandwidths, including a manual bandwidth of 1 acre on both sides of the cut-off. RDD Validity Checks Chart 2a shows that the loan amount obtained by farmers increases in line with the size of landholdings. To simplify, we have subtracted 5 from the acre so that small and marginal farmers are represented as less than zero and other farmers as greater than zero. Chart 2b shows the impact of the waiver on beneficiary farmers (<=5 acres) and non-beneficiary farmers (>5 acres). The debt waiver amount is positive on the left side of Chart 2b while it is zero on the right side, indicating no waiver for non-beneficiary farmers. The determination of the beneficiary on the basis of acreage is a classic case of sharp RDD analysis. One major assumption of RDD is that the density of the forcing variable, which in our case is acreage, is continuous at the cut-off (McCrary, 2008). Basically, the test tries to see if any non-beneficiary farmers are able to manipulate their landholdings around the cut-off acre to become eligible for debt relief. While Chart 3a shows the histogram of acreage for the entire range, Chart 3b shows the estimated density test of Calonico et al., 2015. The charts show some reduction in the bins near the cut-off as beneficiary farmers are more than three-fourth of the total farmers in Tamil Nadu as a whole. The estimated statistic of the density test is -0.306 at the p-value of 0.759, thereby failing to reject the null hypothesis of no difference in the treated and control observations at the cut-off.6 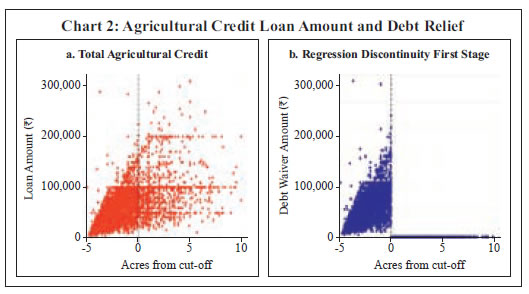 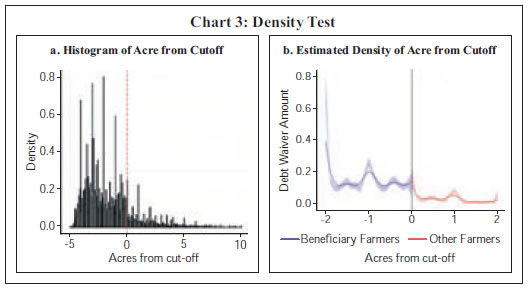 Another validity check of the RDD is that the treatment should not have impacted the pre-treatment variables. If the treatment, i.e., loan waiver, has impacted the variables which are determined before the debt waiver announcement, then the RDD is not valid. Chart 4 presents this validity result, i.e., balance covariate test on the control variables, which indicates that the treatment has no impact on the sanctioned amount and on interest payment, which are predetermined before the announcement of debt waiver. These tests confirm that none of the design assumptions of RDD analysis are violated. Section IV Empirical Results Major Findings Hypothesis 1: Why is agricultural loan default low despite farmers facing financial stress and what are the sources of funds for repayment? Loan default in agricultural loans taken from co-operatives was found to be low among the surveyed farmers at the time of the waiver, i.e., as at end-March 2016. Overdues in crop loans availed during 2015–16 accounted for merely 0.5 per cent of total crop loans for small and marginal farmers and 2 per cent for other farmers. One of the stated reasons was the impact of loan defaults on credit history, which would hamper their future access to credit. Furthermore, prompt repayment of crop loans obtained from co-operatives gets the benefit of full interest relief by the state government (see Annex 5 for details). Co-operatives, therefore, encouraged farmers to pay on time as this would not only enable them to avail interest rate relief but also make them eligible for fresh crop loans which were, in general, higher than the retired loans, in keeping with periodic revisions in the scale of finance. Thus, given the past experience of waiver benefit being extended to both overdue and running loans, the farmer would stand to gain if and when such waiver schemes are implemented. Reputation risk and the fear of losing their collateral, in case of crop loans extended against the pledge of jewels, also influenced farmers’ repayment behaviour. However, the survey found that farmers who paid from their own sources constituted around half of the total number of farmers interviewed (Chart 5). Although 25 per cent of the respondents stated that they relied on relatives and friends to provide funds for repayment, the high interest rates observed for these loans indicate that such loans could have also been obtained from moneylenders/traders. So more than a third of the repayment funds come from informal sources, often at very high costs. These loans get settled as soon as the co-operatives extend fresh loans to the farmers which, in most cases, is within a month from repaying the earlier loan. Hence, despite having to borrow at high interest rates in order to repay crop loans on time, the overall cost of borrowing for the farmer is low, considering that such prompt repayment of loans from co-operatives renders the loans virtually interest-free. 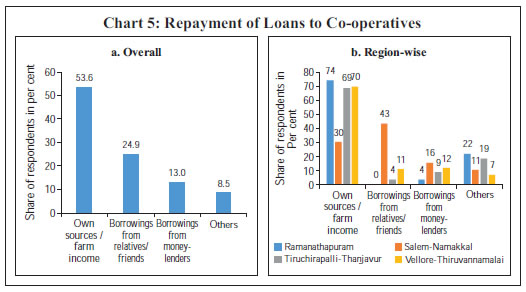 Region-wise analysis shows greater reliance of farmers in Salem– Namakkal districts on informal, high-cost borrowings for repayment of loans from co-operatives, with only 30 per cent of the surveyed farmers stating that they relied on their own sources for repayment. Although sole reliance on cultivation income is low, with over 90 per cent of the surveyed farmers also earning income from livestock (Annex 4), often this was just sufficient to take care of their sustenance in case of crop failure, as was the case in 2015–16 and 2016–17. Reputation risk was found to play an important role in farmers of this region resorting to such high-cost means, albeit for a short time period, as explained earlier, to ensure prompt repayment of their crop loans. Farmers in Tiruchirapalli–Thanjavur districts were found to rely less on borrowings from informal sources to repay their loans. About three-fourths of the surveyed farmers in these districts stated that they were able to settle their loans from their own sources, using the returns on their farm produce when the crop is good and from crop insurance claims, when there is crop damage. Insurance also plays an important part in mitigating the risks faced by farmers from Ramanathapuram district. As this region is more drought prone, most farmers were found to have taken insurance cover. In fact, the farmers in this district access co-operatives more for crop insurance purposes and less for agricultural loans. With relatives of many farmers here working in the Gulf, remittances are also an important source of income as well as means of repayment for agricultural loans. Hypothesis 2: Post-waiver access to short-term agricultural credit is higher for non-beneficiary farmers as compared to beneficiary farmers. Having satisfied the preconditions for using RDD analysis through the validity checks as described in Section III, we proceed to see if there is any difference between beneficiary and non-beneficiary farmers in accessing credit in the post-debt waiver period. For this analysis, we have used transaction-level data of all the farmers who have obtained crop loans in 2015–16. The dependent variable is 1 if the farmers have subsequently obtained credit from the co-operatives either in 2016–17 or in 2017–18, and 0 otherwise. The empirical results based on local linear RDD estimates using Coverage Error Rate (CER) optimal bandwidth (Calonico et al., 2018) show that the probability of obtaining credit post-waiver is higher for farmers just above the cut-off acreage than for beneficiary farmers just below the cut-off (Chart 6). As a robustness check, we also estimated the average treatment effect using other bandwidths suggested in existing literature, viz., Mean Squared Error (MSR) optimal bandwidth and Imbens–Kalyanaraman bandwidth (Calonico et al., 2015; Imbens and Kalyanaraman, 2012). We have also conducted the RDD test by manually restricting the bandwidth to 1 acre on either side of the cut-off. We find that our results hold across estimates obtained using different bandwidths. 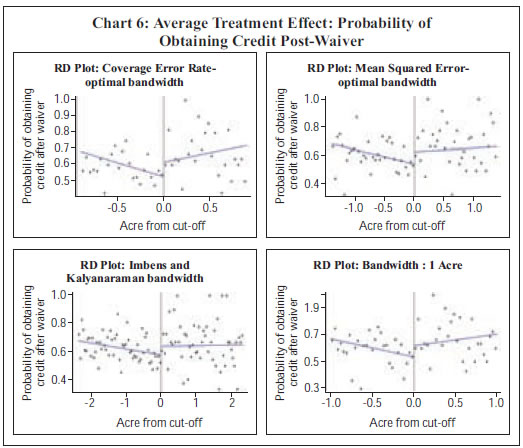
| Table 5: Regression Discontinuity Effect of Obtaining Credit after Debt Waiver in 2016–17 or 2017–18# | | | CER – Optimal Bandwidth | MSE – Optimal Bandwidth | Imbens – Kalyanaraman Bandwidth | Bandwidth – 1 Acre | | Average Treatment Effect (ATE) | 0.083*** | 0.076*** | 0.084*** | 0.066*** | 0.062*** | 0.062*** | 0.085 | 0.062*** | | Standard Error | 0.048 | 0.047 | 0.049 | 0.045 | 0.039 | 0.045 | 0.056 | 0.045 | | Pr(>|Z|) | 0.082 | 0.082 | 0.087 | 0.096 | 0.077 | 0.083 | 0.123 | 0.083 | | Clustered | No | Yes | No | Yes | No | Yes | No | Yes | #: Up to December 15, 2017.
Note: *, ** and *** represents significance at the standard 1 per cent, 5 per cent and 10 per cent confidence interval. | Table 5 reports the RDD analysis for various bandwidths with robust estimator for variance-covariance estimator as well as clustered at different regional levels. The optimal bandwidth chosen based on CER with local polynomial order results in a bandwidth of 0.89 acre on either side of the cut-off. MSE optimal bandwidth was estimated at 1.39 acres and the Imbens–Kalyanaraman bandwidth results in a longer bandwidth of 2.37 around the cut-off. All the results for these bandwidths show that the probability of obtaining credit post-debt waiver is higher for non-beneficiary farmers than for beneficiary farmers and these results are significant at the 10 per cent level. In order to understand whether the differential treatment of beneficiary farmers and non-beneficiary farmers in obtaining credit post-waiver persisted over time, we did two separate RDD analyses for credit obtained in 2016–17 and 2017–18, respectively. Table 6 shows a statistically significant result for 2016-17, i.e., the probability of obtaining credit, was very high for non-beneficiary farmers as compared with beneficiary farmers in the year after the debt waiver. This result holds across different bandwidths with robust estimators as well as when controlled for clusters at the regional level and were found to be significant at 1 per cent level. However, our results did not hold when we ran the RDD on the transaction data for credit obtained in 2017–18, indicating that there is no differential treatment in obtaining credit between the beneficiary farmers and non-beneficiary farmers. The coefficients turned from positive to negative and the estimators were not significant (Table 7). | Table 6: Regression Discontinuity Effect of Obtaining Credit after Debt Waiver in 2016–17 | | | CER – Optimal Bandwidth | MSE – Optimal Bandwidth | Imbens – Kalyanaraman Bandwidth | Bandwidth – 1 Acre | | Average Treatment Effect (ATE) | 0.187* | 0.186* | 0.190* | 0.181* | 0.134* | 0.134* | 0.182* | 0.134* | | Standard Error | 0.054 | 0.048 | 0.052 | 0.046 | 0.04 | 0.041 | 0.056 | 0.041 | | Pr(>|Z|) | 0 | 0 | 0 | 0 | 0 | 0 | 0.004 | 0 | | Clustered | No | Yes | No | Yes | No | Yes | No | Yes | | Note: *, ** and *** represents significance at the standard 1 per cent, 5 per cent and 10 per cent confidence interval. | Discussion on the Findings Cognisance of the following factors may be taken in understanding and interpreting the empirical results presented above. Verification of Accounts Eligible for Loan Waiver Loan waivers in the past were fraught with allegations of misuse and misappropriation of funds. Hence, the state government engaged the administrative machinery to verify the accounts eligible for loan waiver to ensure that only intended farmers are benefitted. This slowed down the sanctioning and disbursal of loans to beneficiary farmers, i.e., small and marginal farmers, during the first half of 2016–17. Further, loan disbursement to both beneficiary and non-beneficiary farmers during November–December 2016 was adversely affected by the withdrawal of specified bank notes (SBNs) and the consequent cash withdrawal limits. As PACCS were maintaining individual accounts with DCCBs, they could not withdraw more than ₹24,000 per week during this period for onward lending to farmers. | Table 7: Regression Discontinuity Effect of Obtaining Credit after Debt Waiver in 2017–18# | | | CER – Optimal Bandwidth | MSE – Optimal Bandwidth | Imbens– Kalyanaraman Bandwidth | Bandwidth – 1 Acre | | Average Treatment Effect (ATE) | -0.01 | -0.017 | -0.01 | -0.019 | -0.01 | -0.01 | 0 | -0.01 | | Standard Error | 0.037 | 0.077 | 0.039 | 0.076 | 0.039 | 0.071 | 0.055 | 0.071 | | Pr(>|Z|) | 0.921 | 0.943 | 0.935 | 0.946 | 0.991 | 0.991 | 0.82 | 0.991 | | Clustered | No | Yes | No | Yes | No | Yes | No | Yes | #: Up to December 15, 2017.
Note: *, ** and *** represents significance at the standard 1 per cent, 5 per cent and 10 per cent confidence interval. | Role of Relationship Banking Recovery problem was noticed in a few cases of loans extended to non-beneficiary farmers, after announcement of the waiver by the Tamil Nadu government, as they deferred payments in anticipation of the state government extending the waiver scheme to them. Since the co-operatives work on the basis of relationship banking principle, wherein they develop a close relationship with their member borrowers over time, they encouraged the non-beneficiary farmers to make prompt payment on crop loans in order to avail interest relief, with the promise of fresh loans at the earliest. Reduction in Recyclable Funds Prompt repayment of crop loans was incentivised by the state government through the provision of interest relief from 2007–08 onwards. Interest incentive payments increased sharply in 2009–10, consequent to the state government granting full interest relief. Since then the interest incentive payout has been steadily increasing. It had reached the highest in 2014–15, the year prior to loan waiver, indicating that crop loans were, in general, paid on time (Chart 7). Interest incentive fell sharply in 2015–16, the year reckoned for the waiver. Hence, for those co-operatives which were receiving prompt repayments from farmers, the waiver entailing staggered reimbursement from the government, reduced their recyclable funds.7 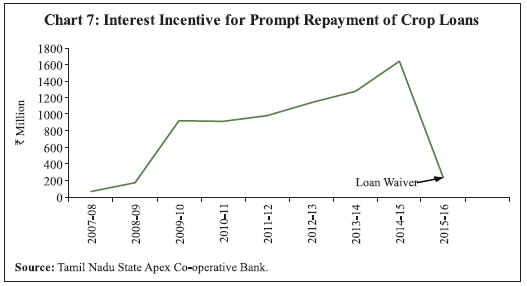 Further, loanable funds of DCCBs were affected by the delay in receiving reimbursement from the government. It may be noted that agricultural loans are disbursed by PACCS with funds from NABARD, TNSCB and DCCBs. As TNSCB is the channel for NABARD funds, which are paid as and when due, reimbursement of NABARD funds was first given by the state government in 2016–17.8 Reimbursement of loans waived by the co-operatives, which was to be staggered over a five-year period, commenced only in 2017–18, with the payment of both the instalments for 2016–17 and 2017–18 along with interest due. Reflecting this, the share of funds from DCCBs in the total crop loan given by co-operative institutions declined to 27 per cent in 2016–17 from around 40 per cent in 2015–16 (Chart 8). New Borrowers after Debt Waiver: Indicative of Moral Hazard? At the time of undertaking the survey, post-waiver loans were not due for repayment. Hence, repayment behaviour of the beneficiary farmers could not be studied to check for moral hazard stemming from the debt waiver. We, therefore, tried to see if there was an increase in new borrowers post-waiver. We found that there were many new borrowers, mostly from the marginal and small farmers’ categories. These borrowers could have joined in anticipation of future loan waivers. Anecdotal evidence also suggests that some large farmers had divided their landholdings amongst family members in order to become eligible for any future agricultural loan-waiver scheme. This can not only lead to fragmentation of landholdings but also create a moral hazard problem. Section V Concluding Observations and the Way Forward The Tamil Nadu agricultural loan waiver scheme, 2016 was effectively implemented, as is evident from all surveyed farmers who were eligible for the loan waiver being given the benefit by September 2016, i.e., within three months of the issuance of the circular to this effect. However, co-operatives faced funding constraints in the year of implementation, i.e., 2016–17, due to the combined impact of loan waiver and cash withdrawal limits placed during the period of SBN withdrawal, which affected their lending. Our study attempted to test the hypothesis that post-waiver credit access for non-beneficiary farmers is more than that for beneficiary farmers near the cut-off acreage. Based on transaction-level data from the surveyed PACCS, we found that near the cut-off acreage, the probability of non-beneficiary farmers getting loans from the co-operatives was higher than beneficiary farmers in the immediate period post-waiver, i.e., 2016–17. However, this differential impact was not evident in the subsequent year, with the easing of the constraint on funds, consequent to the receipt of reimbursement from the state government. Hence, the waiver seems to have affected the ability of lending institutions to extend loans rather than their willingness to do so. The state government’s loan waiver scheme has helped to reduce rural indebtedness of small and marginal farmers to a limited extent, insofar as their outstanding borrowings from co-operatives were written off in full as on the identified date. However, the overall indebtedness of farmers to formal as well as informal sectors, continues to remain high. According to data from the All India Debt and Investment Survey (AIDIS) 20139, Tamil Nadu has a higher share of farmer households availing credit from formal channels than the all-India average, but their reliance on informal sources of credit, particularly on professional moneylenders, also continues to be high (38 per cent). This was also confirmed in our field survey findings which show that although overdue loans were low at the time of the waiver, more than a third of the funds for repaying the agricultural loans taken from the co-operatives came from informal sources, often at a very high cost. Moreover, the increase in new borrowers post-waiver, and indications of land division among family members in expectation of future waivers, indicates the moral hazard of having repeated debt waivers. Thus, debt waivers to ameliorate the problems faced by farmers can provide only a temporary relief and not a lasting solution to rural indebtedness. Based on the suggestions received during the discussions with the farmers and domain experts, a holistic approach to address the difficulties faced by the farmers must include the following: (i) Wider Coverage of Crop Insurance: Our survey findings indicated that some of the crops which were widely cultivated in certain regions were not covered under the crop insurance scheme due to lack of crop-cutting experiments on which these yield-based insurance schemes are usually based. Hence, there is a need for comprehensive coverage of major crops. There is also a need to simplify the insurance application procedure, which is presently time-consuming, and also to reduce delays in settlement of claims. (ii) Reduction in the Reliance on Informal Sources of Credit: Most farmers covered in our survey stated that the crop-wise scale of finance provided by the co-operatives was inadequate to meet their farming operations. This forces them to borrow from moneylenders at very high costs or pledge their forthcoming produce to traders at very low prices, thereby reducing their pricing power. Enhancing the scale of finance could help in reducing their reliance on informal sources, improving pricing of their produce and thereby increasing their income. (iii) Diversification of Crops: Farmers, particularly in areas which are rain-fed, need to move away from crops which are water-intensive and adopt cropping patterns more suited for the agro-climatic conditions of the region. (iv) Technological Advancements: Better irrigation practices, improved seeds, mechanisation wherever possible and use of innovative farming practices can help reduce costs and improve yields. (v) Increasing Farmers’ Direct Access to Agricultural Markets: Despite various measures taken by the government and non-governmental agencies, agricultural marketing continues to remain weak. In this regard, there is a need to increase farmer producer organisations (FPOs) in the state10 and strengthen them in order to facilitate direct linkage between consumers and farmers and help them to get a remunerative price for farm produce. Farmers may also be trained in post-harvest processing, packing and marketing which would reduce their dependence on private traders. Together with these measures, steps to strengthen agricultural extension services and promotion of greater awareness among farmers about their entitlements under various central and state government schemes would fortify the agrarian economy.
References Calonico, S., Cattaneo, M. D., and Farrell, M. H. (2018). “On the effect of bias estimation on coverage accuracy in nonparametric inference”, Journal of the American Statistical Association, 113(522). Calonico, S., Cattaneo, M. D., and Titiunik, R. (2015). “rdrobust: An R package for robust nonparametric inference in Regression-Discontinuity Designs”, R Journal, 7(1): 38–51. Chakraborty, Tanika and Gupta, Aarti (2017a). “Loan Repayment Behaviour of Farmers: Analysing Indian Households", Indian Institute of Technology, Kanpur, mimeo. http://home.iitk.ac.in/~tanika/files/research/BorrowingBehaviorAT.pdf. Chakraborty, Tanika and Gupta, Aarti (2017b). “Efficacy of loan waiver programs”, Indian Institute of Technology, Kanpur, mimeo. http://home.iitk.ac.in/~tanika/files/research/LoanWaiverAT.pdf. De, S. and Tantri, P. (2016), “Borrowing culture and debt relief: Evidence from a policy experiment’, Indian School of Business WP 2242390. http://dx.doi.org/10.2139/ssrn.2242390. Giné, X., and Kanz, M. (2017). “The economic effects of a borrower bailout: Evidence from an emerging market”, The Review of Financial Studies, 31(5):1752–83. Government of India (GoI) (2014). “Implementation of the debt waiver and debt relief scheme, 2008”, Public Accounts Committee 2013–14, 95th Report, February. Imbens, Guido, and Kalyanaraman, Karthik (2012). “Optimal bandwith choice for the regression discontinuity estimator”, Review of Economic Studies, 79(3): 933–59. Kanz, M. (2016). “What does debt relief do for development?”, American Economic Journal: Applied Economics, 8(4): 66–99. McCrary, Justin (2008). “Manipulation of the running variable in the regression discontinuity design: A density test”, Journal of Econometrics, 142(2): 698–714. Mishra, M., Venkatesh, K., P. Tantri, and Nagaraju, T (2017). “Does a Debt Relief Lead to Increased Precautionary Savings?: Evidence from A Policy Experiment”, WP 2729653, 30 May 2017, Indian School of Business. http://dx.doi.org/10.2139/ssrn.2729653. Mukherjee, S., Subramanian, K., and Tantri, P. (2017). ‘Borrower distress and debt relief: Evidence from a natural experiment’, ISB Working Paper. https://rbidocs.rbi.org.in/rdocs/content/pdfs/Dr.%20Krishnamurthy%20Subramanian%20and%20Dr.%20Prasanna%20Tantri_Paper(31082017).pdf. Patel, U.R. (2017). Opening remarks in the seminar on agricultural debt waiver – Efficacy and limitations, Reserve Bank of India, August, 31. https://www.rbi.org.in/Scripts/BS_SpeechesView.aspx?Id=1045. Reserve Bank of India (RBI) (2018). State Finances: A Study of Budgets 2017–18 and 2018–19. Robert, Christopher (2012). ‘Wealth and well-being: Lessons from Indian debt relief’, Harvard University, mimeo. https://scholar.harvard.edu/files/crobert/files/crobert_wealth_and_well-being.pdf. Vydhianathan, S. (2006). ‘Farm loans due to co-operative banks waived for the first time’, The Hindu, 14 May. https://www.thehindu.com/todays-paper/tp-national/tp-tamilnadu/farm-loans-due-to-cooperative-banks-waived-forthe-first-time/article3132976.ece.
| Annex 1: Empirical Literature on Agricultural Debt Waiver and Debt Relief Scheme, 2008 | | S. No | Authors | Objective of the study | Econometric methodology | Key findings | | 1 | Kanz, M. (2016) | To study the impact of debt relief on the economic decisions of recipient households. | Regression Discontinuity Analysis (RDD). Data: (i) Primary data collection from four districts of Gujarat; (ii) bank lists on all debt relief accounts in the sample districts. | - No evidence that debt waiver will lead to access to new loans to finance productive investment, as only 23 per cent of the households in the sample applied for a new loan in the year after the waiver.
- Households that have received larger compensation have reduced their investment in agricultural inputs, mainly due to absence of new bank credit and shift towards more expensive informal credit.
| | 2 | Giné, X. and Kanz, M. (2017) | To estimate the impact of debt waiver on the credit market and the real economy. | Difference in difference (DID) estimation. Data: Panel dataset covering 489 (of 593 total) districts of India from 2001 to 2012. | - Although household debt was reduced and banks increased their overall lending, there was no evidence of greater investment, consumption or increased wages as a result of the bailout.
- Slowdown in post-waiver lending in districts with higher exposure to the waiver scheme, as banks shifted credit to observably less risky regions.
| | 3 | Mukherjee et al., 2017) | To study the causal effect of debt relief on the loan performance of distressed and non-distressed farmers. | RDD and DID Data: Detailed loan-level data for the period May 2005–February 2012 provided by a public sector bank covering three states, viz., Andhra Pradesh, Karnataka and Maharashtra. | - Distressed beneficiaries benefit significantly from debt waiver, but the loan performance of the non-distressed beneficiaries worsens after the waiver.
| | 4 | De and Tantri (2016) | To estimate the effects of ex post loan repayment behaviour of the debt relief recipients and their access to new credit. | RDD and DID Data: Detailed loan-level data for the period October 2005–May 2012 from four districts of the state of Andhra Pradesh. | - No evidence of improvement in ex post behaviour of the waiver beneficiaries.
- Indirect evidence of credit rationing by the loan officers who anticipate adverse borrower behaviour.
| | 5 | Mishra et al. (2017) | To estimate the impact of debt waiver on beneficiaries’ savings and consumption. | RDD. Data: 64th, 66th, and 68th round of the NSSO consumption survey. | - Household consumption level and pattern are unaffected by the waiver.
- However, the beneficiary farmer households have increased the precautionary savings, i.e., increased investment in jewellery in anticipation of higher credit constraints during the post-waiver period.
| | 6 | Christopher, R. (2012) | To estimate the impact of debt waiver on beneficiaries’ wealth and well-being. | RDD. Data: Primary data collection from four districts of Gujarat. | - The marginal effect of income due to debt relief on life satisfaction is found to be positive.
- However, it also has a countervailing negative effect due to social stigma.
|
| Annex 2: Recent Loan/Debt Waiver Schemes of State Governments: A Comparison | | States/Year of implementation | Farmer category | Institutions | Loan category | Period of loan | Limit per farmer | Payment of waiver amount to lending institutions | Cost to the state exchequer
(₹ Billion) | | 1 | 2 | 3 | 4 | 5 | 6 | 7 | 8 | | Tamil Nadu (2016) | Small and marginal farmers | Rural co- operative credit institutions excluding UCBs | All short-term, medium- term and long-term agricultural loans | All loans outstanding as on March 31, 2016 | No limit | Phased reimbursement over five years | 60.95 | | Andhra Pradesh (2014) | All farmers | SCB,RRBs and rural co-operative credit institutions | Short-term crop loans, including those issued against gold and those converted to MT loans due to calamities | Loans outstanding as on March 31, 2014 | Up to ₹150,000; only one loan per farmer | Phased reimbursement over five years | 240.00 | | Telangana (2014) | All farmers | SCBs, RRBs and rural co-operative credit institutions (including UCBs) | Short-term crop loans, including those issued against gold and those converted to MT loans due to calamities | Loans outstanding as on March 31, 2014 | Up to ₹100,000; only one loan per farmer | Phased reimbursement over 4 years | 170.00 | | Karnataka (2017) | All farmers | Rural co- operative institutions | Crop loans | Loans outstanding as on June 20, 2017 | Up to ₹50,000 per farmer; only one loan per farmer | Payment by June 2018 or as and when the claim is raised by the lending institutions | around 80 | | Karnataka (2018) | All farmers | SCBs, RRBs,Co- operative credit societies/banks excluding UCBs | Crop loans | Crop loans from SCBs/RRBs sanctioned on or after April 1, 2009 and classified as NPA/ restructured/overdue and outstanding as on December 31, 2017 (incentive up to ₹ 25,000 would be paid to farmers who have repaid their crop loans within time); crop loans from co- operatives outstanding as on July 10, 2018 | Up to ₹ 200,000 for overdue loan from SCBs per farmer; up to ₹ 100,000 for outstanding loans from co-operatives | Phased reimbursement in four instalments | around 400 | | Uttar Pradesh (2017) | Small and marginal farmers | SCBs and RRBs, Co-operative credit societies/ banks excluding UCBs | Crop loans including those converted to MT loans due to calamities but excluding loans given by self-help groups and joint- liability groups | All loans outstanding as on March 31, 2016, reduced by repayments/credit received from the farmer during 2016–17 | Loans up to ₹100,000; all NPA loans of small and marginal farmers up to ₹100,000 | Payment of entire waiver amount within the year | 360.00 | | Maharashtra (2017) | Small and marginal farmers | SCB,RRBs, Grameen banks and DCCBs | Crop loans and term loans | Loans availed after April 2009 and which were in default as on June 30, 2016 | Up to ₹150,000 per farmer; incentive up to ₹25,000 for farmers who have paid their loans by July 31, 2017 | Payment of entire waiver amount within the year | 345.00 | | Punjab (2017) | Small and marginal farmers | Co-operative credit institutions (including UCBs); public sector banks and private sector banks in that order | Crop loans | Outstanding liability (principal and interest) as on March 31, 2017. Interest relief for the period April 1, 2017 till October 19, 2017 (date of notification) | Up to ₹200,000 for crop loans for small and marginal farmers; flat rate of ₹200,000 for other loans taken by marginal farmers | Phased reimbursement to banks starting with co-operative institutions | 100.00 | | Rajasthan (2018) | (a) Small and marginal farmers (b) Other farmers | Rural co- operative institutions and primary land development banks | Crop loans | Overdue loans and loans outstanding up to September 30, 2017 | For small and marginal farmers, loans up to ₹50,000 to be waived; for other farmers, loan waiver to be worked out on proportionate basis linked to the prescribed land holding of small farmers (2 hectares), subject to the limit of ₹50,000. | ₹20 billion has been provided. The government has in principle agreed to pay the rest in equal instalments in next 3 years. | 80.00 | | Note: 1. SCBs: Scheduled Commercial Banks; RRBs: Regional Rural Banks; UCBs: Urban Cooperative banks; MT: Medium Term. 2. Compiled on the basis of available information up to December 15, 2018. |
| Annex 3: Rainfall Pattern | | S. No | Districts | 2013–14 | 2014–15 | 2015–16 | | | | SW Monsoon | NE Monsoon | SW Monsoon | NE Monsoon | SW Monsoon | NE Monsoon | | | | Particulars | Particulars | Particulars | Particulars | Particulars | Particulars | | 1 | Namakkal | N | D | D | N | N | D | | 2 | Ramanathapuram | D | D | D | E | N | N | | 3 | Salem | N | D | N | N | D | D | | 4 | Vellore | N | D | N | D | N | LE | | 5 | Tiruvannalamalai | N | D | N | D | N | N | | 6 | Thanjavur | N | D | D | N | D | E | | 7 | Tiruchirappalli | D | D | D | D | D | N | Note: LE - Large Excess : Range (+60 per cent and above)
E - Excess : Range (+20 per cent to +59 per cent)
N - Normal : Range (+19 per cent to -19 per cent)
D - Deficient : Range (-20 per cent to -59 per cent)
LD - Large Deficient : Range (-60 per cent to -99 per cent)
No Rain : Range (-100 per cent) | Annex 4: Field Survey Findings The salient features of the field survey are given as follows. Among the surveyed farmers, around 20 per cent of the farmers relied solely on cultivation. Further, in all the surveyed districts it was found that the reliance on cultivation alone, for income, was higher for non-beneficiary farmers then for beneficiary farmers. Region-wise analysis shows that less than one-tenth of farmers in Salem, Namakkal and Ramanathapuram districts relied only on cultivation income, indicating that these farmers undertook other activities to augment their income (Chart A4.1). Animal husbandry was the main source of supplementary income in all the surveyed districts, and in a drought year like 2016–17 it was the primary source of income for many farmers as they suffered extensive crop damage. The Mahatma Gandhi Rural Employment Guarantee Act (MNREGA) scheme provided the second highest income source to small and marginal farmers (Chart A4.2a). Region-wise analysis of sources of non-cultivation income shows considerable diversity. Over 90 per cent of farmers in Salem and Namakkal relied on livestock to augment their incomes. Wages and salaries provided the maximum supplementary income for farmers in Vellore and Thiruvannamalai. Besides livestock, non-agricultural enterprises and remittances from abroad were the other main sources of non-cultivation income for farmers in Ramanathapuram (Chart A4.2b). 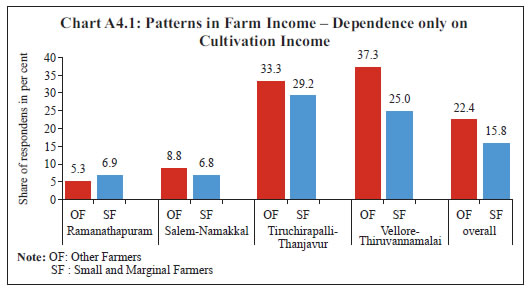 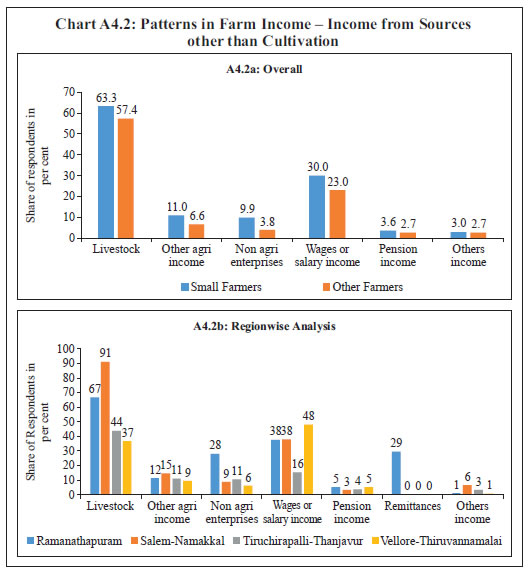 A comparison of cost vis-à-vis income for the two farmer groups indicates that agricultural incomes for both groups in 2016–17 were not commensurate with their costs (Chart A4.3). This was more stark in the case of other farmers wherein the proportion incurring cost below ₹50,000 was less than one-fourth of the total in that category, but the proportionate earning income of less than ₹50,000 was around 58.7 per cent. As cost for other farmers are higher than for small and marginal farmers, the impact of a drought has been more severe on their incomes. Annex 5: Interest Incentive Scheme for Prompt Repayment of Crop Loans With a view to encourage credit discipline, the state government started providing interest incentive to farmers from 2007–08 for prompt repayment of their crop loan up to ₹ 3,00,000. This incentive, which was initially 2 per cent in 2007–08 and 2008–09, worked out to 6.0 per cent (after adjusting for prompt repayment incentive of 1 per cent provided by the Government of India) in 2009–10, when the state government decided to waive the entire interest for crop loans which are paid on time (Table A5.1). With the Government of India progressively raising the interest incentive component to 3 per cent since 2011–12, the net interest incentive given by the Tamil Nadu government works out to 4 per cent. | Table A5.1: Interest Incentive Scheme for Prompt Repayment of Crop Loans obtained from Co-operatives | | Year | Interest rate on crop loans up to ₹ 300,000 | Interest incentive for prompt repayment | Effective interest rate to farmers for prompt repayment of crop loans from co-operatives | | Government of India | Government of Tamil Nadu | | 1 | 2 | 3 | 4 | 5=2-3-4 | | 2007-08 | 7.0 | - | 2.0 | 5.0 | | 2008-09 | 7.0 | - | 3.0 | 4.0 | | 2009-10 | 7.0 | 1.0 | 6.0 | Nil | | 2010-11 | 7.0 | 2.0 | 5.0 | Nil | | From 2011-12 onwards | 7.0 | 3.0 | 4.0 | Nil | | Source: Authors’ compilation from various budget documents of Government of India and Government of Tamil Nadu. |
|