Joice John, Arghya Kusum Mitra,
Janak Raj and Deba Prasad Rath* This paper assesses the impact of asset quality of banks in India on monetary transmission. This is attempted through a detailed analysis of determinants of net interest margin (NIM). Using quarterly data for the period (Q1:2010-11 to Q1:2017- 18) and dynamic panel data regression, the study finds that credit risk, proxied separately by the gross non-performing assets (NPA) ratio and the stressed assets ratio (NPA plus restructured assets), had a statistically significant and positive impact on the NIM of scheduled commercial banks, suggesting that deterioration in asset quality impeded monetary transmission. The analysis of two sub-periods suggests that monetary transmission was impaired through the interest rate channel when the gross NPA ratio was at a relatively low level but rising. At a high level of gross NPA ratio, NIMs came under pressure as banks were not able to sufficiently increase their spreads in a competitive market to compensate for credit risk. However, banks became risk averse and reduced their loan exposures, which impacted monetary transmission through the lending channel. This was further corroborated by the results of bank group-wise analysis. Overall, it emerges that the deterioration in asset quality has impaired monetary transmission in India. JEL Classification : E43, E44, E5 Keywords : Net interest margin, Asset quality, Non-performing assets, Monetary transmission Introduction Robust monetary policy transmission is a sine qua non for achieving the ultimate objectives of monetary policy, i.e., growth and inflation. In a bank-dominated financial system, monetary policy impulses are transmitted largely through the banking system. Banks’ financial health could impact monetary transmission, both by amplifying the effect of changes in short-term policy/ money market interest rates on lending interest rates, or by changing banks’ lending standards and their use of non-price measures while sanctioning loans. As such, sound health of the banking system becomes extremely important for effective monetary transmission. A healthy bank with low default risk in its loan portfolio will be able to pass on interest rate changes of the central bank symmetrically on its deposits and loans. On the other hand, a bank faced with a high level of non-performing assets (NPA) – prospective or realised – will seek to build up provisions by loading credit risk premia on its performing loans, thereby pushing up the lending rates and hence its net interest margin (NIM)1. In the process, notwithstanding lower funding costs in response to the policy rate cut by the central bank and comfortable liquidity conditions, banks may not reduce their lending rates or may reduce them only partly, thereby impeding monetary transmission. Thus, movements in NIM of banks, among others, could provide an important indication of the effectiveness of monetary transmission. In India, asset quality of scheduled commercial banks (excluding that of regional rural banks) has deteriorated steadily since 2011.2 The pace accelerated following the withdrawal of regulatory forbearance on restructured advances effective April 1, 20153 and asset quality review (AQR) in July 2015. This resulted in a marked increase in the NPA ratios of domestic commercial banks – both public and private sectors – increasing from 3.4 per cent of gross advances in March 2013 to 4.7 per cent in March 2015, and further to 9.9 per cent by March 2017.4,5 NIM of scheduled commercial banks (SCBs), which had declined from 3.0 per cent in 1999-2000 to 2.2 per cent in 2009-10 – the lowest in 2000s – increased to 2.9 per cent in 2010-11 before secularly declining to 2.5 per cent in 2016-17.6 Returns on assets/equity of public sector banks remained negative during 2015-16 and 2016-17.7 The Reserve Bank’s Sixth Bi-Monthly Monetary Policy Statement of 2016-17 (February 2017), inter alia, noted that “the environment for timely transmission of policy rates to banks’ lending rates will be considerably improved if the banking sector’s non-performing assets (NPA) are resolved more quickly and efficiently…”. In the recent period, deterioration in asset quality and losses incurred by public sector banks, and the prolonged absence of their adequate recapitalisation appeared to have hampered effective monetary transmission through bank lending rates and credit supply.8 There are several studies related to the relationship between NIM and asset quality but do not present a clear picture. While in some countries, deterioration in asset quality is associated with a higher NIM, in some other countries, it is negatively related. However, in advanced economies and emerging market economies, there has hardly been any study focusing on asset quality and monetary transmission. For India also, many studies have estimated the determinants of NIM. However, almost all of such studies have focused on the ownership and regulatory aspects and not much on asset quality.9 Besides, the existing studies on India are based on annual balance sheet data and are somewhat dated as they are prior to the measures taken since 2015 to improve the bank balance sheets. In the above backdrop, this study is an attempt to fill the existing gap in the literature in the Indian context. The study analyses whether and to what extent the recent deterioration in asset quality of banks has impaired monetary transmission. This, in turn, is analysed through the behavior of NIMs of banks. The study focuses on the determinants of NIM for the period Q1:2010-11 to Q1:2017-18 and also for the two sub-periods - Q1:2010-11 to Q1:2015-16 (sub-period I) and Q2:2015-16 to Q1:2017-18 (sub-period II). The sub-period II shows the true picture of the health of banks following AQR. The period under study was marked by two easing and two tightening cycles of monetary policy and lowering of statutory liquidity ratio (SLR), while allowing the increased carve out for the liquidity coverage ratio.10 The period also saw a transition from the Benchmark Prime Lending Rate (BPLR) system to the base rate system in July 2010 and from the base rate system to the marginal cost of funds based lending rate (MCLR) system, effective April 1, 2016. The study is organised in six sections. A brief survey of the literature on asset quality and monetary transmission is presented in Section II. Some stylised facts on the health of the Indian banking system are set out in Section III. Section IV details the methodology of the study. Section V sets out the results, while Section VI sums up the main findings of the study. Section II
Survey of Literature In the literature, asset quality of a bank’s balance sheet is interpreted in terms of credit risk inherent in the loan portfolio. Credit risk in a bank’s asset portfolio, i.e., the probability of a bank asset turning into NPA is proxied by variables such as (i) NPA to total assets/interest income earning assets; and (ii) loan loss provisions to total assets/total loans (Almarzoqi and Naceur, 2015). Most empirical studies – particularly, those relating to advanced economies and a few pertaining to EMEs – show that NPAs are associated with higher spreads (Angbazo, 1997; Maudos and De Guevara, 2004; and Maudos and Solis, 2009). This means that banks are able to cope with the credit risk inherent in their loan portfolio by appropriately pricing it, i.e., by setting the spread on lending rates over deposit interest rates such that banks are able to successfully absorb the loan losses arising out of risky exposures (Marinkovic and Radovic, 2014). Banks, thus charge additional credit risk premia from their borrowers to compensate themselves for higher credit risk in order to protect their margins, meet their targeted return on assets as well as build up loan loss provisions. In contrast, however, there are quite a few studies that show an inverse relationship between NIM and NPA such as those by Brock and Rojas-Suarez (2000) for Latin American countries, Dumicic and Ridzak (2013) for banks in Central and Eastern Europe, Marinkovic and Radovic (2014) for Serbia and Almarzoqi and Naceur (2015) in respect of banks in Caucasus and Central Asia. In their analyses of banks’ interest spreads in Latin American countries, Brock and Rojas-Suarez (2000) observed that in all the countries in the region barring Colombia, “non-performing loans are associated with smaller spreads. This result could be due to inadequate provisioning for loan losses: higher non-performing loans would reduce banks’ income, thereby lowering the spread in the absence of adequate loan loss reserves.” While analysing the determinants of NIM for banks in Caucasus and Central Asian countries, Almarzoqi and Naceur (2015) observed that “a negative correlation between credit risk and interest margins reflects inadequate interest spreads to compensate for provisions for NPAs”. In the case of Serbia also, Marinkovic and Radovic (2014) noted that while banks attempt to charge a higher spread on the performing loans, their ability to do so may get constrained by the degree of competition in the banking industry. They found that contrary to what is suggested by theory, there was a statistically significant and inverse relation between default risk and the NIM. The ratio of loan loss reserves to gross loans was used to capture the default risk. Because of rules imposed on the banks by the regulator, banks are unable to window-dress the NPA figures. From the inverse relationship between default risk and the NIM, they inferred that there were inadequate build-up of loan loss reserves by banks. Secondly, following Fisher (1933), they argued that changes in banks’ exposure to default risk coincide with credit cycles. During normal times, banks re-price existing loans when they become due, to protect their margins, as default risk rises. However, in recessionary times, banks may turn risk averse resulting in credit crunch, which cause both lending rates and lending volumes to fall, resulting in decline in NIM, all factors considered. Dumicic and Ridzak (2013) measured the influence of NPA on NIM through the coverage of impaired loans with reserves for banks in Central and Eastern Europe. They found that reserves for impaired loans are significantly negatively correlated with NIM. They inferred that the negative correlation between impaired loans and NIM was due to the fact that banks were not allowed to charge interest accrued on bad loans. Mispricing of risk and inadequate build-up of loan loss provisions result in an inverse relationship as also found by a few other studies such as Williams (2007), Hesse (2007) and Chortareas et al. (2010). A third possibility is countercyclical provisioning by banks so that provisions for bad loans are used as a tool for income smoothing (Fonseca and Gonzalez, 2008). Thus, during good times, provisions made are higher than the expected losses but are lower during bad times. In that case, the link between NPA and NIM may become ambiguous (Dumicic and Ridzak, 2013). There have been some studies on the impact of asset quality of Indian banks on the NIM of banks, though the focus of most of these studies has been on the influence of ownership on NIM. Kannan et al. (2001) found that NPA impacted NIM negatively and significantly. Using balance sheet data of scheduled commercial banks (excluding regional rural banks) for the period 1997-98 to 2000-01, Sensharma and Ghosh (2004) found that high NPA caused NIM to decline and attributed it to banks’ shifting their loan portfolio in favour of less risky assets that yield lower return. They concluded that not only low NIM characterises a bank with high NPA, but also that low current NIM is the result of high NPA in the past. In his study on the impact of global financial crisis on NIM, Das (2013) found that it was foreign banks whose margins came under pressure due to NPA; the average NPA of foreign banks was found to be around 18 per cent during 2001-05 as against less than 10 per cent for other bank groups. Thus, all the studies in the Indian context have found an inverse relationship between asset quality and NIM. Given the complex nature of the relationship between asset quality and NIM, various alternative and apparently contrasting hypothetical scenarios can be worked out, insofar as their impact on monetary transmission is concerned. This exploits the mathematical identity of profits as the difference between income and expenditure net of provisions (a proxy for NPA), and decomposing income/expenditure into interest and non-interest income/ expenditure, respectively, and dividing each of the variables by total assets. This then allows one to work out several scenarios of the relationship between NIM, return on assets, net non-interest income and provisions (Annex I).11 We start with the baseline scenario where the banks maintain provisions at a prudent level, i.e., aligned with the level of NPA (Scenario A). Also, the banks are able to maintain their return on assets (RoA) at the targeted level. In the baseline scenario, NIM is assumed at 2.5 per cent of total assets. Now, if there is a deterioration in asset quality entailing higher provisioning requirement (from 2.0 per cent of total assets to 2.3 per cent), banks would be prompted to load credit risk premia on lending interest rates on fresh loans or when the existing loans are due and renegotiated, so as to maintain their profitability at the targeted level. This would increase the NIM to 2.8 per cent (Scenario B). The wedge between lending and deposit rates can increase further under the easing monetary policy stance of the central bank that lowers the funding costs. As a result, the interest rate channel of monetary transmission gets impeded. This, of course, presumes that the banks facing asset quality issues are able to price risk appropriately, as also possess pricing power, which enable them to demand higher lending rates and maintain higher NIM. Some of the studies mentioned earlier, especially those pertaining to emerging market economies, show that the banks often lack pricing power and are unable to raise their NIM by loading higher credit risk premia. In that case, banks can raise their provisions to the prudent level only at the cost of a decline in bank profitability by an equal amount (Scenario C). In this scenario, monetary transmission is not impeded initially as credit risk premia and hence, NIM remains unchanged. However, over the medium term, the decline in profitability can have implications for bank capital and that could constrain bank’s capacity to lend, particularly if the bank’s capital is at the regulatory minimum. Thus, monetary transmission in this case could get impacted through the bank lending channel. Faced with higher NPA, the only option through which banks can maintain NIM at the baseline level as also the targeted RoA is by under-provisioning, i.e., keeping provisions at a lower than the prudent level (Scenario D). By under-provisioning, banks can report artificially higher profitability (Brock and Rojas-Suarez, 2000). Banks can also camouflage NPA through loan restructuring as was done in India prior to AQR (Vishwanathan, 2016). The reported figures of NPA and NIM then do not reveal the true health or efficiency of the banking system. Banks can continue to report healthy credit growth, but only through ‘ever greening’ or ‘zombie lending’. However, there is no ‘real’ monetary transmission in this case. At times, banks may be compelled to make higher provisions and cover expected losses, and in the process, have to lower their profit expectations (RoA) as also their NIM (Almarzoqi and Naceur, 2015) (Scenario E). In this scenario, lower NIM is not a proof of an efficient interest rate channel of monetary transmission, as lower return on assets may weaken the bank’s lending channel of transmission as banks may get capital constrained. Finally, there may be an extreme case, i.e., the NPA situation is so grim that even after under-provisioning, banks may face lower return on assets and also a lower NIM (Scenario F). This situation is not at all inconsistent with an increase in the risk premia charged by banks. It only means that in a competitive market, banks cannot increase NIM by hiking the risk premia too high due to fear of losing customers and they are in such a financially precarious position that they are neither able to maintain their return on assets at the targeted level, nor make full provisions. Thus, an increase in risk premia that impede transmission is consistent with a fall in NIM and RoA as also under- provisioning. Section III
Key Indicators on Health of Banks – Some Stylised Facts The bank level quarterly data (72 select scheduled commercial banks – 26 public sector banks, 19 private sector banks and 27 foreign banks) on NIM and various indicators of health of individual bank balance sheets collated from RBI’s supervisory returns (RBI OSMOS database) for the period from Q1:2010-11 to Q1:2017-18 suggest the following: first, despite the gross NPA to total assets ratio rising three times and the stressed assets to total assets ratio twice for the median bank, SCBs were by and large able to protect their NIM, which declined only marginally by 7 bps during the period – 4 bps during sub-period I (Q1:2010-11 to Q1:2015-16) and 3 bps during sub-period II (Q1:2015-16 to Q1:2017-18)12 (Table 1). Across bank groups, the median NIM of private sector banks remained unchanged during sub-period I and increased marginally by 2 bps during sub-period II. NIM of public sector banks declined by 16 bps during the full period (10 bps in sub-period I and 6 bps in sub-period II) as against a decline of 11 bps in the case of foreign banks. Thus, over the entire period, while NIM of SCBs remained broadly unaffected despite a sharp spurt in gross NPA/stressed asset ratios, NIM of public sector banks was impacted to an extent. | Table 1: Key Indicators of Bank Balance Sheet: Median | | (Per cent of Assets) | | Quarter | NIM* | Gross NPA | Stressed Assets | CRAR | Return on Assets | | Public Sector Banks | | Q1:2010-11 | 0.66 | 1.36 | 3.03 | 12.44 | 1.02 | | Q1:2015-16 | 0.56 | 3.83 | 9.18 | 11.06 | 0.41 | | Q1:2017-18 | 0.50 | 8.91 | 11.26 | 11.65 | -0.28 | | Private Sector Banks | | Q1:2010-11 | 0.74 | 1.03 | 1.95 | 14.52 | 1.36 | | Q1:2015-16 | 0.74 | 1.38 | 4.56 | 13.23 | 1.01 | | Q1:2017-18 | 0.76 | 2.31 | 2.76 | 14.42 | 0.99 | | Foreign Banks | | Q1:2010-11 | 0.86 | 0.91 | 1.08 | 25.84 | 1.68 | | Q1:2015-16 | 0.79 | 0.53 | 0.54 | 19.25 | 1.62 | | Q1:2017-18 | 0.75 | 0.90 | 1.38 | 21.67 | 1.38 | | Scheduled Commercial Banks | | Q1:2010-11 | 0.69 | 1.09 | 1.85 | 14.06 | 1.21 | | Q1:2015-16 | 0.65 | 2.02 | 4.59 | 13.06 | 0.81 | | Q1:2017-18 | 0.62 | 2.88 | 4.05 | 13.65 | 0.61 | Note: CRAR: Capital to Risk-Weighted Assets Ratio.
RoA: Return on Assets (Annualised).
All variables (barring CRAR) are ratios to total assets.
*: Quarterly (Not annualised).
Source: RBI OSMOS Database. | The decline in NIM of public sector banks (vis-à-vis a marginal rise for private sector banks) does not suggest that public sector banks were more efficient in transmitting monetary policy signal. Rather, the decline in NIM coupled with a sharp fall in the RoA (the latter turning negative during the second phase) was a tell-tale sign of vulnerabilities in the health of public sector banks that turned them risk averse. Public sector banks slowed down the expansion of credit as they did not receive fiscal support for recapitalisation, nor could they raise capital from the market during the period of study, thereby chocking the bank lending (credit) channel of monetary policy transmission. | Table 2: Distribution of Indicators (Q1:2010-11 to Q1:2017-18) | | Variable | Mean | Median | SD | 5th Percentile | 95th Percentile | | NIM* | 0.72 | 0.67 | 0.36 | 0.37 | 1.24 | | Gross NPA | 2.20 | 1.55 | 2.30 | 0.00 | 7.24 | | Stressed Assets | 3.97 | 3.02 | 3.76 | 0.00 | 11.36 | | CRAR | 22.40 | 13.71 | 34.13 | 10.30 | 56.59 | | RoA | 1.03 | 0.93 | 2.11 | -1.39 | 3.78 | | Non-interest Income | 0.49 | 0.26 | 0.95 | 0.07 | 1.67 | | Operating Expense | 0.64 | 0.44 | 0.82 | 0.23 | 1.82 | Note: CRAR: Capital to Risk-Weighted Assets Ratio.
RoA: Return on Assets (annualised).
All variables (barring CRAR) are ratios to total assets.
*: Quarterly (not annualised).
Source: RBI OSMOS Database. | The distribution of indicators shows that there was a wide variationin credit risk among banks. The gross NPA ratio of banks ranged from nil(5th percentile) to 7.24 per cent (95th percentile) (Table 2). The relationship between NIM and gross NPA ratio for two sub-periods for various bank groups was analysed using scatter plots (Chart 1). The scatter plots show a negative relationship between NIM and the gross NPA ratio for each of the bank groups and during both the phases. The slope is steeper for public sector banks during the latter sub-period marked by the deterioration in the gross NPA ratio, implying that at a higher level of gross NPA ratio, public sector banks were unable to protect their NIMs. The flatter slope in the initial phase, when the gross NPA ratio on an average was much lower, indicates that as gross NPA ratio rises from a low level, NIM remained unaffected. Thus, the relationship between the gross NPA ratio and NIM is non-linear – a flatter slope at lower level of gross NPA ratio and a steeper slope otherwise. The median individual bank-wise data suggest that the deterioration in asset quality of public sector banks was much more pronounced vis-à-vis private sector banks or foreign banks. The story is similar if the data for bank groups are aggregated. The gross NPA ratio of public sector banks increased from 3.8 per cent at end-March 2013 to 5.4 per cent at end-March 2015 and further to 12.5 per cent at end-March 2017, while that of private sector banks increased from 1.9 per cent to 2.2 per cent to 3.5 per cent over the same period.  Contemporaneously, banks increased their provision coverage ratio (PCR) - from 40.3 per cent at end-March 2014 to 41.9 per cent in March 2016 and further to 43.5 per cent at end-March 2017; this, however, fell short of the objective to have “clean and fully provisioned bank balance sheets by March 2017” (Rajan, 2016). With provisions and contingencies increasing by 45.2 per cent at end of 2015-16 (₹2,094 billion), net profits shrank by 61.7 per cent.13 Provisions and contingencies increased further by ₹2,437 billion at end of 2016-17, reflecting the continued stress in asset quality. Net NPA increased to ₹4,331 billion (5.3 per cent of net advances) at end of 2016-17 from ₹3,498 billion (4.4 per cent of net advances) a year earlier, reflecting the requirement for further provisioning in the years to come.14 Section IV
Methodology – Determinants of NIM This section spells out the methodology for estimating the determinants of NIM covering the period Q1:2010-11 to Q1:2017-18 with the thrust being on the impact of asset quality. The relationship between asset quality and NIM can be used to understand the implications for monetary transmission with the different scenarios explained in Annex I and described in Section II. The period of study has been divided into two parts, viz. sub-period I (Q1:2010-11 to Q1: 2015-16) when the gross NPA and stressed assets ratios were low but rising, and sub-period II (Q2:2015-16 to Q1:2017-18) when the gross NPA and stressed assets ratios were relatively high and rising. The determinants of NIM typically used in the literature are grouped under three heads: (i) individual bank-specific factors, (ii) banking sector specific factors, and (iii) macroeconomic factors. Apart from the bank-specific variables, we introduce time and bank-fixed effects in the regression equations. This being a study on banks operating in one country, the macroeconomic variables like growth, inflation and policy rates are uniform across different banks for a given time period and can be appropriately controlled by introducing the time-specific effects in the regression equations. These effects also capture the role of regulatory policies such as the cash reserve ratio and the liquidity coverage ratio, which are common across all banks. Further, introducing time-specific effect is expected to capture even other time-fixed factors that could have otherwise got omitted. Similarly, industry /banking sector specific characteristics such as ownership of banks, labour productivity and competitiveness are more or less subsumed in the bank-fixed effects. Hence, we have used only the individual bank-specific factors as the explanatory variables in the regression equations. The impact of asset quality on NIM being the focus of our study, all other variables need to be controlled so as to understand the relationship between asset quality and NIM. In this backdrop, the determinants of NIM have been estimated with the following model specification: 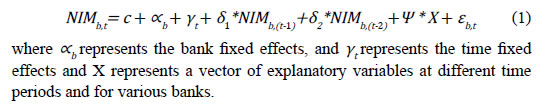 We have used the following variables as regressors for NIM (interest income minus interest expense divided by total assets): lagged NIM (one quarter and two quarter), operating expenditure (measured by operating expenditure to total assets ratio), credit risk (proxied alternatively by the gross NPA to total assets ratio and the stressed assets - restructured assets plus gross NPA - to total assets ratio), capital adequacy measured by the capital to risk-weighted assets ratio (CRAR), profitability measured by return on assets (RoA), bank size (measured by natural logarithm of total assets) and noninterest income (measured by the non-interest income to total assets ratio). All the data were seasonally adjusted with X-12 ARIMA at the bank level. Empirical literature on the determinants of NIM suggests that there is no consensus on the direction (positive/negative association) and the significance of the relationship between bank-specific variables (other than operating cost) and NIM. The relationship also differs across countries, among bank groups (domestic, foreign etc.) and over time. The literature on relationship between asset quality and NIM has already been discussed in Section II. The nature of the relationship of other individual bank-specific variables and NIM as observed in empirical literature is discussed below. i. Operating Cost: Operating cost is a proxy for servicing and monitoring transactions (Almarzoqi and Naceur, 2015). Operating costs include salaries and pensions and other expenses such as depreciation, administrative expenses, occupancy costs, software costs, and lease rental (Dumicic and Ridzak, 2013). There is a consensus in the literature that banks pass on the operating costs to customers. Therefore, an increase in the operating cost increases the net interest margin. Operating costs were found to be the most important driver of interest spreads in the Caucasus and Central Asia (Almarzoqi and Naceur, 2015). ii. Capital Adequacy: The relationship between capital adequacy and NIM is not straightforward. Capital adequacy is a proxy for the creditworthiness of a bank: a bank having higher capital adequacy is likely to be more solvent, which would reduce its funding costs, thereby increasing the NIM. With capital well above regulatory requirement, well-capitalised banks can also afford to invest in riskier assets without facing possible erosion of capital below the stipulated regulatory norms, which can lead to a high spread. Likewise, under-capitalised banks or banks facing capital erosion may be subject to regulatory restrictions, forcing them to adopt risk averse strategy. When the above-mentioned conditions hold, the capital adequacy ratio is found to have a positive and significant impact on banks’ spreads (Saunders and Schumacher, 2000; Brock and Suarez, 2000). Under other circumstances, capital adequacy has a negative and significant impact on NIM (Dumicic and Ridzak, 2013; Tan, 2012; and Almarzoqi and Naceur, 2015). A risk averse but well-capitalised bank may find bankruptcy to be a costly proposition. For a poorly capitalised bank, depositors and not equity holders are at a risk when the bank faces bankruptcy, and the bank may gamble by investing in risky assets to improve its NIM. When such a gamble pays off, such poorly-capitalised banks may have high spreads. Again, there are cases where a statistically significant relationship is not found between capital adequacy and NIM, possibly reflecting the fictitious nature of capital in some countries in Caucasus and Central Asia (Almarzoqi and Naceur, 2015). iii. Return on Assets: A higher return on assets is expected to be associated with a higher NIM. iv. Size: Empirical literature presents contrasting results on the relationship between banks’ net interest margins and size (proxied by the natural logarithm of loans or total assets). Ho and Saunders (1981) and Maudos and Solisc (2009) find a positive relationship because the larger the transaction, the larger the potential loss will be. Maudos and De Guevara (2004) and Angbazo (1997), among others, report a negative association between bank size and interest margins, pointing to the cost reduction attributed to economies of scale. While focusing on the ownership of banks, Sensarma and Ghosh (2004) found that size of Indian banks affected NIM positively and significantly of Indian banks. v. Non-interest Income: More recent studies find that banks with well-developed non-interest income sources have lower net interest margins. This suggests that banks may tend to offer loans with small or even negative margins to attract clients and compensate with higher fees (Dumicic and Ridzak, 2013; Maudos and Solis 2009; and Carbo and Rodriguez 2007, among others). The difference between non-interest income and non-interest expenditure is referred to as ‘burden’ in the literature, measuring the extent of burden it can share with the NIM from the standpoint of profitability (Das, 2013). Kannan et al. (2001) found that the fee income significantly impacted NIMs of Indian banks. Estimation For estimation, we have used dynamic panel data regression technique, using approaches specified by Arellano-Bover (1995) and Blundell-Bond (1998), that is, linear generalised method of moments (GMM). These estimators are suitable in situations where the dependent variable – in the present case NIM – is dynamic and depends on its own past realisations, while the right-hand side variables are not strictly independent, i.e., Hug are correlated with error, and have heterogeneity arising from fixed individual effects – both bank specific and time specific. Arellano-Bover estimator extends Arellano-Bond (1991) estimator, commonly known as “difference GMM”, by incorporating the assumption that first differences of instrument variables are uncorrelated with the fixed effects. This can increase the efficiency of the estimator (Roodman, 2009), as it incorporates two sets of equations and is known as “system GMM”. Further, we have estimated the regressions in an instrumental variable framework, which uses the lagged values of dependent and explanatory variables as instrumental variables (to overcome the problem of endogeneity in the explanatory variables). This is particularly important as many explanatory variables may be endogenous. All the models are estimated with appropriately choosen lags – systematically dropping the insignificant ones – that could produce satisfactory model properties. The robustness of the reported models was tested using model diagnostics tests: (i) difference in Sargan test for over identification – checks for the validity of instruments; and (ii) Arellano-Bond test for first order and second order residual auto correlation – the first order auto correlations should be negative and significant and the second order ones should be insignificant. As alluded to earlier, the regressions were estimated including bank- and time-fixed effects.15 The regressions were first estimated for the full sample period (Q1:2010- 11 to Q1:2017-18) for scheduled commercial banks. However, given the nonlinearity in the impact of asset quality on the net interest margins (as evident from scatter plots in Chart 1), separate regressions were estimated for two sub-periods, viz., (a) sub-period I: Q1:2010-11 to Q1:2015-16; and (b) sub-period II: Q2:2015-16 to Q1:2017-18. Furthermore, regressions were also estimated for different bank groups – public sector banks, private sector banks and foreign banks – for the full sample period. Section V
Results V.1 Results for the Full Sample Period Results in Table 3 suggest that credit risk – proxied separately by the gross NPA and stressed assets (gross NPA plus restructured assets) ratios – impact NIM of SCBs positively, implying that banks in India, generally, charged additional premia to compensate for credit risk, which was reflected in their lending rates. This suggests that deterioration in asset quality did impact monetary transmission through higher NIM (Scenario B in Annex I). Banks either utilised the higher spread to fund loan loss reserves (provisions) or to maintain their return on assets at the targeted level. Though the main purpose of the analysis is to assess the impact of health of banks on monetary transmission, the regression results also provided some other interesting findings. First, operating expense, as expected, was positively related to NIM indicating that less efficient banks, experiencing higher operating costs, require higher NIM. On the other hand, more efficient banks could reduce lending rates, and charge a lower NIM. Second, as expected, non-interest income and NIM were negatively related indicating that banks with higher non-interest income were able to offer lending interest rates on better terms. Third, the capital adequacy ratio, which represents solvency, was found to have a positive relationship with NIM indicating that banks in India seek higher margins to compensate for higher cost of equity. Although the Modigliani-Miller model suggests that it does not matter how a firm is financed in terms of its debt-equity composition, as far as the value of the firm is concerned, it is now widely recognised that equity is more expensive than debt. In the Indian context, banks with excess CRAR (i.e., above their regulatory requirement) were not capital constrained; they may prefer to extend credit rather than invest in lower yielding sovereign bonds or top rated corporate bonds, thus boosting their NIMs. On the other hand, banks that are capital constrained became risk averse, cutting back on lending activity and face a lower NIM. Fourth, the coefficient of bank size – measured by natural logarithm of total assets – was found to be statistically insignificant, suggesting that NIM was not sensitive to the size of a bank. | Table 3: Determinants of NIM of SCBs | | Dependent: NIM | Full Sample | Q1:2010-11 to Q1: 2015-16 | Q2:2015-16 to Q1: 2017-18 | | (1) | (2) | (3) | (4) | (5) | (6) | (7) | | NIM(-1) | -0.0052 | 0.0045 | -0.0204 | -0.0254 | -0.1052*** | -0.1115*** | | (0.7667) | (0.7984) | (0.3771) | (0.2721) | (0.0000) | (0.0000) | | NIM(-2) | 0.0332 | 0.0423** | 0.0005 | -0.003 | 0.0082 | -0.0018 | | (0.1069) | (0.0384) | (0.9819) | (0.8970) | (0.8389) | (0.9653) | | Stressed assets | 0.0067** | | 0.0071* | | -0.0144* | | | (0.0494) | | (0.0728) | | (0.0649) | | | Gross NPA | | 0.0057* | | 0.0211*** | | -0.0202*** | | | (0.0915) | | (0.0013) | | (0.0037) | | Operating expense | 0.4986*** | 0.5066*** | 0.4358*** | 0.4313*** | 0.5483*** | 0.5444*** | | (0.0000) | (0.0000) | (0.0000) | (0.0000) | (0.0000) | (0.0000) | | Non-interest income | -0.0838*** | -0.0855*** | -0.0468** | -0.0437** | -0.0512*** | -0.0503*** | | (0.0000) | (0.0000) | (0.0152) | (0.0232) | (0.0000) | (0.0000) | | CRAR | 0.0008** | 0.0006* | 0.0013*** | 0.0013*** | -0.0082*** | -0.0085*** | | (0.0244) | (0.0725) | (0.0008) | (0.0004) | (0.0000) | (0.0000) | | Size | 0.0522 | 0.0368 | -0.1587*** | -0.1480*** | -0.0477 | -0.0582 | | (0.1007) | (0.1951) | (0.0002) | (0.0005) | (0.6080) | (0.5266) | | RoA | 0.0525*** | 0.0532*** | 0.0380*** | 0.0415*** | 0.0316*** | 0.0291*** | | (0.0000) | (0.0000) | (0.0000) | (0.0000) | (0.0004) | (0.0011) | | RoA(-1) | 0.0148*** | 0.0137*** | 0.0123** | 0.0128** | 0.0112 | 0.0092 | | (0.0040) | (0.0074) | (0.0346) | (0.0277) | (0.2693) | (0.3580) | | Time-fixed effect | Yes | Yes | Yes | Yes | Yes | Yes | | Bank-fixed effect | Yes | Yes | Yes | Yes | Yes | Yes | | Difference-in-Sargan test (p-value) | 1.0000 | 0.96660 | 0.2350 | 0.2570 | 1.0000 | 1.0000 | | A-B test for AR(1) (p-value) | 0.0000 | 0.0000 | 0.0000 | 0.0000 | 0.0000 | 0.0000 | | A-B test for AR(2) (p-value) | 0.6174 | 0.6841 | 0.7499 | 0.7495 | 0.1298 | 0.1610 | | Observations | 1944 | 1944 | 1368 | 1368 | 576 | 576 | p-values in parentheses. *: p<0.10, **: p<0.05, ***: p<0.010.
Note: Even though in some alternative specifications we got statistically insignificant estimates for lags of NIM, we retained the specification of two lags for NIM, for making the comparison for the estimates of gross NPA/stressed assets ratios fair and comparable. | V.2 Results for the Sub-Periods: The regression analysis for the two sub-periods threw up some interesting results insofar as the impact of asset quality on NIM is concerned (Table 3). First, credit risk (measured by the gross NPA and stressed asset ratios) positively impacted NIM during sub-period I. However, in sub-period II credit risk was negatively associated with NIM, i.e., NIM declined with the rise in stressed assets/gross NPA ratios. In sub-period I, the level of stressed assets/ gross NPA ratio was relatively at a much lower level vis-à-vis sub-period II. Credit growth was also relatively strong. Hence, banks were able to charge additional risk premia to compensate for credit risk (Scenario B in Annex I). It is, however, difficult to establish whether banks were genuinely able to protect their NIM or had fudged the account classification norms to recognise incomes through ‘zombie lending’ or ‘ever greening of loans’ on assets that merited classification as NPA.16 However, during sub-period II, when gross NPA ratio rose sharply following asset quality review led reclassification of assets, banks could no longer recognise income on an accrual basis under IAS (International Accounting Standard) 39, nor could they pass on the entire burden of NPAs to their borrowers (Scenario E or F in Annex I). In a competitive market, there are limits up to which banks can compensate themselves through an additional risk premium. The NPA ratios were at an elevated level and would have necessitated a much higher credit risk premium to provide for expected losses and meet the targeted return on assets, which was not possible in a competitive environment. The decline in NIM might also reflect the inability of banks to have made adequate provisioning during this period.17 The inverse relation between gross NPA ratio and NIM could have reflected lower provision coverage as also stress in earnings.18 As noted by Acharya (2017), many banks “are precariously placed in case the provisioning cover for loan losses against their gross non-performing assets is raised to international standards and made commensurate with the low loan recoveries in India”. The above analysis suggests that asset quality had a significant bearing on monetary transmission in India. At a low level of gross NPA ratio, banks were able to pass on the burden of deterioration in asset quality to their borrowers in the form of higher lending rates, which were reflected in increase in NIM. However, as the gross NPA ratio rose, banks were unable to increase interest rates further due to competitive pressures. In contrast, banks might have made provisions for bad assets and also might not have been allowed to recognise interest income on such assets. All this resulted in the decline in NIM. The results of two sub-periods were broadly on the same lines as of the full sample period, excepting the following two cases. First, the higher capital adequacy was found to affect NIMs positively in the first sub-period in line with the full sample period. However, in sub-period II, characterised by monetary policy easing and AQR, higher capital adequacy was negatively associated with NIMs. This was possibly due to the risk aversion by banks following revelation of large NPAs brought out by AQR, which forced banks to refrain from taking further large credit exposure so as to maintain the CRAR above the regulatory level. Left to themselves, banks barely meeting the capital requirements would want to generate capital quickly, focusing on high interest margins at the cost of high loan volumes (Acharya, 2017). However, their ability to generate high NIM – which had both price and quantity components – appeared to have been circumscribed by a surge in NPAs for three reasons: (i) interest income could no longer be recognised: (ii) competitive pressures refrained banks from loading extra credit risk premium; and (iii) credit growth slowed down sharply from 18.3 per cent in Q1:2010-11 to 9.2 per cent in Q1: 2015-16 and further to 5.9 per cent in Q1:2017-18. Second, unlike the sub-period I when credit growth was robust because of which larger banks were able to offer loans at lower rates and operate with lower NIM, in sub-period II, co-efficient of size turned statistically insignificant as credit growth collapsed during this phase. Large NPA on the one hand and a sharp decline in credit volumes on the other, possibly resulted in the coefficient of size turning statistically insignificant. This also impacted NIMs of banks. V.3 Results - Bank Group-wise Table 4 presents estimates of the relationship of NIM with gross NPA and stressed asset ratios for the three bank groups – public, private and foreign. The results show divergence across bank groups. While the gross NPA ratio had a negative and statistically significant impact on NIM of public sector banks, they had a positive but statistically insignificant impact in the case of private sector and foreign banks. The gross NPA ratio of public sector banks was much higher than that of private banks and foreign banks. Thus, the results of bank group-wise analysis corroborated the finding of two sub-periods analysis, i.e., at a high level of the gross NPA ratio, banks were unable to load the cost by jacking up their lending rates and hence their NIM. Thus, the sub-period wise and bank-group wise analyses suggest that at high gross NPA ratio, banks could not charge credit risk premia and increase their NIM, indicating that the impact of the gross NPA ratio on NIM is non-linear.19 | Table 4: Determinants of NIM – Bank Group-wise | | | All SCBs | Public Sector Banks | Private Sector Banks | Foreign Banks | | (1) | (2) | (3) | (4) | (5) | (6) | (7) | (8) | (9) | | NIM(-1) | -0.0052 | 0.0045 | 0.1333*** | 0.1305*** | 0.1127*** | 0.1131*** | -0.0118 | -0.0101 | | (0.7667) | (0.7984) | (0.0001) | (0.0001) | (0.0007) | (0.0006) | (0.6788) | (0.7219) | | NIM(-2) | 0.0332 | 0.0423** | 0.1819*** | 0.1794*** | 0.1830*** | 0.1828*** | 0.0138 | 0.0163 | | (0.1069) | (0.0384) | (0.0000) | (0.0000) | (0.0000) | (0.0000) | (0.6861) | (0.6325) | | Stressed asset | 0.0067** | | -0.0016 | | 0.0042 | | 0.0168* | | | (0.0494) | | (0.3736) | | (0.2491) | | (0.0675) | | | Gross NPA | | 0.0057* | | -0.0128*** | | 0.0097 | | 0.0123 | | | (0.0915) | | (0.0001) | | (0.1183) | | (0.2212) | | Operating expense | 0.4986*** | 0.5066*** | 0.5628*** | 0.5614*** | 0.6568*** | 0.6585*** | 0.4872*** | 0.4870*** | | (0.0000) | (0.0000) | (0.0000) | (0.0000) | (0.0000) | (0.0000) | 0.0000 | 0.0000 | | Non-interest income | -0.0838*** | -0.0855*** | -0.0362 | -0.034 | -0.0608** | -0.0585** | -0.0869*** | -0.0867*** | | (0.0000) | (0.0000) | (0.3781) | (0.4034) | (0.0129) | (0.0170) | 0.0000 | 0.0000 | | CRAR | 0.0008** | 0.0006* | 0.0001 | 0.0007 | 0.0021 | 0.0024 | 0.0007 | 0.0007 | | (0.0244) | (0.0725) | (0.9638) | (0.8053) | (0.1547) | (0.1140) | (0.1907) | (0.2152) | | Size | 0.0522 | 0.0368 | -0.2034*** | -0.2568*** | 0.0113 | 0.0206 | -0.0502 | -0.0524 | | (0.1007) | (0.1951) | (0.0000) | (0.0000) | (0.5765) | (0.3456) | (0.1799) | (0.1611) | | RoA | 0.0525*** | 0.0532*** | 0.0464*** | 0.0368*** | 0.0999*** | 0.1039*** | 0.0567*** | 0.0556*** | | (0.0000) | (0.0000) | (0.0000) | (0.0000) | (0.0000) | (0.0000) | 0.0000 | 0.0000 | | RoA(-1) | 0.0148*** | 0.0137*** | -0.0222** | -0.0311*** | -0.0213* | -0.0211* | 0.0143* | 0.0141* | | (0.0040) | (0.0074) | (0.0163) | (0.0010) | (0.0978) | (0.0931) | (0.0823) | (0.0857) | | Time fixed effect | Yes | Yes | Yes | Yes | Yes | Yes | Yes | Yes | | Bank fixed effect | Yes | Yes | Yes | Yes | Yes | Yes | Yes | Yes | | Difference-in-Sargan test (p-value) | 1.0000 | 0.96660 | 1.0000 | 1.0000 | 0.9980 | 0.9990 | 0.9740 | 0.9610 | | A-B test for AR(1) (p-value) | 0.0000 | 0.0000 | 0.0000 | 0.0000 | 0.0000 | 0.0000 | 0.0000 | 0.0000 | | A-B test for AR(2) (p-value) | 0.6174 | 0.6841 | 0.1285 | 0.2523 | 0.1694 | 0.3200 | 0.9872 | 0.9766 | | Observations | 1944 | 1944 | 702 | 702 | 513 | 513 | 729 | 729 | p-values in parentheses. *: p<0.10, **: p<0.05, ***: p<0.010
Note: Even though in some alternate specifications we got statistically insignificant estimates for lags of NIM, we retained the specification of two lags for NIM, in order to make the comparison for the estimates of gross NPA/stressed asset ratios fair and comparable. | Since banks cannot recognise interest income accruing on their NPA, they could increase or protect their NIM only by raising the credit risk premia on their fresh loans and outstanding standard assets so as to meet their targeted RoA as also to build up provisions. Public sector banks did not make enough provisions as seen from their high net NPA ratio of 6.9 per cent (as against 2.2 per cent and 0.6 per cent for private sector and foreign banks, respectively) as at end-March 2017. It was also possible that public sector banks pursued a risk averse strategy, particularly when they were not able to raise capital. Public sector banks instead responded by significantly reducing supply of credit as compared with other bank groups, as reflected in the sharp fall in the credit growth during this period. The case of foreign banks, however, was different. They were most successful in keeping provisions high and reducing the level of the net NPA ratio20 – the PCR of foreign banks stood at 82.3 per cent as at end-March 2017, as against 42.2 per cent and 47.9 per cent for public sector banks and private sector banks, respectively.21 With higher provisions requiring a higher NIM so as to maintain profitability, the relationship between the gross NPA ratio and NIM for foreign banks turned out to be positive. Other results of bank group-wise analysis were similar to the aggregate analysis, barring in the following two cases. First, non-interest income coefficient turned out to be negative, as expected, but statistically insignificant in the case of public sector banks, while it was statistically significant in the case of foreign and private sector banks. This implies that non-interest income was not a significant factor influencing the lending rates and margins of public sector banks, while it was significant in the case of private sector and foreign banks. Second, the bank size had a negative association with interest margins in the case of public sector banks, suggesting that large public sector banks were able to keep NIM lower as they enjoyed economies of scale. The size coefficients of private and foreign banks were, however, statistically insignificant, suggesting that the size had no impact on NIMs of private and foreign banks. Section VI
Conclusion In a bank-dominated financial system such as India, monetary transmission works mainly through the banking system. Hence, health of the banking system plays a key role in effective monetary transmission. This paper was an attempt to assess whether the recent deterioration in the health of the banks in India had any adverse impact on monetary transmission. The analysis suggests that credit risk, proxied separately by the gross NPA and stressed asset ratios, had a positive impact on the NIMs of scheduled commercial banks for the period Q1:2010-11 to Q1:2017-18, implying that deterioration in asset quality impaired monetary transmission. While deterioration in asset quality was positively associated with NIM in sub-period I (Q1:2010-11 to Q1:2015-16), it was negatively associated in sub-period II (Q2:2015-16 to Q1:2017-18). In sub-period I, when the gross NPA/stressed assets ratio was relatively low, but rising, banks were able to pass on the burden of deterioration in asset quality on to their lending rates and protect NIMs. In sub-period II, however, when the gross NPA ratio was high and rising, banks were not able to protect their NIMs as in a competitive environment there are limits up to which banks can charge extra credit risk premia. This finding was corroborated by bank group-wise analysis. NIMs of public sector banks, which had large NPA/stressed assets, were negatively impacted, while NIM of private sector and foreign banks were not. The key findings of the study are that deterioration in the health of the banking sector at the initial stages impairs monetary transmission through interest rate channel as banks are able to charge extra credit risk premium for possible loan losses. However, when NPAs keep rising, banks are unable to protect their NIMs due to competitive pressures, but they become risk averse and cut sharply their lending, which impacts monetary transmission through bank lending channel. The key focus of study was to assess how the health of the banking system impacted the strength of the interest rate channel of monetary transmission. The asset quality is also expected to play a key role in the bank-lending channel of monetary transmission. This channel, however, has not been explicitly examined in this paper. This is an area which needs further research.
References Acharya, V. V. (2017), “The Unfinished Agenda: Restoring Public Sector Bank Health in India”, Speech delivered at the 8th R K Talwar Memorial Lecture organised by the Indian Institute of Banking and Finance at Hotel Trident, Mumbai, September 7, https://www.rbi.org.in/Scripts/BS_SpeechesView.aspx?Id=1046. Almarzoqi, R. and. Naceur S. B. (2015), “Determinants of Bank Interest Margins in the Caucasus and Central Asia” IMF Working Paper 15/87, April. Angbazo, L. (1997), “Commercial Bank Net Interest Margins, Default Risk, Interest-Rate Risk, and off-Balance Sheet Banking”, Journal of Banking and Finance, 21, 55-87. Arellano, M., and Bond, S. (1991), “Some tests of specification for panel data: Monte Carlo evidence and an application to employment equations”, The Review of Economic Studies, 58(2), 277-297. Arellano, M., and Bover, O. (1995), “Another look at the instrumental variable estimation of error-components models”, Journal of Econometrics, 68(1), 29- 51. Blundell, R., and Bond, S. (1998), “Initial conditions and moment restrictions in dynamic panel data models”, Journal of Econometrics, 87(1), 115-143. Brock, P. L., and Rojas-Suarez L. (2000), “Understanding the Behavior of Bank Spreads in Latin America”, Journal of Development Economics, 63, 113-134. Carbo V.S., and Rodriguez, F. F. (2007), “The Determinants of Bank Margins in European Banking”, Journal of Banking and Finance, 31(7), p. 2043-2063. Chortareas, G. E., Girardone C., and Gustavo Garza-Garcia J. (2010), “Banking Sector Performance in Some Latin American Countries: Market Power versus Efficiency,” Banco de México Working Papers 20, Mexico City. Claeys, S., and Vennet, V.R. (2008), “Determinants of Bank Interest Margins in Central and Eastern Europe: A Comparison with the West”, Economic Systems 32 (2), 197–216. Das, T. B. (2013), “Net Interest Margin, Financial Crisis and Bank Behaviour: Experience of Indian Banks”, RBI Working Paper Series: 10, October. Dumicic, M. and Ridzak, T. (2013), “Determinants of Banks’ Net Interest Margins in CEE”, March https://www.researchgate.net/publication/305387302. Fisher, I. (1933), “The Debt-deflation Theory of Great Depressions”, Econometrica, 1, 337–357. Fonseca, A.R. and Gonzalez F. (2008), “Cross-country Determinants of Bank Income Smoothing by Managing Loan-Loss Provisions”, Journal of Banking and Finance, 32(2), 217-228. Hesse, H. (2007), “Financial Intermediation in the pre-consolidated banking sector in Nigeria”, World Bank Policy Research Working Paper Series 4267, Washington DC. Ho, T. S. Y., and Saunders A. (1981), “The Determinants of Bank Interest Margins: theory and Empirical Evidence”, Journal of Financial and Quantitative analysis, 16, 581-600. Kannan, R., Narain, A. and Ghosh, S. (2001), “Determinants of Net Interest Margin under Regulatory Requirements: An Econometric Study”, Economic and Political Weekly, January 27, 337-44. Marinkovic, S. and Radovic O. (2014), “Bank Net Interest Margin Related to Risk, Ownership and Size: An Exploratory Study of the Serbian Banking Industry”, Economic Research- Ekononska Istrazlvanja, 27(1), 134-154. Maudos, J., and De Guevara, F. J. (2004), “Factors Explaining the Interest Margin in the Banking Sectors of the European Union”, Journal of Banking and Finance, 28 (9), 2259–2281. Maudos, J., and Solísc, L. (2009), “The Determinants of Net Interest income in the Mexican Banking System: an Integrated Model”, Journal of Banking and Finance, 33 (10), 1920–1931. Rajan, R. (2016), “Issues in Banking Today”, 2016 - at CII’s first Banking Summit, Mumbai, February 11, https://www.rbi.org.in/Scripts/BS_SpeechesView.aspx?Id=992 Reserve Bank of India (2011), Report on Trend and Progress of Banking in India. — (2013), Report on Trend and Progress of Banking in India. — (2017), Report on Trend and Progress of Banking in India. — (2017a), Statistical Tables Relating to Banks in India. Roodman, D. (2009), “How to do xtabond2: An introduction to difference and system GMM in Stata”, Stata Journal, 9(1), 86-136. Saunders, A., and Schumacher L. (2000), “The Determinants of Bank Interest Rate Margins: An International Study”, Journal of international Money and Finance, 19, 813-832. Schwaiger, M.S. and Liebig, D. (2008), “Determinants of the Interest Rate Margins in Central and Eastern Europe”, Financial Stability Report (Osterreichische National Bank), 14, 68-87. Sensharma, R., and Ghosh, S. (2004), “Net Interest Margin: Does Ownership Matter”, Vikalpa, 29 (1), 41-47. Subbarao, D. (2010), “Five Frontier Issues in Indian Banking”, Inaugural Address at ‘BANCON 2010’ in Mumbai on December 3, https://www.rbi.org.in/Scripts/BS_SpeechesView.aspx?Id=539. Tan, T. B. P. (2012), “Determinants of Credit Growth and Interest Margins in the Philippines and Asia”, IMF Working Paper, WP/12/123, May. Vishwanathan, N. S. (2016) “Asset Quality of Indian Banks: Way Forward” - at National Conference of ASSOCHAM on “Risk Management: Key to Asset Quality”, New Delhi, August 30, https://www.rbi.org.in/Scripts/BS_SpeechesView.aspx?Id=1023. Williams, B. (2007), “Factors Determining Net Interest Margins in Australia: Domestic and Foreign Banks”, Financial Markets, Institutions and Instruments, 16(3), 145-165.
| Annex. I: Relationship between NIM, Return on Assets and Asset Quality (Provisions /NPA) – Hypothetical Scenarios (contd.) | | (Per cent of total assets) | | Scenario | NIM | Return on Assets | Net non- interest income | Provision | Impact on transmission during easing phase of monetary policy | | A | Baseline - Provisions are at a prudent level and RoA at the targeted level. | 2.5 | 1 | 0.5 | 2.0 | | | B | Banks have pricing power – In order to provide for higher provisioning requirements on account of a rise in NPA, banks raise NIMs and at the same time, are able to maintain RoA at the targeted level. | 2.8 | 1 | 0.5 | 2.3 | Transmission is impeded. | | C | Banks do not have pricing power - Faced with the higher provisioning requirement, banks cannot increase NIM while simultaneously keeping RoA at its targeted level. Banks are only able to prudently provide for higher NPAs but at the cost of non-adherence to RoA target as NIM remains unchanged at the baseline level. | 2.5 | 0.7 | 0.5 | 2.3 | The impact of higher provisioning is absorbed by the return on assets and NIM remains unchanged. There is no adverse impact on transmission. However, due to lower profitability, banks may become capital constrained in future. | | D | Increase in provisioning requirements - Prudence demands that banks increase provisioning requirement to 2.3 per cent from 2.0 per cent. However, banks do not have pricing power – cannot increase NIM. They still maintain targeted RoA by inadequate provisioning (non-recognition of NPA). Zombie lending (ever greening of NPA) may help banks maintain profitability artificially. | 2.5 | 1 | 0.5 | 2.0 | Through inadequate provisioning, banks maintain NIM at base line level. Transmission appears not to be impacted although there is no real monetary transmission. Also, transmission may get impacted in future as and when banks are required by the regulator to make provisioning. | | E | Banks do not have pricing power: Nevertheless, banks recognise NPA and make adequate provisioning. A sharp fall in interest income leads to a fall in NIM. RoA declines by much more as compared with C, reflecting both a fall in NIM and a rise in provisions. | 2.3 | 0.5 | 0.5 | 2.3 | Since banks are unable to increase lending rates in the absence of pricing power, transmission is not visibly impacted. However, due to lower profitability, banks may become capital constrained in future. | | F | Banks do not have pricing power - Higher NPA reduce banks’ interest income, thereby lowering NIMs. Banks make inadequate provisioning (non-recognition of NPA). RoA falls, but only marginally due to under-provisioning even as higher NPAs reduce interest income and hence, NIM. | 2.2 | 0.9 | 0.5 | 1.8 | As above. | | G | Banks make over - (under) provisioning during economic upswing (downswing) even as NPAs decline (rise). Counter cyclical provisioning causing income smoothing results in a negative relationship between NPAs and NIM (i.e., when NPAs are relatively high during the easing phase, provisioning is relatively low and therefore, NIM is relatively low.) | 2.4 | 1.0 | 0.5 | 1.9 | When credit growth is low (monetary easing phase), lower provisioning keeps lending rates low (even though NPA may be high). When credit growth is high (during monetary tightening phase), banks are required by the regulator to raise provisioning (even as NPAs are low) so that banks raise their NIMs by raising lending rates. Thus, transmission is facilitated during both the easing and tightening phases through counter - cyclical provisioning. |
|