Balbir Kaur, Sangita Misra and Anoop K. Suresh* This paper attempts to study the cyclical behaviour of social sector spending including that on education and health for the 17 non-special category states covering the period 2000-01 to 2012-13. It finds that while overall social spending is acyclical in India at the state level, education spending is pro-cyclical, with the pro-cyclicality being more pronounced during upturns than it is during downturns. Further, the pro-cyclicality is more significant for bigger states (in terms of income) than it is for low income states. This possibly hints at the combined impact of political economy factors, pro-cyclical state revenues and the role of discretionary transfers. Fiscal deficit is observed to impact social sector expenditures negatively, providing support to the fiscal voracity effect hypothesis. In order to ensure that the low growth does not hamper human capital formation, states are expected to increase their social sector spending during difficult times. This would, however, require the building of adequate fiscal space during good times to enable them to spend more when required on human capital investments, which is the key to achieving long-term inclusive and sustainable development. JEL Classification: E32, H5, H62 Key words : Social Sector Expenditures, Business Cycles, Fiscal Deficit, Transfers Introduction Human capital is critically intertwined with economic growth, with education and health constituting its major components. Investment in education and health makes the labour force more productive, healthy, competitive and efficient, all of which taken together contribute to higher economic growth. In the backdrop of the global financial crisis, there is renewed focus on attaining social sustainability to achieve the objective of sustainable growth. In line with this objective, there is a greater emphasis on investment in human capital with a view to improving life expectancy, ensuring availability of human capital with appropriate skill sets to support business activity while in that process also helping to develop innovative capacity and entrepreneurship in an economy. Particularly, commenting on India, the World Development Report (WDR) 2013 observed that providing key services like health and education can help create the right jobs while also contributing to improved standards of living and inclusive growth. The use of policies with a focus on strengthening the human resource base is considered extremely relevant for India which is expected to contribute a significant proportion of the global labour force in the coming years. In the Indian context, development initiatives undertaken by planners have been driven by these concerns and are reflected in increasing importance being assigned to the provisioning of social services by the central and state governments since the inception of the Plan era. Public sector outlays on social services (both projected and actual realization) have been on the rise, with the increase being significant since the Sixth Five Year (FY) Plan. The public sector outlay on social services as a proportion of total expenditure more than doubled from 14.4 per cent in the Sixth FY Plan to 30.2 per cent in the Eleventh Plan and is projected at 34.7 per cent in the 12th FY Plan (Table 1). While there has been a steady increase in the share of social sector expenditure in total plan expenditure, which is noteworthy, total public sector expenditure1 on important social sector heads remains low when compared with international standards. The combined expenditure of the central and state governments in India on education is just about 3.3 per cent of GDP;2 while that on the health sector is even lower at 1.3 per cent of GDP. In contrast, countries of the European Union spend 5.5 per cent of GDP (from their general government account) on education and 7.5 per cent of GDP on health. Canada’s public spending on health alone is over 11 per cent of its GDP and that on education is nearly 5 per cent. Apart from the low public sector expenditure levels (relative to international standards), significant disparities persist across states when it comes to expenditure of state governments on social services in India. Available data indicates that the states lagging behind with regard to expenditure on social sector have not attempted to catch up with the better-performing states through higher allocations of expenditure for social sector which is a key contributor to human development outcomes. The per capita social sector expenditure in the laggard states remained significantly lower than that of the leading states, resulting in the persistence of disparities in human development indicators (HDI) across states during the 2000s (RBI 2013). | Table 1: Pattern of Plan Outlay on Social Services | | (₹ billion) | | Period | Outlay | Actuals | | Sixth Plan 1981-85 | 140.35 | 159.17 | | | (14.4) | (14.5) | | Seventh Plan 1985-1990 | 315.45 | 349.60 | | | (17.5) | (16.0) | | Eighth Plan 1992-97 | 790.12 | 888.07 | | | (18.2) | (18.3) | | Ninth Plan 1997-2002 | 1,832.73 | 1,945.29 | | | (21.3) | (20.6) | | Tenth Plan 2002-2007 | 3,473.91 | 4,365.29 | | | (22.8) | (27.0) | | Eleventh Plan 2007-12 | 11,023.27 | 11,975.76 | | | (30.2) | (32.6) | | Twelfth Plan 2012-17 | 26,648.43 | | | | (34.7) | | | Note: Figures in brackets indicate percentage to total plan outlay. | Given the importance of social sector expenditure in the Indian context, it is not only pertinent to analyse the trends in social sector expenditures (including education and health) over a period of time but also to examine their response to situations of economic volatility in general and growth slowdown in particular. There are two reasons for this. First, the conventional Keynesian argument that holds for any kind of public sector expenditure as a counter-cyclical tool holds for social sector expenditure as well. An increase in social spending could form part of a counter-cyclical fiscal policy response of the government to support aggregate demand and foster economic recovery during the period of economic slowdown. Second, increase in social spending during this phase may also be an appropriate policy strategy to provide adequate social protection thereby mitigating the adverse human development implications of output shocks. This strategy, though desirable, may however, be constrained by available fiscal space at the level of the central and state governments. It is against this backdrop that this paper attempts to analyse the behaviour of social sector expenditures at the state level in India – whether they are pro-cyclical, counter-cyclical or acyclical. Do these expenditures get squeezed or remain protected during downturns? Are there any inter-state differentials in these expenditures based on the size of the states? And lastly, whether a progressive move towards fiscal consolidation at the state level has impacted their social sector expenditures? Section II covers a review of literature on these issues. Trends in social sector expenditures are analysed in Section III. Section IV attempts to examine these questions in a panel data framework. Section V gives the conclusions and policy implications. The major contribution of this paper to empirical literature is that it is the first attempt of its kind to study cyclicality of social sector expenditure at the state level in India. Section II
Review of Literature Cyclicality of fiscal policy is a well-studied and researched area. Conventional macroeconomic wisdom says that fiscal policy should act as a stabilizing policy tool by counteracting business cycle fluctuations via increasing expenditures and reducing taxes during recessions. There is extensive literature on the issue of cyclicality of fiscal policy in general, including its implications for macroeconomic stability and growth (Annexure I). The cyclicality of fiscal policy has also been examined in a cross-country framework. Fiscal policy has mostly been observed to be counter-cyclical/acyclical in advanced economies. On the contrary, empirical evidence indicates a pro-cyclical behaviour of fiscal policy in developing countries, demonstrating thereby that fiscal policy tends to expand in periods of economic growth (‘good times’) while it contracts during recessions or slowdowns (‘bad times’) (Gavin and Perotti 1997; Talvi and Vegh 2000; Lane 2003; Caballero and Krishnamurthy 2004). Pro-cyclicality of fiscal policy in developing countries has been attributed to various factors in empirical studies. The ‘financial channel’ hypothesis attributes pro-cyclicality of fiscal policy to inadequate capital markets or limited access to these markets during downturns which restricts government spending when most needed (Gavin et al. 1996). Tornell and Lane (1999) draw attention to the ‘voracity effect’ for the strong increase in fiscal demands during expansions. According to their reasoning, if a particular group does not increase its appropriation during a boom, other groups will. Thus, there is a strong incentive to grab part of the newly available resources before other groups do, and that the incentive to do so increases with the size of the pie; thus, this common pool problem becomes stronger in an expansion delivering a pro-cyclical result. Alesina et al. (2008) developed a model to show that public/voters’ pressure forces a government into pro- cyclical public spending, and even borrowings. Woo (2009) has argued that greater heterogeneity of preferences of different social groups, as measured by the Gini coefficient, causes fiscal policy to be pro-cyclical. While available empirical literature mostly relates to the cyclicality of fiscal policy at the central government level, either individually or in a cross-country framework, one aspect that has been relatively less studied is the connection between the so-called ‘vertical imbalances’ in fiscal policy across different tiers of government and its effect on the overall pro-cyclicality of fiscal policy. Very little is known about the cyclicality of sub-national fiscal policies. This is surprising considering the fact that the general trend the world over has been towards greater fiscal decentralisation. A large proportion of spending, and to a lesser extent taxation, takes place at the sub-national level. There are a few empirical studies which analyse the behaviour of social sector expenditure at the sub-national level across business cycles. In a study of 21 OECD countries between 1982-2003, Darby and Melitz (2008) found that some fiscal expenditure items like health, retirement benefits, incapacity and sick pay and unemployment compensation responded in a stabilising manner to business cycle fluctuations. Granado et al. (2013) studied the cyclical behaviour of public spending on health and education in 150 countries (both developed and developing), covering the time period 1987-2007. Empirical results of the study show that total social spending was pro-cyclical in developing countries in both good and bad times, but more so during good times.3 When it comes to education and health expenditures, an asymmetric pattern was observed implying thereby that they are pro-cyclical during periods of positive output gaps but acyclical during periods of negative output gaps. Furthermore, the degree of cyclicality was observed to be higher the lower the level of economic development. Our current study essentially draws upon this paper. Wibbels and Rodden (2006) studied the sensitivity of provincial government finances to regional business cycles in eight federal republics including India. In a panel framework, using data for 14 major states for 1980-98, both revenues and expenditures for Indian states were found to be pro-cyclical. Within revenues, own-source taxes of the states were found to be highly pro-cyclical whereas revenue-sharing and discretionary transfers were either acyclical or pro-cyclical. Based on these results, they came to a conclusion that a move towards decentralisation in developing countries would heighten overall pro-cyclicality, especially of health, education and social expenditures. In India, the cyclical properties of fiscal policy have primarily been tested for central/general government revenues and expenditures. Examining the cyclicality of various components of central and general government (centre and states combined) expenditures in India, revenue expenditures have been found to be pro-cyclical in the long run, while capital expenditures have exhibited pro-cyclical behaviour both in the short and long run (Shah and Patnaik 2010; RBI Annual Report 2012-13). In empirical literature on social sector expenditures at the state level in India, the analysis has been confined mainly to issues such as trends in social sector expenditure during the post-reform period and its impact on the social sector in India (Dev et al. 2002; Joshi 2006). Social sector expenditures have been found to have a positive impact on social outcomes and hence, enhancing such expenditures from their low levels in India is viewed as crucial to achieving overall human development goals (Kaur and Misra 2003). However, there is a gap in empirical literature with regard to an analysis of the cyclical properties of state spending on social sectors like education and health in India. Recognizing this gap, this paper attempts to analyse the cyclical properties of state spending on social sectors like education and health at the state level (in a panel framework) in India. Section III
Social Sector Expenditure: Trend Analysis In India, the provision of social services is primarily the responsibility of state governments even as they receive large financial support from the central government under centrally sponsored schemes. Available data indicates that about 80 per cent of combined (centre and states) government expenditure on social services is incurred by state governments.4 Within social services, it is education and health services (including medical, public health and family welfare) which taken together account for around 60 per cent of the total social sector expenditure of state governments (Table 2).5 Table 2: Composition of Expenditure on Social Services
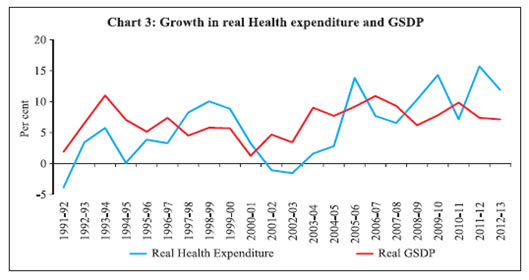
(Revenue and Capital Accounts) | | (Per cent to total expenditure on social services) | | Item | 1990-98 | 1998-2004 | 2004-08 | 2008-10 | 2010-14 | | Average | | 1 | 2 | 3 | 4 | 5 | 6 | | Expenditure on Social Services (a to k) | 100.0 | 100.0 | 100.0 | 100.0 | 100.0 | | (a) Education, Sports, Art and Culture | 51.9 | 52.6 | 47.3 | 44.3 | 46.9 | | (b) Medical, public Health and Family Welfare | 15.7 | 14.2 | 12.9 | 12.0 | 12.3 | | (c) Water Supply and Sanitation | 7.3 | 7.6 | 8.2 | 6.7 | 4.6 | | (d) Housing | 2.9 | 2.9 | 2.9 | 3.1 | 2.9 | | (e) Urban Development | 2.4 | 3.2 | 5.4 | 8.7 | 7.3 | | (f) Welfare of SCs, ST and OBCS | 6.6 | 6.3 | 7.0 | 6.9 | 7.5 | | (g) Labour and Labour Welfare | 1.4 | 1.1 | 1.1 | 1.0 | 1.1 | | (h) Social Security and Welfare | 4.4 | 4.7 | 6.5 | 9.4 | 10.3 | | (i) Nutrition | 2.2 | 2.2 | 2.5 | 3.1 | 3.3 | | (j) Expenditure on Natural Calamities | 2.8 | 3.3 | 4.0 | 2.7 | 2.1 | | (k) Others | 2.4 | 2.0 | 2.2 | 2.2 | 2.0 | | Source: State governments’ budget documents. | At the state level, social sector expenditure as a percentage of GDP exhibited both way movements in the range of 6-8 per cent during 1990-91 to 2012-13. On a per capita basis, social sector expenditure (in real terms) recorded a 3-fold increase during the period covered in the study. The increase was about 2.7 times for education expenditure and about 2.3 times for health expenditure on a real per capita basis. A large part of the increase in real per capita social sector expenditure has been achieved in the post-2000 period. However, despite this increase, social sector expenditure in India remains low by the international standards (WDR 2013). A state-wise comparison of expenditure on social sector, health and education during 1990-91 to 2000-01, 2001-02 to 2009-10 and 2010-11 to 2012-13 for the 17 non-special category (NSC) states6 reveals considerable variations across states with the differences continuing to persist during the period under review. Social sector expenditure as a per cent of Gross State Domestic Product (GSDP) was in the range of 4.8 per cent to 11.5 per cent during 2010-13 in the case of NSC states. While the variation in health expenditure as a per cent of GSDP was in the range of 0.5 to 1.2 per cent, the education expenditure-GSDP ratio showed larger inter-state variations of 2.1 to 4.6 per cent (Table 3). During 2010-13, a majority of the states exhibited an increase in social sector expenditure (including health and education expenditure) when compared with 2001-02 to 2009-10. It may be noted that a decline in health expenditure between 2001-12 may have been compensated through higher private sector expenditure on health during these years. It is also argued that fiscal consolidation at the state level has been achieved primarily at the cost of lower health and education spending, which is examined separately in this paper. | Table 3: Expenditure on Social Sector, Education and Health: A State-wise Picture | | (As per cent of GSDP at current market prices) | | | Social Sector | Education | Health | | 1990s | 2000s | 2010-13 | 1990s | 2000s | 2010-13 | 1990s | 2000s | 2010-13 | | Andhra Pradesh | 6.5 | 6.5 | 7.4 | 2.3 | 2.1 | 2.5 | 0.8 | 0.7 | 0.8 | | Bihar | 12.0 | 10.5 | 10.9 | 5.9 | 5.1 | 4.6 | 1.6 | 1.1 | 1.0 | | Chhattisgarh | NA | 8.1 | 11.5 | NA | 2.3 | 4.2 | NA | 0.6 | 0.9 | | Goa | 8.2 | 6.4 | 7.9 | 4.0 | 2.8 | 3.4 | 1.6 | 1.0 | 1.2 | | Gujarat | 5.4 | 5.4 | 5.3 | 2.6 | 2.1 | 2.1 | 0.7 | 0.5 | 0.6 | | Haryana | 4.7 | 4.7 | 5.5 | 2.1 | 2.0 | 2.4 | 0.6 | 0.4 | 0.5 | | Jharkhand | NA | 9.8 | 10.0 | NA | 3.5 | 3.6 | NA | 1.1 | 0.9 | | Karnataka | 6.5 | 6.3 | 7.2 | 2.8 | 2.7 | 2.8 | 0.9 | 0.7 | 0.7 | | Kerala | 5.2 | 5.5 | 6.0 | 2.7 | 2.7 | 3.0 | 0.7 | 0.8 | 0.9 | | Madhya Pradesh | 9.5 | 7.8 | 9.3 | 3.6 | 2.7 | 3.4 | 1.1 | 0.8 | 0.9 | | Maharashtra | 5.0 | 5.0 | 5.3 | 2.3 | 2.6 | 2.5 | 0.6 | 0.5 | 0.5 | | Odisha | 7.7 | 7.1 | 8.2 | 3.3 | 3.0 | 3.3 | 0.9 | 0.7 | 0.7 | | Punjab | 4.1 | 4.0 | 4.8 | 2.4 | 2.1 | 2.3 | 0.7 | 0.6 | 0.7 | | Rajasthan | 6.9 | 7.8 | 7.0 | 3.1 | 3.3 | 3.0 | 1.0 | 0.9 | 0.8 | | Tamil Nadu | 6.4 | 5.9 | 6.5 | 2.8 | 2.3 | 2.4 | 0.9 | 0.7 | 0.7 | | Uttar Pradesh | 6.2 | 7.0 | 9.3 | 3.0 | 3.1 | 4.0 | 0.9 | 1.0 | 1.1 | | West Bengal | 5.8 | 5.5 | 6.9 | 2.9 | 2.7 | 3.1 | 0.9 | 0.8 | 0.8 | | Total | 6.1 | 6.2 | 7.0 | 2.8 | 2.6 | 2.9 | 0.8 | 0.7 | 0.7 | | Source: Computed from State Finances: A Study of Budgets, various issues | In this context, it is interesting to examine the relationship between real social sector expenditure of states and their real incomes. A simple plotting of real growth in social sector expenditures, including education and health and real GSDP for all NSC states taken together during 1990-91 and 2012-13 reveals some kind of co-movement. However, its precise quantification necessitates further examination (Charts 1, 2 and 3). 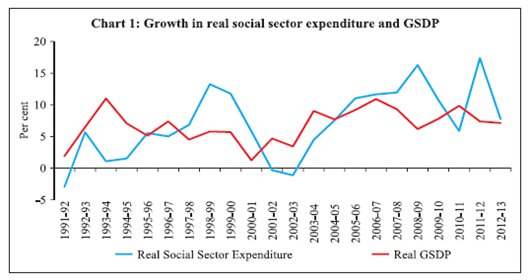

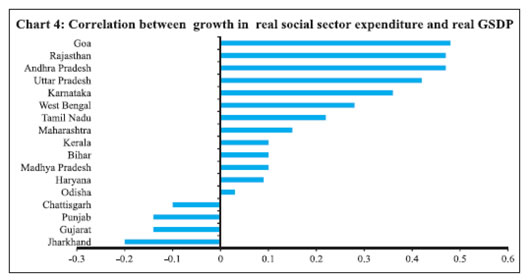 On an individual state-wise basis also, some correlation is observed between expenditures and real incomes of select states. Chart 4 shows the correlation between growth in real social sector expenditures and the real GSDP for 17 NSC states over the last two decades (1990-91 to 2011-12).7 As can be seen from the chart, a majority of the states exhibit positive correlation hinting at pro-cyclicality of social sector expenditures. Preliminary evidence of pro-cyclicality is also observed for education and health expenditures across states (Charts 5 and 6) necessitating the need to explore the relationship further in an econometric framework.
Apart from state real GSDP, gross transfers from the central government as grants or share in central tax receipts tend to influence the capacity of state governments to undertake expenditures in general, and social sector expenditure in particular. Even though the real GSDP remains an important determinant of the level of expenditure on the social sector, it is important to evaluate the impact of fiscal positions of states consequent to the enactment and implementation of the Fiscal Responsibility and Budget Management Acts/Fiscal Responsibility legislations by state governments on their social sector expenditures. It is interesting to note that social sector expenditure8 has exhibited a generally rising trend since 2004-05 (Chart 7). Section IV
Panel Data Analysis Having examined the trends in social sector expenditures across states, this section tries to empirically examine whether state level-social sector expenditure is pro-cyclical, that is, whether the education and health spending of states increases during periods of high GDP growth and vice versa. This analysis is done in a panel framework for 17 NSC states. Since data for Chhattisgarh and Jharkhand are available only from the early 2000s when these states came into being, the empirical analysis is restricted to the period 2000-01 to 2012-13.9 The empirical analysis is based on data relating to expenditure on social sector (revenue expenditure) of these selected states, as given in the State Finances: A Study of Budgets and Handbook of Statistics of the Indian Economy brought out by the Reserve Bank of India. Although capital expenditure constitutes nearly 17-18 per cent of the total expenditure of the states, its share in total expenditure on education is between 0.2 per cent and 1.4 per cent for most states except Goa, for which it is around 3.6 per cent. The share of capital expenditure in total health expenditure of states is even lower. State-wise revenue expenditure on the social sector was deflated by the respective GSDP deflator to arrive at real social sector expenditure. Similarly, real education and health sector10 expenditures of the NSC states were computed. A number of control variables have been used in cross-country and sub-national studies which include foreign aid, transfers from abroad, foreign portfolio investment, terms of trade, tax revenue as a share of GDP and provincial debt. In addition, other control variables that have been used in several cross-country studies include the lagged fiscal balance-GDP ratio, an indicator of the potential effect of borrowing constraints on public spending (Jaimovich and Panizza 2007; Granado et al. 2013), fiscal transfers to states as a determinant of their capacity to incur social spending (Arena and Revilla 2009) and political economy variable (Cukierman et al. 1992; Brunetti 1997). Political economy variable is taken using the logic that if there is a similarity between the governing parties at the centre and state levels, the states tend to become more important in the federal set up and enjoy greater bargaining power. We have chosen the control variables that are relevant for our analysis at the sub-national level in India, and for which data are readily available. Further, the selection of control variables has been made to ensure that the possible multi-collinearity between the explanatory variables does not distort empirical results.11 We selected the gross fiscal deficit-GSDP ratio as a control variable in our empirical analysis. It may be noted here that for Indian states, even though states’ revenue expenditures as a proportion to GDP has not declined, there was a slight compositional shift towards developmental expenditure during the 2000s. This was on account of a decline in the share of interest payments in total revenue expenditure as also in the interest payments-GDP ratio in the recent period vis-à-vis 2004-08 (RBI 2013). The political economy variable has been captured through dummy in this paper. The dummy takes a value of one if the party at the state is the same as the one at the centre and a value of zero if they are different.12 Summary statistics for the variables used in the empirical work are given in Table 4. State-wise descriptive statistics are given in Annex II. The Model In line with literature, the following regression equation is estimated using panel data: d(log SS EXPi, t ) = β0i + γt + β1 d(log Yit) + β2 FDi,t-1 + β1 d(log TRi,t) + ui,t ……… (1) where β0 represents state fixed effect which controls for heterogeneity across states, γ is time effect capturing common shocks across states at a given time period, SS EXP denotes real social sector expenditure, Y denotes GSDP in real terms, FD denotes gross fiscal deficit as a per cent of GSDP, TR denotes gross transfers in real terms and u is an error term. The subscripts i and t denote state and time period respectively. The coefficient β1 measures the cyclicality of social sector expenditure at the state level. A positive and significant value of β1 implies pro-cyclical behaviour, while a negative and significant value implies counter-cyclical behaviour. A non-significant β1 implies acyclical behaviour. | Table 4: Descriptive Statistics: 2000-01 to 2012-13 | | | Real Growth in per cent | Fiscal deficit to GSDP
ratio (per cent) | Growth in Transfer receipts in real terms (per cent) | | Social Sector Expenditure | Education Expenditure | Health Expenditure | GSDP | | Mean | 8.7 | 7.6 | 7.5 | 7.3 | 3.4 | 9.8 | | Median | 8.9 | 6.5 | 5.3 | 7.5 | 3.2 | 8.1 | | Maximum | 51.8 | 44.1 | 102.6 | 28.7 | 8.1 | 191.4 | | Minimum | -26.4 | -29.2 | -31.0 | -9.9 | -1.0 | -44.1 | | Std. Dev. | 12.1 | 11.9 | 14.5 | 4.9 | 1.8 | 19.3 | | Observations | 217 | 217 | 217 | 217 | 217 | 217 | Before the estimation was done, all the data series were tested for stationarity. Based on panel unit root tests involving the common unit root process (LLC) as well as individual unit root process (IPS), the dependent and explanatory variable series were found to be stationary, that is, I (0) (Table 5). It is observed that growth in health expenditure is either non-stationary or stationary with low significance. Recognising this, health expenditure was dropped as one of the dependent variables from the regression estimations. Most variables used in the model were normalised and transformed into logarithms to minimise heteroscadasticity. In literature, in a cross-country framework, instrument variables (IV) - fixed effect models have generally been used to address potential endogeneity of the RHS variable (output), that is, while economic downturns limit government’s capacity to undertake counter-cyclical policies, counter-cyclical fiscal policies (including social spending) may offset the impact of downturns through a positive push to boost the economy (Nadia et al. 2010). Some of the instrument variables used in empirical literature include interest rate, world growth rate, terms of trade and lagged GDP growth. The 2-stage least squares (2SLS) technique is also frequently used to address endogeneity issues. Arena and Revilla (2009) found that fiscal spending responded to business cycles in a contemporaneous manner in different Brazilian states. Given that our analysis relates to response of public spending at the state level, the results are reported for GSDP at levels on the lines of the Brazilian study. However, to rule out any potential endogeneity, the results of IV estimation (with lagged output growth as the IV) as well as the 2SLS estimation are also reported so as to ensure the robustness of the results. | Table 5: Results of Panel Unit Root Tests | | Variables (Levels) | LLC t Statistics | IPS W Statistics | | Growth in real Social sector expenditure | -6.83** | -4.69** | | Growth in real Education expenditure | -5.33** | -2.60** | | Growth in real Health expenditure | -2.16** | -1.42 | | GSDP growth | -7.73** | -6.15** | | Fiscal deficit to GSDP ratio | -4.50** | -1.60* | | Real Gross Transfers Growth | -6.01** | -5.70** | 1. LLC = Levin, Lin, Chu (2002); IPS = Im, Paseran, Shin (2003).
2. ** and * indicate the rejection of the null hypothesis of non-stationarity at 1 per cent and 5 per cent levels of significance.
3. Automatic selection of lags through Schwarz Information Criteria (SIC).
4. All panel unit root tests are defined by Bartlett kernel and Newly West bandwidth | Empirical Results Results of the panel estimates for social sector and education expenditures are reported in Table 6. State social expenditures are generally observed to be acyclical during the 2000s. This may be due to the fact that these expenditures, being on the revenue account, exhibit downward rigidity. Expenditure on education was, however, observed to be pro-cyclical in the least squares estimate although its pro-cyclical behaviour is not seen in the case of IV and 2SLS estimates. Fiscal deficit (with a one period lag) turns out to be an important factor influencing public spending on social sector including that on education. Transfers from the centre to states explain to a large extent the observed acyclical behavior with regard to social sector expenditures. However, the role of transfers diminishes in explaining the cyclical response of education expenditures. Table 6: Cyclicality of Social Sector Expenditure:
Panel Regression Coefficients | | | Social Sector Expenditure | Education Expenditure | | LS | IV | 2SLS | LS | IV | 2SLS | | Constant | 0.14** | 0.15** | 0.27** | 0.13** | 0.13** | 0.20** | | GSDP | 0.19 | 0.16 | -1.30 | 0.33** | 0.14 | -0.08 | | Fiscal deficit (Lagged) | -0.03** | -0.03** | -0.03** | -0.03** | -0.02** | -0.02** | | Gross Transfers | 0.18** | 0.13** | 0.19** | 0.07* | 0.03 | 0.06 | | Political Party Dummy | 0.01 | 0.01 | 0.01 | 0.03* | 0.03* | 0.04 | | AR(1) | | | -0.16* | | | -0.06* | | Number of States | 17 | 17 | 17 | 17 | 17 | 17 | | Number of Observations | 204 | 187 | 187 | 204 | 187 | 187 | Note: 1. ** and * indicate significance of coefficient at 1 per cent and 5 per cent levels, respectively.
2. LS: Least Squares; IV: Instrumental Variable; 2SLS: Two Stage Least Squares.
3. Hausman test has been used to decide on the fixed effect model. | Upturn and Downturn This analysis tries to assess cyclicality using the relationship between social sector spending and GDP growth rates. However, the state of the economy may also have an influence on cyclicality results. In other words, GDP growth may be above its potential and vice versa. Thus, it needs to be examined whether the acyclicality in social sector expenditure that we have observed holds true at all times – irrespective of the output gap position. Descriptive statistics also suggest that the average growth in real social sector expenditure, including on education and health, is significantly higher during positive output gap periods (upturns) than during negative output gap periods (downturns). The standard test of equality of mean and median was conducted to see whether mean and median of these expenditure variables remained the same during both the periods (Table 7). The test rejects the null hypothesis, as the mean and median growth rates of expenditures turn out to be significantly different during the periods of upturns and downturns (except median growth in social sector expenditure). Given this inference, the analysis was extended to see whether the cyclicality results across states differed during the periods of positive and negative output gaps. | Table 7: Test of Equality of Mean/Median for Growth in Real Expenditures During Upturns and Downturns | | | Mean | Median | | T-statistics@ | p-value | Chi-square$ | p-value | | Social Sector Expenditure | -2.66 | 0.00 | 2.02 | 0.15 | | Education Expenditure | -3.33 | 0.00 | 5.02 | 0.02 | Note: @: Test of equality of means based on H0: μ1=μ2 where μ1 and μ2 are mean values of growth in real expenditure during upturn and downturn, respectively.
$: Test of equality of median based on H0: m1=m2 where m1 and m2 are median values of growth in real expenditure during upturn and downturn, respectively. | Two methodologies were used for this analysis. First, we examined the response of social sector spending to output gap, as indicated by the ratio of actual to potential output13 (computed using the HP filter) for different states. This was attempted using equation (1) as given earlier, but replacing the output variable by the output gap variable along with other control variables. Second, the time period covered in the study was distinctly split into good and bad times (upturns versus downturns) using appropriate dummies. The period of upturn was taken as the one when the actual output was higher than the trend output as computed using the HP filter and vice versa for downturns. Further, we used two interaction variables, one between real GSDP growth and the upturn dummy variable and the other between real GSDP growth and the downturn dummy variable. To test for the asymmetric reaction of state-level government spending to positive and negative output gaps, the following equation is used: d(log EXPit) = β0i + γt + βu d(log Yut)*dumu + βd d(log Ydt)*dumd+ β2 FDi,t-1 + β3 d(log TRit) + uit …(2) where βu ≠ βd and the suffixes u and d indicate whether the coefficient applies to a positive or negative output gap period. For example, when the observation for the output gap is positive, log Yut equals the observed value of real GSDP growth; when the output gap is negative, log Yut is zero. Table 8: Pro-cyclicality of Social Sector Expenditure to Output Gap:
Panel Regression Coefficients | | | Social Sector Expenditure | Education Expenditure | | | LS | IV | 2SLS | LS | IV | 2SLS | | Constant | -0.01 | 0.20 | -0.09* | -0.5** | -0.19 | -0.17* | | Output Gap | 0.17 | -0.04 | 0.08 | 0.60** | 0.33* | 0.98** | | Fiscal deficit (Lagged) | -0.03** | -0.03** | -0.02** | -0.02** | -0.03** | -0.01* | | Gross Transfers | 0.18** | 0.18** | 0.16** | 0.07* | 0.08* | 0.03 | | Political Party Dummy | 0.01 | 0.01 | -0.03 | 0.03* | -0.04 | -0.04 | | AR(1) | | | -0.16** | | | -0.01 | | Number of States | 17 | 17 | 17 | 17 | 17 | 17 | | Number of Observations | 204 | 187 | 187 | 204 | 187 | 187 | Note: 1. ** and * indicate significance of coefficient at 1 per cent and 5 per cent levels, respectively.
2. LS: Least Squares; IV: Instrumental Variable; 2SLS: Two Stage Least Squares. | Tables 8 and 9 report the responses of social sector and education expenditures to upturns and downturns as measured in terms of positive and negative output gaps. Regression coefficients clearly indicate that when we use the output gap as the variable, education expenditures turn out to be pro-cyclical even as social sector expenditures continue to be acyclical. Further, social sector expenditures remain acyclical during both the upturn and downturn phases, while education expenditures show asymmetric behaviour - being pro-cyclical during upturns and acyclical during downturns. This result is similar to the findings of Clements et al. (2007) and Granado et al. (2013) that education and health expenditures are pro-cyclical in good times but acyclical in bad times. While the pro-cyclical behaviour during upturns may be indicative of the fiscal ‘voracity effect’, acyclical behaviour during downturns is attributed by Granado et al. (2013) to asymmetric behavior prompting countries to protect social spending during times when the GDP falls below the potential level. This logic may also hold for Indian states as they do not allow spending on education and health to fall below a particular level, despite a downturn due to socio-political reasons.14 This also reflects the increasing priority that has been accorded by the states to the education sector in line with the implementation of the Sarva Shiksha Abhiyan (SSA) and subsequently the Right to Education Act,15 for which they receive financial support from the central government. Table 9: Pro-cyclicality of Social Sector Expenditure during Upturns and
Downturns: Panel Regression Coefficients | | | Social Sector Expenditure | Education Expenditure | | LS | IV | 2SLS | LS | IV | 2SLS | | Constant | 0.14** | 0.14** | 0.29** | 0.12** | 0.13** | 0.11* | | GSDP - Upturn | 0.22 | 0.18 | -1.48 | 0.44** | 0.30** | 0.81 | | GSDP - Downturn | 0.01 | 0.15 | -1.33 | -0.05 | -0.08 | -0.35 | | Fiscal deficit | -0.03** | -0.03** | -0.03** | -0.02** | -0.02** | -0.01* | | Gross Transfers | 0.17** | 0.13** | 0.19** | 0.05 | 0.02 | 0.01 | | Political Party Dummy | 0.01 | 0.01 | -0.02 | 0.03* | 0.03* | -0.04 | | AR(1) | | | -0.15* | | | -0.01 | | Number of States | 17 | 17 | 17 | 17 | 17 | 17 | | Number of Observations | 204 | 187 | 187 | 204 | 187 | 187 | Note: 1. ** and * indicate significance of coefficient at 1 per cent and 5 per cent levels, respectively.
2. LS: Least Squares; IV: Instrumental Variable; 2SLS: Two Stage Least Squares. | Fiscal balance is observed to be a consistent and significant determinant of social sector expenditure in all time periods, albeit its coefficient is smaller vis-à-vis other explanatory variables. Among other control variables, gross transfers from the central government and the political dummy variable seem to be influencing social sector expenditure and education expenditures respectively. Big States versus Small States Given that education expenditures are observed to be pro-cyclical, the empirical analysis is extended to examine whether this holds for all the NSC states or there are variations across these states based on their income levels. Following Arena and Revilla’s (2009) approach in their study on the cyclicality of fiscal policy at the sub-national level in Brazil, 17 NSC states in India were classified into two categories- big and small (in terms of income) - based on their per capita GSDP as per the 2011 Census. Accordingly, the top nine states were taken as big states that had per capita GSDP (at current prices) higher than ₹75,000 in 2011. These include Andhra Pradesh, Goa, Gujarat, Haryana, Karnataka, Kerala, Maharashtra, Punjab and Tamil Nadu. The smaller states include Bihar, Chhattisgarh, Jharkhand, Madhya Pradesh, Odisha, Rajasthan, Uttar Pradesh and West Bengal. Table 10 provides the cyclicality coefficients of education expenditure with respect to output gap separately for big and small states. Table 10: Pro-cyclicality of Education Expenditure in Big and Small States:
Panel Regression Coefficients | | | Big States | Small States | | LS | IV | 2SLS | LS | IV | 2SLS | | Constant | 0.11** | 0.12** | -0.12* | 0.13** | 0.14** | 0.16* | | Output gap | 0.89** | 0.48* | 0.85* | 0.12 | -0.02 | 0.27 | | Fiscal deficit | -0.02** | -0.02** | -0.02* | -0.02** | -0.02** | -0.01* | | Gross Transfers | 0.01 | 0.03 | 0.03 | 0.40** | 0.39* | 0.09 | | Political Party Dummy | 0.03* | 0.04* | -0.01 | -0.01 | -0.01 | -0.11 | | AR(1) | | | -0.04* | | | -0.02* | Note: 1. ** and * indicate significance of coefficient at 1 per cent and 5 per cent levels, respectively.
2. LS: Least Squares; IV: Instrumental Variable; 2SLS: Two Stage Least Squares. | Education expenditure is observed to be strongly pro-cyclical with respect to the output gap in the case of big states. More than state incomes, it is gross transfers from the central government that influence education expenditures of small states. This is probably because transfers, on an average, account for close to 60 per cent of the revenue receipts of the states falling in this group. Fiscal balance is also observed to be a significant determinant of education expenditure in both big and small states, albeit its coefficient is smaller vis-à-vis other explanatory variables namely, real GSDP and fiscal transfers from the centre to these states. Section V
Conclusion and Policy Implications The paper studied the cyclical behaviour of social sector expenditure across Indian states during the 2000s. Empirical evidence suggests that the overall social sector spending is acyclical in India at the state level, while education spending turns out to be pro-cyclical with the pro-cyclicality being more pronounced in situations of positive output gaps (upturns) and for bigger states. As states tend to protect social sector expenditures during negative output gap periods, it explains their acyclical behaviour. This is also evident from a consistent increase in the share of social sector expenditure in total revenue expenditure of NSC states. Fiscal deficit, albeit with a small coefficient value, was the most significant and consistent variable impacting social sector expenditures in the 2000s. This provides support to the fiscal voracity effect hypothesis (Tornell and Lane 1999; Talvi and Vegh 2000). Improvement in the fiscal position provokes intense lobbying for higher social sector spending which holds for all states and during all time periods. The paper reinforces the need for further fiscal consolidation as this would provide more headroom to state governments for carrying out social sector expenditures during phases of growth slowdown. To conclude, state governments need to ensure that their social sector spending is protected to achieve inclusive and sustainable development in the medium to long-term. High income states which are fiscally better placed should be the front runners in pursuing this objective. Needless to say, this is extremely relevant for India that has a huge demographic dividend which it can tap in the future. Going forward, further research in the area could explore the impact of other factors influencing social sector expenditures in India like the level of fiscal autonomy (Binswanger et al. 2014), service delivery framework. The study can also be extended to special category states depending upon the availability of data.
Annex-I | Pro-cyclicality of Social Sector Expenditure: A Review of Literature | | Study | Scope | Method/Data/ Period | Focus | Finding/conclusion | | I. Cross - country studies on cyclicality of fiscal policy at aggregate level | | Akitoby, Clements, Gupta & Inchauste (2004) | 51
Countries | - Examination of short term and long term movement of government spending relative to output. | Focuses on the cyclical and long-term behaviour of government expenditures in developing countries. | - The main components of government spending are pro-cyclical in about half of the countries, the degree of which varies across spending categories. - Output volatility and financial risks contribute to pro-cyclicality of government spending. | | Michael Gavin & Robert Perrotti (1997) | Latin America and industrial countries | - 1968 to 1995 - Regression analysis using fiscal indicators of the general government. | A comparison of pro- cyclicality of fiscal policy in Latin America and industrialised countries. | - Fiscal policy in Latin America is pro- cyclical whereas it is acyclical in industrialised countries. - The major reasons for pro-cyclicality are the ‘voracity effect’” as well as limited access to international credit markets during downturns. | Alesina, Tabellina
& Campante (2007) | OECD and non- OECD
countries | - 1960-2003 - Panel regression using fiscal policy indicators | - Observes cyclical response of the budget surplus and total government spending in different countries. - Examines the sources of pro-cyclicality. | - During booms, people demand more public goods or lower taxes thereby leading to pro- cyclicality of fiscal policy. - The major reasons for pro-cyclicality in a democratic country are corruption as well as credit constraints. | Kaminsky, Reinhart
and Vegh (2004) | OECD &
Non- OECD
countries | - 1960-2003 - Analytical framework for interpreting the behaviour of fiscal indicators. | Empirically documenting the cyclical properties of macroeconomic policies in developing countries. | In developing countries, fiscal policy is pro- cyclical whereas in OECD countries it is either acyclical or counter-cyclical. | | Jaimovich and Panizza (2007) | Industrial and developing countries. | - 1970-2003 - Instrument variable estimation | - Challenging the convention that fiscal policy is pro-cyclical in developing countries. | No statistically significant difference between the cyclicality of fiscal policy in developing and industrial countries. | | II. Cross-country studies on the cyclicality of social expenditure at aggregate level | | Javier Arze, Sanjeev Gupta, and Alejandro Hajdenberg (2012) | 29
developed and 121 developing countries | - IMF’s database - Regression techniques. | Examination of cyclical behaviour of public spending on health and education. | - The spending on education and health is pro-cyclical in developing countries whereas it is acyclical in developed countries. - The degree of cyclicality is inverse to economic development. | | Nadia Doytch, Bingjie Hu, Ronald U Mendoza (2010) | Latin America, Caribbean and low income countries of the world. | - World Bank dataset from 1980 to 2009. - OLS, Fixed Effects (FE) used for empirical analysis. | - Is social spending pro- cyclical? Are more stable and less corrupt governments more likely to undertake counter- cyclical social spending? | - High-income economies and lowest income economies are able to implement the policies of counter-cyclical social spending whereas the lower middle income countries are unable to do so. - Bureaucracy quality, control of corruption and government stability promote counter- cyclical spending. | | Julia Darby & Jacques Melitz (2008) | 21 OECD
countries | - OECD social expenditure and OECD economic outlook database from 1982 to 2003. | Analyses cyclical responsiveness of fiscal expenditure items. | Expenditures on health, retirement, incapacity, sick pay as well as unemployment compensation are highly pro-cyclical. | | III. Cross-country studies on the cyclicality of social expenditure at the sub-national level | | Wibbels and Rodden (2006) | 8 federations
(US, Canada, Germany, Australia, Spain, India, Brazil and Argentina) | - Utilising annual data pertaining to revenue, expenditure, deficit and GSDP. - Panel estimation. | Investigation of the sensitivity of provincial government finances to regional business cycles. | - Sub-national finances in the world’s most decentralized federations are pro-cyclical. - More decentralisation will heighten pro- cyclicality especially of health, education and social spending. | Sturzeneggar &
Werneck (2006) | Argentina
& Brazil | - Argentina 1992- 2002 - Brazil 1997-2002 - Time series and cross-sectional models. | - Are the sub-national fiscal policies pro- cyclical as well as the causes for pro-cyclicality. | - The spending of sub-national governments has been pro-cyclical in both Argentina and Brazil. - Reasons for pro-cyclicality: Voracity effect and lack of access to credit markets during times of crisis. | | Marco Arena & Julio Revilla (2007) | Brazilian
states | - 1991-2006 - Time series and cross-sectional data - OLS, Fixed Effects and Feasible Generalized Fixed Squares (FGFS) used. | Examination of pro- cyclicality of Brazilian states’ expenditures. | - There is pro-cyclicality in Brazilian states’ expenditures which is more during periods of downturn. - The main sources of the observed pro- cyclicality lie in the states’ own tax revenues. - Smaller states are more pro-cyclical than larger states for all revenue and expenditure categories. | | IV. Indian studies on social sector expenditure analysis | | Balbir Kaur & Sangita Misra (2003) | 15 General category states in India | - 1985-86 to 2000-01 - Regression analysis using panel data. | Analyses the level and effectiveness of social sector expenditure in education and health. | - Public spending on education has been more productive in the case of primary education than in the case of secondary education. - Relationship between public expenditure and health has been quite weak indicating inadequacy of health expenditure. | | Mahendra Dev (2002) | India | - Trend Analysis | Analysis of government spending on agriculture and social sectors. | - Central government as well as state spending on social sector is still quite low. | | Seema Joshi (2006) | India | Pre-Reform (1981- 82 to 1990-91) and post-reform period (1991-92 to 2000- 01). | Examines the impact of economic reforms on social sector expenditure. | - A decade of reforms has not brought much improvement in social sector spending as the share of social sector to GDP remained at a very low level of 2.7 per cent in 2000- 01 (which was 2.62 per cent in 1986-87). |
Annex II | Descriptive Statistics | | | Social Sector Expenditures | Education Expenditures | Health Expenditures | GSDP | Fiscal Deficit to GSDP
ratio (per cent) | Growth in transfer receipts in real terms
(per cent) | | Real Growth in per cent | | Andhra Pradesh | | Mean | 9.6 | 8.8 | 7.4 | 7.6 | 3.2 | 8.2 | | Median | 11.2 | 7.6 | 5.9 | 8.2 | 2.9 | 7.7 | | Maximum | 21.3 | 36.0 | 24.3 | 12.0 | 4.8 | 28.6 | | Minimum | -9.9 | -2.7 | -2.9 | 2.7 | 1.9 | -18.4 | | Std.Deviation | 9.4 | 11.3 | 7.5 | 2.8 | 0.9 | 13.6 | | Observations | 13 | 13 | 13 | 13 | 13 | 13 | | Bihar | | Mean | 6.8 | 5.6 | 5.3 | 8.5 | 4.1 | 8.9 | | Median | 3.0 | 4.2 | 1.3 | 11.8 | 3.2 | 9.5 | | Maximum | 42.3 | 33.0 | 56.2 | 16.0 | 8.1 | 27.7 | | Minimum | -26.2 | -27.5 | -31.0 | -5.1 | 1.5 | -12.5 | | Std.Deviation | 18.6 | 16.7 | 24.7 | 7.5 | 2.3 | 12.4 | | Observations | 13 | 13 | 13 | 13 | 13 | 13 | | Chhattisgarh | | Mean | 13.6 | 16.1 | 12.0 | 8.6 | 1.8 | 12.5 | | Median | 10.2 | 16.9 | 4.0 | 8.4 | 1.8 | 13.5 | | Maximum | 36.0 | 33.0 | 56.3 | 18.6 | 5.6 | 31.2 | | Minimum | -6.4 | 1.7 | -3.0 | 2.5 | -0.3 | -0.3 | | Std.Deviation | 12.8 | 11.3 | 17.7 | 4.7 | 1.7 | 9.4 | | Observations | 11 | 11 | 11 | 11 | 11 | 11 | | Goa | | Mean | 10.7 | 8.7 | 7.8 | 7.6 | 4.1 | 18.5 | | Median | 8.3 | 7.9 | 2.4 | 9.4 | 4.2 | 0.9 | | Maximum | 44.2 | 44.1 | 39.0 | 10.2 | 5.5 | 191.4 | | Minimum | -0.8 | -13.9 | -6.9 | -3.7 | 1.7 | -44.1 | | Std.Deviation | 12.2 | 15.8 | 13.2 | 3.9 | 1.1 | 57.3 | | Observations | 13 | 13 | 13 | 13 | 13 | 13 | | Gujarat | | Mean | 7.9 | 6.0 | 8.2 | 8.9 | 3.4 | 7.2 | | Median | 9.0 | 4.9 | 7.4 | 8.9 | 2.8 | 5.3 | | Maximum | 21.0 | 30.0 | 35.4 | 14.9 | 6.7 | 28.0 | | Minimum | -14.5 | -15.7 | -22.7 | -4.9 | 1.4 | -14.2 | | Std.Deviation | 10.7 | 11.1 | 15.1 | 4.8 | 1.5 | 12.9 | | Observations | 13 | 13 | 13 | 13 | 13 | 13 | | Haryana | | Mean | 10.8 | 9.2 | 7.8 | 8.7 | 2.3 | 10.5 | | Median | 19.2 | 10.0 | 4.8 | 8.4 | 2.5 | 5.1 | | Maximum | 30.3 | 24.9 | 30.0 | 11.7 | 4.5 | 54.9 | | Minimum | -26.4 | -5.4 | -8.7 | 6.5 | -0.9 | -18.6 | | Std.Deviation | 16.3 | 8.6 | 11.8 | 1.5 | 1.6 | 20.3 | | Observations | 13 | 13 | 13 | 13 | 13 | 13 | | Jharkhand | | Mean | 9.1 | 11.0 | 10.1 | 7.0 | 4.7 | 12.7 | | Median | 11.9 | 11.5 | -0.2 | 7.2 | 4.3 | 22.6 | | Maximum | 28.4 | 41.4 | 102.6 | 20.5 | 8.1 | 32.5 | | Minimum | -15.9 | -29.2 | -10.1 | -3.2 | 1.8 | -20.8 | | Std.Deviation | 11.2 | 19.1 | 32.5 | 7.1 | 2.3 | 19.7 | | Observations | 11 | 11 | 11 | 11 | 11 | 11 | | Karnataka | | Mean | 8.5 | 7.4 | 6.7 | 7.3 | 2.9 | 9.9 | | Median | 9.1 | 9.1 | 5.7 | 7.1 | 2.8 | 10.1 | | Maximum | 17.0 | 17.1 | 28.3 | 12.6 | 5.0 | 28.2 | | Minimum | -4.7 | -5.8 | -11.0 | 1.3 | 1.9 | -11.9 | | Std.Deviation | 6.4 | 7.5 | 10.4 | 3.2 | 0.9 | 10.8 | | Observations | 13 | 13 | 13 | 13 | 13 | 13 | | Kerala | | Mean | 7.9 | 7.3 | 8.6 | 6.1 | 3.6 | 9.8 | | Median | 5.7 | 7.0 | 7.1 | 8.1 | 3.4 | 6.1 | | Maximum | 29.1 | 28.0 | 29.6 | 11.4 | 5.2 | 33.3 | | Minimum | -12.1 | -7.6 | -8.5 | -6.9 | 2.5 | -11.2 | | Std.Deviation | 14.9 | 9.9 | 10.0 | 5.5 | 0.8 | 16.2 | | Observations | 13 | 13 | 13 | 13 | 13 | 13 | | Madhya Pradesh | | Mean | 7.4 | 6.6 | 6.4 | 7.7 | 3.6 | 9.4 | | Median | 8.3 | 4.4 | 5.3 | 9.2 | 2.8 | 8.0 | | Maximum | 24.8 | 23.6 | 26.2 | 16.5 | 7.3 | 27.5 | | Minimum | -16.8 | -23.8 | -20.9 | -5.2 | 1.7 | -13.8 | | Std.Deviation | 11.9 | 14.3 | 12.0 | 5.8 | 1.7 | 12.1 | | Observations | 13 | 13 | 13 | 13 | 13 | 13 | | Maharashtra | | Mean | 8.6 | 7.1 | 7.2 | 7.7 | 2.8 | 11.7 | | Median | 10.2 | 3.7 | 8.0 | 8.0 | 3.1 | 8.2 | | Maximum | 24.9 | 28.1 | 15.7 | 13.5 | 4.9 | 50.8 | | Minimum | -3.8 | -7.2 | -7.0 | -2.1 | -0.4 | -8.0 | | Std.Deviation | 8.2 | 10.1 | 6.8 | 4.3 | 1.5 | 17.4 | | Observations | 13 | 13 | 13 | 13 | 13 | 13 | | Odisha | | Mean | 5.5 | 5.5 | 5.9 | 7.4 | 2.3 | 7.2 | | Median | 7.3 | 1.3 | 5.6 | 7.5 | 1.4 | 8.4 | | Maximum | 26.9 | 29.3 | 22.8 | 15.1 | 7.8 | 26.6 | | Minimum | -18.9 | -11.5 | -28.5 | -1.7 | -1.0 | -12.6 | | Std.Deviation | 12.3 | 11.0 | 14.2 | 5.0 | 3.0 | 12.1 | | Observations | 13 | 13 | 13 | 13 | 13 | 13 | | Punjab | | Mean | 9.5 | 5.5 | 6.5 | 5.7 | 4.0 | 6.8 | | Median | 7.5 | 2.3 | 3.8 | 5.9 | 3.7 | 4.7 | | Maximum | 51.8 | 42.4 | 40.9 | 10.2 | 6.2 | 59.3 | | Minimum | -20.2 | -5.7 | -7.7 | 1.9 | 2.4 | -16.8 | | Std.Deviation | 18.9 | 12.8 | 13.3 | 2.2 | 1.2 | 19.9 | | Observations | 13 | 13 | 13 | 13 | 13 | 13 | | Rajasthan | | Mean | 6.9 | 5.8 | 5.7 | 7.1 | 3.6 | 7.2 | | Median | 6.6 | 4.7 | 2.8 | 6.7 | 3.6 | 10.0 | | Maximum | 21.8 | 29.1 | 27.9 | 28.7 | 6.3 | 17.6 | | Minimum | -5.3 | -10.0 | -14.5 | -9.9 | 1.2 | -9.1 | | Std.Deviation | 7.8 | 9.4 | 11.7 | 9.3 | 1.8 | 9.5 | | Observations | 13 | 13 | 13 | 13 | 13 | 13 | | Tamil Nadu | | Mean | 8.8 | 6.4 | 6.8 | 7.7 | 2.4 | 8.0 | | Median | 11.0 | 8.6 | 2.9 | 6.1 | 2.5 | 4.7 | | Maximum | 24.0 | 16.3 | 33.4 | 15.2 | 3.9 | 43.8 | | Minimum | -7.3 | -7.4 | -5.0 | -1.6 | 0.9 | -15.0 | | Std.Deviation | 8.3 | 8.3 | 12.2 | 5.0 | 0.9 | 14.3 | | Observations | 13 | 13 | 13 | 13 | 13 | 13 | | Uttar Pradesh | | Mean | 9.7 | 8.7 | 10.8 | 5.7 | 4.0 | 9.1 | | Median | 8.3 | 9.0 | 9.5 | 6.5 | 3.6 | 10.4 | | Maximum | 25.2 | 23.8 | 32.1 | 8.1 | 7.0 | 19.6 | | Minimum | -4.8 | -3.9 | -8.5 | 2.2 | 2.4 | -4.5 | | Std.Deviation | 9.9 | 9.0 | 12.3 | 1.9 | 1.3 | 6.7 | | Observations | 13 | 13 | 13 | 13 | 13 | 13 | | West Bengal | | Mean | 6.7 | 5.0 | 5.0 | 6.4 | 5.1 | 11.1 | | Median | 4.4 | 6.5 | 3.9 | 6.3 | 4.4 | 13.1 | | Maximum | 31.8 | 39.7 | 37.9 | 8.0 | 7.6 | 45.7 | | Minimum | -14.2 | -18.5 | -7.9 | 3.8 | 2.6 | -13.6 | | Std.Deviation | 11.5 | 13.2 | 12.2 | 1.4 | 1.6 | 16.3 | | Observations | 13 | 13 | 13 | 13 | 13 | 13 | | Note: For Chhattisgarh and Jharkand, data is available from 2001-02 onwards. |
Annex III
Central Government Flagship Programmes on Education Sarva Shiksha Abhiyan (SSA)/ Education for All Movement: Sarva Shiksha Abhiyan is the Government of India’s flagship programme for achieving Universalisation of Elementary Education (UEE) in a time bound manner. SSA is being implemented in partnership with state governments to cover the entire country. It has been operational since 2000-01. The expenditure on the programme is shared by the central government (85 per cent) and state governments. The Right of Children to Free and Compulsory Education Act or Right to Education Act (RTE) is a legislation enacted by the Parliament of India on August 4, 2009, which describes the modalities of the importance of free and compulsory education for children between 6 and 14 years in India under Article 21A of the Indian Constitution. The Act came into force on April 1, 2010. The RTE Act lays down specific responsibilities for the centre, states and local bodies for its implementation. In April 2010 the central government agreed to share the funding for implementing the law in the ratio of 65 to 35 between the centre and the states, and a ratio of 90 to 10 for the north-eastern states. However, in mid-2010, the centre agreed to raise its share to 68 per cent. Mid-day Meal Scheme (MDMS): The Mid-day Meal Scheme is a multi-faceted programme of the Government of India. The cost of the MDMS is shared between the central and state governments. At present 75 per cent of the scheme is funded by the central government whereas 25 per cent of the funds are provided by state governments. The central government provides free foodgrains to the states. The cost of cooking, infrastructure development, transportation of foodgrains and payment of honorarium to cooks and helpers is shared by the centre with the state governments. The contribution of state governments to the scheme differs from state to state. Rashtriya Madyamik Shiksha Abhiyan (RMSA): This scheme was launched in March 2009 with the objective of enhancing access to secondary education and for improving its quality. The implementation of the scheme started in 2009-10. The scheme is being implemented by state government societies established for its implementation. The central share is released to the implementing agency directly. The applicable state share is also released to the implementing agency by the respective state government. As regards the financing pattern, the union government met 75 per cent of the project expenditure during the 11th Five Year Plan, with 25 per cent of the cost being borne by state governments. The sharing pattern is 50:50 for the 12th Five Year Plan. For both the 11th and 12th Plans, funding pattern has been 90:10 for the north-eastern states. Saakshar Bharat: The main objective of this scheme is to further promote and strengthen adult education, especially for women. The share of funding between the central and state governments is in the ratio of 75:25 and in the case of north-eastern states including Sikkim in the ratio of 90:10.
References Akitoby, B., B. Clements, S. Gupta and G. Inchauste (2004), ‘The Cyclical and Long-Term Behaviour of Government Expenditures in Developing Countries’, IMF Working Paper No. WP/04/202. Alesina, Alberto, R. Filipe Campante and Guido Tabellini (2008), ‘Why is Fiscal Policy Often Procyclical?’, Journal of European Economic Association 6(5): 1006-1036. Alesina, Alberto and Guido Tabellini (2005), ‘Why is Fiscal Policy Often Procyclical?’, NBER Working Paper No. 11600. Cambridge, Massachusetts: MIT Press. Arena, Marc and Julio E. Revilla (2009), ‘‘Pro-cyclical fiscal policy in Brazil: evidence from the states’, Policy research working paper series 5144, The World Bank. Belsley, d.a., E. Kuh and R.E. Welsch (1980), Regression Diagnostics: Identifying Influential Data and Sources of Collinearity. New York: Wiley Publications. Binswanger-Mkhize, H.P., H.K. Nagarajan, N. Prasad and A. Tagat (2014), ‘The Determinants and Impacts, of Local Revenue raising and Higher Level Grants in Rural India’, RBI Endowment Unit Working Paper No.5.Institute of Rural Management (IRMA). Brunetti, Aymo (1997), ‘Political variables in cross country growth analysis’, Journal of Economic Surveys 2. Caballero, Richard J. and Arvind Krishnamurthy (2004), ‘Fiscal Policy and Financial Depth’, NBER Working Paper 10532. National Bureau of Economic Research, Inc. Clements, B., C. Fair cloth and M. Varhoeven (2007), ‘Public Expenditure in Latin America: Trends and Key Policy issues’, CEPAL Review 93: 37-60. Cukierman, Alex, Sebastin Edwards and Guido Tablellini (1992), ‘Seignorage and Political Instability’, American Economic Review 82 (3): 537-55. Darby, Julia and Jacques Melitz (2008), ‘Social spending and automatic stabilizers in the OECD’, Economic Policy 23 (56): 715–56. Dev, S. Mahendra (2003), ‘Agriculture, employment & social sector neglected’, Economic and Political Weekly 38 (14): 1353-56. Dev, S. Mahendra and Jos Mooij (2002), ‘Social sector expenditure in the 1990s: Analysis of central and state budgets’, Economic and Political Weekly 37 (9): 853-66. Granado, Del, Arze G. Javier and A. Hajdenberg (2013), ‘Is social spending procyclical? Evidence for developing countries’, World Development 42 (C): 16-27. Gavin, Michael and Roberto Perotti (1997), ‘Fiscal policy in Latin America’, National Bureau of Economic Research Macroeconomic Annual 12: 11–61. Gavin, M., R. Hausman, R. Perotti and E. Talvi (1996), ‘Managing Fiscal Policy in Latin America and the Caribbean: Volatility, Procyclicality and limited creditworthiness’, IDB Working Paper No.326. Inter-American Development Bank. Im, Kyung So, M .Hashem Pesaran and Yongcheol Shin (2003), ‘Testing for Unit roots in Heterogeneous Panels’, Journal of Econometrics 115 (1): 53-74. Jaimovich, Dany and Ugo Panizza (2007), ‘Procyclicality or Reverse Causality?’, IDB Working Paper No. 599. Inter American Development Bank. Javier, Arze G., S. Gupta and A. Hajdenberg (2010), ‘Is social Spending Procyclical?’, IMF Working Paper No. WP/10/234. Joshi, Seema (2006), ‘Impact of economic reforms on social sector expenditure in India’, Economic and Political Weekly 41 (4): 358-65. Kaminsky, G., C. Reinhart and C. Vegh (2004), ‘When it Rains it Pours: Procyclical Capital Flows and Macroeconomic Policies’, NBER Macroeconomic Annual. Cambridge, MA.: MIT Press. Kaur, Balbir and Sangita Misra (2003), ‘Social sector expenditure and attainments: An Analysis of Indian states’, RBI Occasional Papers, 24 (1 &2): 105-43. Lane, Philip R. (2003), ‘The Cyclical Behavior of Fiscal Policy: Evidence from the OECD’, Journal of Public Economics 87 (12): 2661-75. Levin, A., C. Lin and C. J. Chu (2002), ‘Unit root tests in Panel data: Asymptotic and finite sample properties’, Journal of Econometrics 108 (1): 1-24. Nadia, Doytch, Hu Bingjie and Ronald Mendoza (2010), ‘Social spending, fiscal space & governance: An analysis of pattern over the business cycles’, UNICEF Policy and Practice, March. Pinto, Brian (2009), ‘How can (and should) developing countries engage in countercyclical fiscal policies?’, The Shadow GN, the World Bank. Reserve Bank of India (2013) Report on State Finances: Study of Budgets of 2012–13. Mumbai: RBI. ——— (2012) Annual Report 2011–12. ——— (2012) Handbook of Statistics of Indian Economy. Rodden, J and R. Wibbels (2006), ‘Fiscal decentralisation of the business cycle: An empirical study of eight federations’, available at: http://citeseerx.ist.psu.edu/viewdoc/download?doi=10.1.1.118.9649&rep=rep1&type=pdf Shah, Ajay and Illa Patnaik (2010), ‘Stabilising the Indian business cycle’, NIPFP Working Paper 67. National Institute of Public Finance and Policy. Sturzeneggar, F. and R. Werneck (2006), ‘Fiscal federalism & pro cyclical spending: The cases of Argentina & Brazil’, Economica, La plata LII (1&2): 151-93. Talvi, Ernesto and Carlos A. Végh (2000), ‘Tax Base Variability and Procyclical Fiscal Policy’, NBER Working Paper No. 7499. National Bureau of Economic Research. The World Bank (2012), World Development Report 2013. Washington, D.C: The World Bank. Tornell, Aaron and Phillip R. Lane (1999), ‘The Voracity Effect’, American Economic Review 89 (1): 22–46. Woo, J. (2009), ‘Why do more polarized countries run more procyclical policies?’, Review of Economics and Statistics 91(4): 850-70.
|