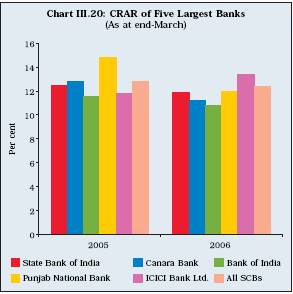
3.84 The CRAR of five largest banks, which accounted for 40.7 per cent of total assets of SCBs, behaved in a divergent manner. The CRAR of all banks, except ICICI Bank, declined during the year (Chart III.20).
3.85 At the individual bank level, the CRAR of all banks barring two banks (Sangli Bank Ltd.
Table III.38: Distribution of Scheduled Commercial Banks by CRAR |
(Number of banks) |
Bank Group |
2004-05 |
|
2005-06 |
|
Below |
Between |
Between |
Above |
Below |
Between |
Between |
Above |
|
4 per cent |
4-9 per cent |
9-10 per cent |
10 per cent |
4 per cent |
4-9 per cent |
9-10 per cent |
10 per cent |
1 |
2 |
3 |
4 |
5 |
6 |
7 |
8 |
9 |
Nationalised Banks |
ñ |
ñ |
2 |
17 |
ñ |
ñ |
ñ |
19 |
State Bank Group |
ñ |
ñ |
ñ |
8 |
ñ |
ñ |
ñ |
8 |
Other Public Sector Bank |
ñ |
ñ |
ñ |
1 |
ñ |
ñ |
ñ |
1 |
Old Private Sector Banks |
1 |
1 |
3 |
15 |
2 |
ñ |
1 |
16 |
New Private Sector Banks |
ñ |
ñ |
2 |
7 |
|
ñ |
1 |
7 |
Foreign Banks |
ñ |
ñ |
1 |
30 |
ñ |
ñ |
2 |
27 |
Total |
1 |
1 |
8 |
78 |
2 |
ñ |
4 |
78 |
ñ : Nil/Negligible. |
|
|
|
|
|
|
|
|
and United Western Bank)5 in the old private sector group, was above the minimum capital requirement of nine per cent. The CRAR of as many as 78 banks was above 10 per cent (Table III.38 and Appendix Table III.30). At this level, commercial banks on the whole should be able to meet the Basel II standards of capital adequacy.
6. Banksí Operations in the Capital Market
3.86 In order to meet the requirements of Basel II and increased demand for credit, several commercial banks accessed the capital
market during 2005-06.
Resources Raised by Banks from the Primary Capital Market
3.87 Scheduled commercial banks, both in public and private sectors, raised large amount of resources from the domestic and international capital markets to strengthen their capital base. Total resource mobilisation by banks through public issues in the domestic capital market during 2005-06 increased by 24.0 per cent. Encouraged by a firm trend in the prices of the banking sector, eleven banks raised Rs.11,067 crore from the equity market during 2005-06. This included six equity issues aggregating Rs.5,413 crore by public sector banks and five equity issues aggregating Rs.5,654 crore (including premium) by private sector banks (Table III.39).
Table III.39: Public Issues by the Banking Sector |
(Amount in Rs. crore) |
Year |
Public Sector Banks |
Private Sector Banks |
|
Total |
|
Grand Total |
|
Equity |
Debt |
Equity |
Debt |
Equity |
|
Debt |
|
1 |
2 |
3 |
4 |
5 |
6 |
|
7 |
8 |
2003-04 |
1,104 |
ñ |
ñ |
1,352 |
1,104 |
|
1,352 |
2,456 |
2004-05 |
3,336 |
ñ |
4,108 |
1,478 |
7,444 |
|
1,478 |
8,922 |
2005-06 |
5,413 |
†ñ |
†5,654 |
†ñ |
†11,067 |
|
†ñ |
† 11,067 |
ñ : Nil/Negligible. |
|
|
|
|
|
|
|
|
3.88 Six public sector banks accessing the capital market were Allahabad Bank, Oriental Bank of Commerce, Syndicate Bank, Andhra Bank, Bank of Baroda and Union Bank of India (Table III.40). Five private sector banks, which raised resources from the capital market during the year were Lakshmi Vilas Bank Ltd., Yes Bank Ltd., ICICI Bank Ltd., the South Indian Bank Ltd. and the United Western Bank Ltd.
3.89 None of the banks raised debt through public issues. Resources raised through the private placement market by banks also increased sharply by 98.1 per cent during 2005-06 (Table III.41).
Table III.40: Resources Raised by Banks through |
Public Issues ñ 2005-06 |
Name of the Bank |
Face |
Issue |
Size of issue(Rs. crore) |
|
Value(Rs.) |
Price
(Rs.) |
Amount |
Premium |
Total |
1 |
2 |
3 |
4 |
5 |
6 |
A. Public Sector Banks |
|
|
409 |
5,004 |
5,413 |
Allahabad Bank |
10 |
82 |
100 |
720 |
820 |
Oriental Bank of |
|
|
|
|
|
Commerce |
10 |
250 |
58 |
1,392 |
1,450 |
Syndicate Bank |
10 |
50 |
50 |
200 |
250 |
Andhra Bank |
10 |
90 |
85 |
680 |
765 |
Bank of Baroda |
10 |
230 |
71 |
1,562 |
1,633 |
Union Bank of India |
10 |
110 |
45 |
450 |
495 |
B. Private Sector Banks |
|
|
218 |
5,436 |
5,654 |
Lakshmi Vilas Bank Ltd. |
10 |
50 |
9 |
36 |
45 |
Yes Bank Ltd. |
10 |
45 |
70 |
245 |
315 |
ICICI Bank Ltd. |
10 |
525 |
98 |
5,003 |
5,101 |
South Indian Bank Ltd. |
10 |
66 |
23 |
127 |
150 |
United Western Bank Ltd. |
10 |
24 |
18 |
25 |
43 |
Total (A+B) |
|
|
627 |
10,440 11,067 |
Performance of Banking Stocks in the Secondary Market
3.90 Continuing the trend of the previous year, the stock markets in India witnessed buoyant conditions during 2005-06 on the back of strong FIIs inflows, driven mainly by robust macroeconomic fundamentals and strong corporate profitability. The BSE Sensex closed at an all-time high level of 12,612.38 on May 10, 2006. However, immediately thereafter, the domestic stock markets witnessed a sharp correction in line with major international equity markets, especially emerging markets, mainly due to sharp decline in base metal prices on London Metal Exchange (LME) and fears of further rise in US interest rates. Heavy net sales by FIIs in the Indian equity market, concerns over sharp rise in global crude oil prices and depreciation of rupee vis-‡-vis major currencies also dampened the market sentiment. The BSE Sensex touched 8,929 on June 14, 2006, registering a decline of 20.8 per cent over end-March 2006. Stock markets, however, recouped the losses as the BSE sensex reached a new high of 13,131 on November 3, 2006, reflecting fresh buying by FIIs, strong macroeconomic fundamentals, robust corporate performance and recovery in major international stock markets.
Table III.41: Resources Raised by Banks |
through Private Placements |
(Amount in Rs. crore) |
Category |
2004-05 |
2005-06 |
|
No. of |
Amount |
No. of |
Amount |
|
Issues |
Raised |
Issues |
Raised |
1 |
2 |
3 |
4 |
5 |
A. |
Public Sector Banks |
43 |
9,039 |
73 |
22,317 |
B. |
Private Sector Banks |
44 |
6,180 |
24 |
7,834 |
|
Total (A+B) |
87 |
15,219 |
97 |
30,151 |
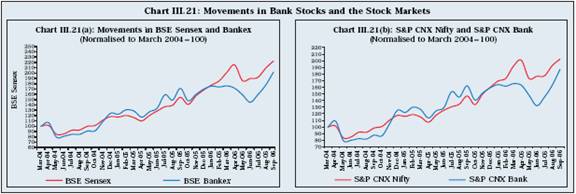
3.91 In line with the general uptrend, banking sector stocks also remained firm up to December 2005 [Chart III.21(a) and 21(b)]. Apart from favourable macroeconomic fundamentals, bank stocks were driven by some sector-specific developments. The progress of the banking sector reforms along with improvement in bankís balance sheets resulted in an increased interest in bank stocks. Banking sector scrips also gained due to several other factors such as, permission to banks to issue perpetual bonds and other hybrid instruments, favourable proposals in the Union Budget, 2006-07 relating to the banking sector such as conversion of non-tradable special securities into tradable SLR Government of India dated securities and inclusion of fixed deposits of scheduled banks of term not less than five years in Section 80C of the Income Tax Act.
3.92 Beginning January 2006, however, market participants revised downward their expectations of future earnings by banks on account of several factors such as uncertainty of interest rates, hikes in the US Fed Rate, lower than expected financial results of some major banks, concerns over rise in cost of funds of banks and squeeze in banksí profits due to increased loan provisioning and depreciation of investments. Reflecting this, the banking sector stocks underperformed the market during January to June 2006. However, performance of bank stocks improved begining July 2006 due to strong expectations of higher earnings and overall recovery in the stock market. The banking stocks, which underperformed in comparison with the general market and important sectoral indices during 2005-06, outperformed both the market and sectoral indices during 2006-07 (April-September) (Table III.42).
3.93 The returns generated by the banking stocks during 2005-06 at 36.8 per cent were higher than those in the previous year (28.6 per cent). The increase in returns during 2005-06 was particularly significant when viewed along with low volatility (measured in terms of co-efficient of variation) of banking stocks (Table III.43).
Table III.42: Return on Banking Stocks* |
(Per cent) |
Year |
BSE Sensex |
BSE 500 |
Sectoral Indices |
|
|
|
Bankex |
FMCG |
IT |
PSU |
Capital |
Consumer |
|
|
|
|
|
|
|
Goods |
Durables |
1 |
2 |
3 |
4 |
5 |
6 |
7 |
8 |
9 |
2002-03 |
-12.1 |
-8.0 |
16.2 |
-23.5 |
-20.4 |
10.1 |
26.4 |
15.1 |
2003-04 |
83.4 |
109.4 |
118.6 |
31.3 |
29.2 |
148.1 |
147.3 |
68.4 |
2004-05 |
16.1 |
21.9 |
28.6 |
11.6 |
59.5 |
8.1 |
39.9 |
50.5 |
2005-06 |
73.7 |
65.2 |
36.8 |
109.9 |
49.2 |
44.0 |
156.0 |
115.4 |
2006-07 (April-September) |
10.4 |
4.9 |
14.7 |
-6.6 |
9.0 |
-4.9 |
0.4 |
-3.4 |
* : Percentage variations in indices measured on a point-to-point basis. |
Table III.43: Performance of Bank
Stocks ñ Risk and Return |
Indices |
Returns* |
Volatility@ |
|
2004-05 |
2005-06 |
2004-05 |
2005-06 |
1 |
2 |
3 |
4 |
5 |
Bankex |
28.6 |
36.8 |
17.1 |
11.8 |
BSE Sensex |
16.1 |
73.7 |
11.2 |
16.7 |
3.94 At an individual bank level, the scrips of most of public and private sector banks witnessed gains during 2005-06, except Oriental Bank of Commerce, Karur Vysya Bank Ltd. and Bank of Punjab Ltd. Among the public sector banks, the major gainers during 2005-06 were: State Bank of Mysore (90.3 per cent), Bank of India (72.8 per cent), Syndicate Bank (71.3 per cent), Allahabad Bank (65.8 per cent), Indian Overseas Bank (57.7 per cent), Andhra Bank (53.3 per cent), State Bank of Travancore (52.2 per cent) and State Bank of India (49.6 per cent). Among the private sector banks, the major gainers during 2005-06 included Kotak Mahindra Bank Ltd. (115.6 per cent), Karnataka Bank Ltd. (94.1 per cent), Centurion Bank of Punjab Ltd. (73.6 per cent), UTI Bank Ltd. (70.6 per cent), ICICI Bank Ltd. (63.5 per cent) and HDFC Bank Ltd. (50.5 per cent). The price/earning ratio of both public and private sector banks ranged widely. At end-March 2006, while the P/E ratio of public sector banks ranged between 5.0 and 26.0, the P/E ratio of private sector banks ranged between 4.8 and 143.6 with one bank (United Western Bank) having negative P/E ratio (Table III.44).
3.95 Bank stocks constituted a significant portion of market capitalisation of the Indian equity market at end-March 2006, even though there was some slide in their share. The share of turnover of bank stocks in total turnover declined during 2005-06 (Table III.45).
Shareholding Pattern in Public Sector Banks
3.96 The process of diversification of ownership of public sector banks continued during 2005-06. The number of public sector banks in which private shareholding ranged between 40-49 per cent increased from six at end-March 2005 to 11 as at end-March 2006. In three public sector banks, the private shareholding ranged between 30-40 per cent, and in another three between 20-30 per cent. However, there were
still four public sector banks in which Government shareholding was more than 90 per cent (Table III.46 and Appendix Table III.31). 3.97 Foreign Financial Institutions (FFIs) continued to show interest in Indian banks during 2005-06. As at end-March 2006, there were 20 Indian banks (twelve public sectors banks, five new private sector banks and three old private sector banks) in which shareholding of Financial Institutions (Non-Resident) was more than 10 per cent (Table III.47).
Table III.44: Share Prices and Price/Earning |
Ratios of Bank Stocks at BSE |
Name of the Bank |
Average Daily |
P/E Ratios |
|
Closing Prices (Rs.) |
End-March |
|
2004-05 |
2005-06 |
2005 |
2006 |
1 |
2 |
3 |
4 |
5 |
Public Sector Banks |
|
|
|
|
Allahabad Bank |
51.5 |
85.4 |
6.2 |
5.0 |
Andhra Bank |
62.8 |
96.3 |
8.3 |
8.1 |
Bank of Baroda |
191.1 |
226.2 |
9.5 |
10.4 |
Bank of India |
67.7 |
117.0 |
14.8 |
9.2 |
Bank of Maharashtra |
30.3 |
33.4 |
8.0 |
26.0 |
Canara Bank |
163.6 |
225.2 |
7.4 |
8.2 |
Corporation Bank |
297.6 |
370.6 |
12.4 |
12.3 |
Dena Bank |
28.9 |
32.9 |
15.0 |
14.3 |
Indian Overseas Bank |
57.0 |
89.9 |
6.4 |
6.7 |
Oriental Bank of Commerce |
276.9 |
260.5 |
8.2 |
10.6 |
Punjab National Bank |
322.9 |
420.4 |
8.8 |
10.3 |
Syndicate Bank |
44.2 |
75.7 |
6.3 |
8.7 |
Union Bank of India |
81.9 |
118.5 |
7.2 |
9.1 |
Vijaya Bank |
55.2 |
60.5 |
7.3 |
18.0 |
State Bank of India |
542.5 |
811.7 |
8.0 |
11.6 |
State Bank of Bikaner |
|
|
|
|
and Jaipur |
2,044.2 |
2,757.4 |
5.7 |
14.4 |
State Bank of Mysore |
1,845.5 |
3,513.3 |
3.5 |
10.6 |
State Bank of Travancore |
1,772.0 |
2,697.7 |
4.1 |
8.0 |
UCO Bank |
24.2 |
28.0 |
7.0 |
9.1 |
Old Private Sector Banks |
|
|
|
|
Bank of Rajasthan Ltd. |
45.5 |
52.1 |
17.3 |
31.2 |
City Union Bank Ltd. |
75.9 |
97.8 |
4.4 |
4.8 |
Dhanalakshmi Bank |
25.4 |
31.8 |
-4.1 |
10.5 |
Federal Bank Ltd. |
122.0 |
175.6 |
11.2 |
7.7 |
ING Vysya Bank |
129.5 |
158.4 |
-36.7 |
143.6 |
IndusInd Bank Ltd. |
48.9 |
61.4 |
7.1 |
36.9 |
Jammu and Kashmir Bank Ltd. |
329.8 |
442.3 |
15.3 |
12.4 |
Karnataka Bank Ltd. |
52.9 |
102.7 |
5.8 |
6.9 |
Karur Vysya Bank Ltd. |
360.6 |
240.4 |
7.0 |
6.5 |
Kotak Mahindra Bank Ltd. |
89.5 |
193.0 |
49.5 |
72.7 |
South Indian Bank Ltd. |
56.9 |
65.7 |
35.1 |
8.5 |
United Western Bank |
34.8 |
37.5 |
-1.4 |
-2.4 |
New Private Sector Banks |
|
|
|
|
Bank of Punjab Ltd.* |
25.5 |
N.A. |
-5.4 |
N.A. |
Centurion Bank of Punjab Ltd. |
11.0 |
19.1 |
60.3 |
42.6 |
HDFC Bank Ltd. |
437.4 |
658.5 |
25.3 |
27.8 |
ICICI Bank Ltd. |
309.7 |
506.3 |
14.4 |
20.6 |
UTI Bank Ltd. |
160.3 |
273.1 |
19.8 |
20.5 |
Yes Bank |
N.A. |
72.1 |
N.A. |
49.0 |
N.A. : Not Applicable.
* : Bank of Punjab Ltd. was merged with Centurion Bank Ltd. From October 1, 2005.
Note : Averages are calculated using daily closing prices.
Source: Money Line Telerate and Prowess Database, CMIE. |
Table III.45: Relative Share of Bank Stocks ñ |
Turnover and Market Capitalisation |
(Per cent) |
Year |
Share of turnover of |
Share of capitalisation |
|
bank stocks in total |
of bank stocks in |
|
turnover |
Total market capitalisation* |
1 |
2 |
3 |
2004-05 |
10.8 |
8.6 |
2005-06 |
6.8 |
7.1 |
2006-07 |
|
|
(April-September) |
4.7 |
7.6 |
* : As at end of the period.
Note : Data for turnover and market capitalisation of banks relate to CNX Bank Index of NSE. |
7. Technological Developments in Banks
3.98 Technology has played a significant role in improving the efficiency of the financial system in recent years. It is also being viewed as an excellent tool for providing a fairly exhaustive range of products and extending banking facilities to the vast multitude of population. Indian
Table III.46: Private Shareholding in |
Public Sector Banks* |
(As on March 31, 2006) |
Category |
Number of Banks |
1 |
2 |
Up to 10 per cent |
4 |
More than 10 and up to 20 per cent |
ñ |
More than 20 and up to 30 per cent |
3 |
More than 30 and up to 40 per cent |
3 |
More than 40 and up to 49 per cent |
11 |
ñ : Nil/negligible
* : Including 19 nationalised banks, State Bank of India and
IDBI Ltd. |
Table III.47: Foreign Financial Institutions |
(Non-resident) Shareholding in Indian Banks |
(As on March 31, 2006) |
Category |
Number of Banks |
|
Public |
New |
Old |
|
Sector |
Private |
Private |
|
Banks |
Sector |
Sector |
|
|
Banks |
Banks |
1 |
2 |
3 |
4 |
Nil |
14 |
3 |
11 |
Up to 10 per cent |
2 |
ñ |
4 |
More than 10 and up to 20 per cent |
10 |
2 |
1 |
More than 20 and up to 30 per cent |
2 |
1 |
1 |
More than 30 and up to 40 per cent |
ñ |
ñ |
ñ |
More than 40 and up to 50 per cent |
ñ |
1 |
1 |
More than 50 and up to 60 per cent |
ñ |
ñ |
ñ |
More than 60 and up to 70 per cent |
ñ |
ñ |
ñ |
More than 70 and up to 80 per cent |
ñ |
1 |
ñ |
banking sector has made a quantum leap forward in terms of switching over from paper-based transactions, which include use of currency notes, cheques or challans, to electronic means, which include Real Time Gross Settlement (RTGS), National Electronic Fund Transfer (NEFT) and other electronic modes. Computerisation of banking business received high importance in 2005-06. For this purpose, banks invested heavily in technology. Between September 1999 and March 2006, public sector banks incurred an expenditure of Rs.10,676 crore on computerisation and development of communication networks (Appendix Table III.32).
3.99 The number of branches providing ëcore banking solutionsí (CBS) has increased significantly in recent years. The CBS provides a host of benefits such as ëanywhere bankingí, ëanywhere accessí and quick funds movement at optimal costs and in an efficient manner. While new private sector banks, foreign banks and a few old private sector banks have already put in place core banking solutions, public sector banks are increasingly adopting similar systems. The total number of branches providing CBS increased from 11.0 per cent as on March 31, 2005 to 28.9 per cent as on March 31, 2006 (Table III.48 and Appendix Table III.33). Many of the PSBs having fully computerised branches adopted CBS during the year.
Table III.48: Computerisation in |
Public Sector Banks |
(As on March 31, 2006) |
(Per cent) |
|
1 |
2 |
i) |
Branches already Fully Computerised # |
48.5 |
ii) |
Branches Under Core Banking Solutions |
28.9 |
iii) |
Fully Computerised Branches (i+ii) |
77.5 |
iv) |
Partially Computerised Branches |
18.2 |
# : Other than branches under Core Banking Solutions. |
3.100 More than 95 per cent branches of public sector banks at end-March 2006 were fully or partially computerised. Out of 27 public sector banks, branches of as many as ten public sector banks were 100 per cent computerised, while branches of another 12 banks were more than 50 per cent computerised (Table III.49). Branches of only five PSBs were less than 50 per cent computerised.
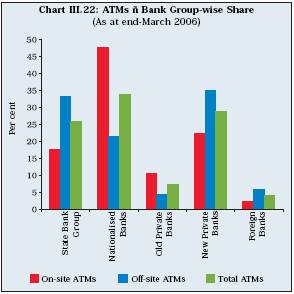
3.101 Total number of ATMs installed by the banks were 21,147 at end-March 2006. Nationalised banks accounted for the largest share of installed ATMs, followed by the new private sector banks, SBI group, old private sector banks and foreign banks (Table III.50). While SBI group, new private sector banks and foreign banks had more off-site ATMs, nationalised and old private sector banks had more on-site ATMs (Chart III.22).
3.102 Off-site ATMs as percentage to total ATMs were the highest in case of foreign banks, followed by SBI group, new private sector banks, nationalised banks and old private sector banks (Appendix Table III.34).
Table III.49: Computerisation of Branches ñ |
Public Sector Banks |
(As on March 31, 2006) |
Extent of Computerisation Number of Banks |
1 |
2 |
Nil |
ñ |
Up to 10 per cent |
1 |
More than 10 and up to 20 per cent |
ñ |
More than 20 and up to 30 per cent |
2 |
More than 30 and up to 40 per cent |
2 |
More than 40 and up to 50 per cent |
ñ |
More than 50 and up to 60 per cent |
3 |
More than 60 and up to 70 per cent |
2 |
More than 70 and up to 80 per cent |
2 |
More than 80 and up to 90 per cent |
ñ |
More than 90 and less than 100 per cent |
5 |
Fully Computerised |
10 |
Total* |
27 |
* : Excludes IDBI Ltd. |
3.103 Convenience and easy acceptability of credit cards and technological advances have resulted in a continuous rise in retail electronic and card-based mode of payments. The volume and value of card and electronic based payments more than doubled in 2006 from the previous year (Table III.51).
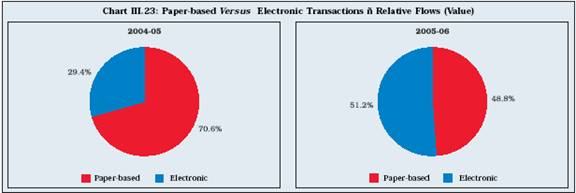
3.104 Reflecting the increasing use of electronic and card-based payments in retail transactions, their share in total transactions constituted 46.7 per cent in terms of volume and 51.2 per cent in terms of value in 2006. The use of electronic mode of payment increased both in terms of volume and value during 2005-06 compared with the previous year (Table III.52, Chart III.23).
Table III.50: Branches and ATMs of Scheduled Commercial Banks |
(As at end-March 2006) |
Bank Group |
Number of Branches |
Number of ATMs |
Per cent |
|
Rural |
Semi-urban |
Urban |
Metro-
politan |
Total |
On-site |
Off-site |
Total |
of Off-site to
total ATMs |
1 |
|
2 |
3 |
4 |
5 |
6 |
7 |
8 |
9 |
10 |
i) |
Nationalised Banks |
12,992 |
7,120 |
7,056 |
7,017 |
34,185 |
4,812 |
2,353 |
7,165 |
32.8 |
ii) |
State Bank Group |
5,229 |
4,043 |
2,449 |
2,110 |
13,831 |
1,775 |
3,668 |
5,443 |
67.4 |
iii) |
Old Private Sector Banks |
936 |
1,447 |
1,236 |
947 |
4,566 |
1,054 |
493 |
1,547 |
31.9 |
iv) |
New Private Sector Banks |
97 |
322 |
674 |
857 |
1,950 |
2,255 |
3,857 |
6,112 |
63.1 |
v) |
Foreign Banks |
ñ |
1 |
37 |
221 |
259 |
232 |
648 |
880 |
73.6 |
Total (i to v) |
19,254 |
12,933 |
11,452 |
11,152 |
54,791 |
10,128 |
11,019 |
21,147 |
52.1 |
Table III.51: Retail Electronic and Card-based Payments |
(Volume in thousand; Value in Rs. crores) |
Year |
Retail Electronic@ |
Card-based # |
Total |
|
Volume |
Value |
Volume |
Value |
Volume |
Value |
1 |
2 |
3 |
4 |
5 |
6 |
7 |
2001-02 |
178 |
6,123 |
N.A. |
N.A. |
178 |
6,123 |
2002-03 |
237 |
10,222 |
N.A. |
N.A. |
237 |
10,222 |
2003-04 |
290 |
29,606 |
1862 |
35,889 |
2,152 |
65,496 |
2004-05 |
579 |
77,702 |
3615 |
77,267 |
4,194 |
1,54,969 |
2005-06 |
832 |
1,06,599 |
10453 |
2,36,994 |
11,286 |
3,43,593 |
N.A. : Not Available. @ : ECS (Debit and Credit ), EFT and SEFT/NEFT.
# : Credit cards, debit cards and smart cards.
Note: Volume represents number of transactions. |
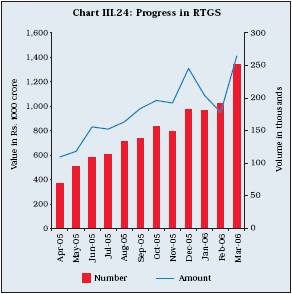
3.105 The RTGS was operationalised on March 26, 2004. Its usage for transfer of funds, especially for large values and for systemically important purposes, has increased since then. The inter-bank paper-based clearing was discontinued at all the RBI centres from June 2005. All inter-bank transactions are now settled through RTGS. Apart from inter-bank funds transfer, the RTGS system facilitates customer transactions. As at end-March 2005, the number of RTGS branches reached about 23,000. The volume crossed 200,000 transactions a month by March 2006 (Chart III.24).
Table III.52: Paper-based versus ElectronicTransactions |
Year |
Paper-based |
Electronic |
Total |
1 |
2 |
3 |
4 |
Volume (in lakhs) |
2002-03 |
10,139 |
1,730 |
11,869 |
2003-04 |
10,228 |
2,152 |
12,380 |
2004-05 |
11,671 |
4,200 |
15,871 |
2005-06 |
12,895 |
11,300 |
24,195 |
|
|
Value (Rs. crore) |
|
2002-03 |
1,34,24,313 |
37,536 |
1,34,61,849 |
2003-04 |
1,15,95,960 |
67,461 |
1,16,63,421 |
2004-05 |
1,01,20,716 |
42,21,153 |
1,43,41,869 |
2005-06 |
1,13,37,062 |
1,18,84,429 |
2,32,21,491 |
8. Regional Spread of Banking
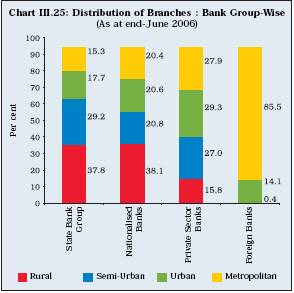
3.106 The total number of branches of SCBs at end-June 2006 increased to 69,417 (from 68,549 at end-June 2005), comprising 30,776 rural branches, 15,370 semi-urban branches and 23,271 urban and metropolitan branches. The share of rural branches declined further to 44.3 per cent during 2005-06 from 44.9 per cent in the previous year, while those of metropolitan branches increased marginally from 16.0 per cent to 16.2 per cent. The share of semi-urban and urban branches during the year remained almost unchanged at around 22.0 per cent and 17.0 per cent, respectively. The decline in the share of rural branches was on account of a large number of new branches opened in the urban and metropolitan centres (Chart III.25 and Appendix Table III.35). 3.107 The top hundred centres arranged according to the size of deposits accounted for 67.0 per cent of total deposits, and the top hundred centres arranged according to the size of bank credit accounted for 76.5 per cent of total bank credit at end-March 2006 (Table III.53). The share of top hundred centres in total deposits and total bank credit increased from their respective levels at end-March 2005.
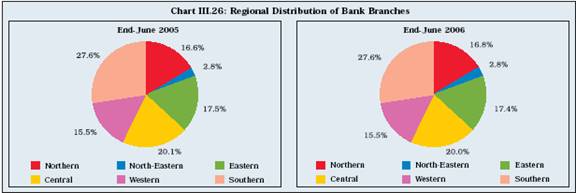
3.108 The Southern region continued to account for the highest percentage of existing bank branches, followed by the Central, the Eastern, the Northern and the Western regions. The share of North-Eastern region remained low at 2.8 per cent at end-March 2006. During 2005-06, most of the new branches were opened in the Northern (286) and Southern (252) regions. The average population served by a single bank branch in various regions remained more or less at the previous yearís level (Chart III.26 and Appendix Table III.36).
Table III.53: Share of Top Hundred Centres in |
Aggregate Deposits and Gross Bank Credit |
(Per cent) |
As at |
Deposits |
Credit |
end-March |
Offices |
Amount |
Offices |
Amount |
1 |
2 |
3 |
4 |
5 |
1999 |
21.5 |
59.1 |
21.1 |
73.5 |
2000 |
21.9 |
59.0 |
21.5 |
74.7 |
2001 |
22.3 |
58.9 |
21.9 |
75.3 |
2002 |
22.5 |
59.1 |
22.1 |
77.0 |
2003 |
22.7 |
61.0 |
22.4 |
75.9 |
2004 |
23.1 |
63.6 |
22.9 |
75.5 |
2005 |
23.8 |
65.3 |
23.7 |
75.9 |
2006 |
24.2 |
67.0 |
24.0 |
76.5 |
Source : Basic Statistical Return-7. |
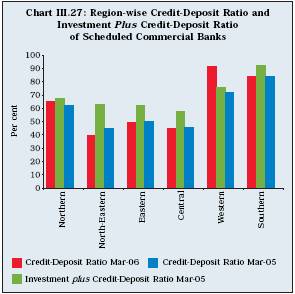
3.109 The all-India C-D ratio (as per sanctions) increased sharply to 72.5 per cent at end-March 2006 from 66.0 per cent at end-March 2005. The credit-deposit ratio as well as investment plus credit-deposit ratio of Western and Southern regions remained higher than the all-India level (Chart III.27). While credit-deposit (C-D) ratio in most of the States increased in line with the all-India trend, C-D ratio of some of the States, viz., Chandigarh, Daman and Diu, Goa, Jammu and Kashmir, Meghalaya and Nagaland witnessed a moderate to sharp decline (Appendix Table III.37). The credit-deposit ratio in six States/ Union Territories, including Andhra Pradesh, Chandigarh, Karnataka, Maharashtra, Rajasthan and Tamil Nadu was higher than the all-India level.
Foreign Banksí Operations in India
3.110 The total number of foreign banks operating in India was 29 as on September 30, 2006. These banks originated from 19 countries. The 258 branches of foreign banks were spread over 40 centres across 19 States/Union territories. While four banks had 10 or more branches at end-March 2006, nine banks were operating only with one branch each. During July 2005 and June 2006, the existing foreign banks in India were granted approval to open 13 additional branches. 3.111 ING Bank N.V. stopped its banking activities in India from October 28, 2005. The Bank of Tokyo-Mitsubishi Ltd. merged its banking business operations globally with UFJ Bank Ltd., with effect from January 1, 2006, and the new merged entity is known as ëThe Bank of Tokyo-Mitsubishi UFJ Ltd.í Accordingly, the notifications under Section 42(6) (b) and (c) of the Reserve Bank of India Act, 1934, directing the exclusion of UFJ Bank Ltd. from the Second Schedule and indicating the change in name of the new entity were issued. Approval was also granted to Chohung Bank for change in its name to ëShinhan Bankí under Section 42(6) (c) of the Reserve Bank of India Act, 1934 and the relative notification was issued on July 25, 2006.
3.112 While seven foreign banks, viz., Commonwealth Bank of Australia, Banche Popolari Unite S.c.r.l., Vneshtorgbank, Promsvyazbank, Banca popolare di Vicenza, Monte Dei Paschi Di Siena and Zurcher Kontanalbank set up representative offices in India, three representative offices, viz., Baden Wruttembergische Bank A.G., Union Bank of California and Mizuho Corporate Bank Ltd. Closed their operations in India. The Baden Wruttembergische Bank A.G. and Union Bank of California amalgamated with Landesbank Baden-Wurthemberg A.G and Wachovia Bank, respectively. As on September 15, 2006, 31 banks from 14 countries had representative offices in India. Thus, on the whole, 60 foreign banks have presence in India either through branches or representative offices (Table III.54).
Indian Banksí Operations Abroad
3.113 As on September 30, 2006, eighteen Indian banks had overseas operations spread over 47 countries with a network of 112 branches (including offshore units), 6 joint ventures, 18 subsidiaries and 35 representative offices (Table III.55). Bank of Baroda had highest overseas presence with 39 branches, 7 subsidiaries, one joint venture bank and 3 representative offices in 20 countries, followed by State Bank of India with 30 branches, five subsidiaries, three joint venture banks and seven representative offices in 29 countries and Bank of India with 20 branches, one subsidiary, two joint venture banks and three representative offices in 14 countries.
Table III.54: List of Foreign Banks Operating in |
India ñ Country-wise |
(As at end-September, 2006) |
Sr. |
Name of |
Country of |
No. of |
No. |
Bank |
Incorporation |
branches in India |
1 |
2 |
3 |
4 |
1 |
ABN-AMRO Bank N.V. |
Netherlands |
24 |
2 |
Abu Dhabi Commercial Bank Ltd. |
UAE |
2 |
3 |
Arab Bangladesh Bank Ltd. |
Bangladesh |
1 |
4 |
American Express Bank Ltd. |
USA |
7 |
5 |
Antwerp Diamond Bank N.V. |
Belgium |
1 |
6 |
Bank International Indonesia |
Indonesia |
1 |
7 |
Bank of America |
USA |
5 |
8 |
Bank of Bahrain & Kuwait BSC |
Bahrain |
2 |
9 |
Bank of Nova Scotia |
Canada |
5 |
10 |
Bank of Tokyo-Mitsubishi UFJ Ltd. |
Japan |
3 |
11 |
BNP Paribas |
France |
8 |
12 |
Bank of Ceylon |
Sri Lanka |
1 |
13 |
Barclays Bank Plc |
UK |
1 |
14 |
Calyon Bank |
France |
5 |
15 |
Citi Bank N.A. |
USA |
39 |
16 |
Shinhan Bank |
South Korea |
1 |
17 |
Chinatrust Commercial Bank |
Taiwan |
1 |
18 |
Deutsche Bank |
Germany |
8 |
19 |
DBS Bank Ltd. |
Singapore |
2 |
20 |
HSBC Ltd. |
Hongkong |
45 |
21 |
JP Morgan Chase Bank N.A. |
USA |
1 |
22 |
Krung Thai Bank Public Co. Ltd. |
Thailand |
1 |
23 |
Mizuho Corporate Bank Ltd. |
Japan |
2 |
24 |
Mashreq Bank PSC |
UAE |
2 |
25 |
Oman International Bank SAOG |
Sultanate of |
|
|
|
Oman |
2 |
26 |
Standard Chartered Bank |
UK |
81 |
27 |
Sonali Bank |
Bangladesh |
2 |
28 |
Societe Generale |
France |
2 |
29 |
State Bank of Mauritius |
Mauritius |
3 |
|
Total |
|
258 |
Table III.55: Overseas Operations of Indian Banks |
(As on September 30, 2006) |
(Actually operational) |
Name of the Bank |
Branch |
Subsi- |
Repre- |
Joint |
Total |
|
|
diary |
sentative |
Venture |
|
|
|
|
Office |
Bank |
|
1 |
2 |
3 |
4 |
5 |
6 |
Punjab National Bank |
1 |
ñ |
4 |
1 |
6 |
State Bank of India |
30 |
5 |
7 |
3 |
45 |
Bank of India |
20 |
1 |
4 |
1 |
26 |
Bank of Baroda |
40 |
7 |
3 |
1 |
51 |
Indian Bank |
3 |
ñ |
ñ |
ñ |
3 |
Indian Overseas Bank |
5 |
1 |
2 |
ñ |
8 |
UCO Bank |
4 |
ñ |
1 |
ñ |
5 |
Canara Bank |
1 |
1 |
1 |
ñ |
3 |
Syndicate Bank |
1 |
ñ |
ñ |
ñ |
1 |
Bharat Overseas Bank |
1 |
ñ |
ñ |
ñ |
1 |
ICICI Bank Ltd. |
5 |
3 |
7 |
ñ |
14 |
IndusInd Bank Ltd. |
ñ |
ñ |
2 |
ñ |
2 |
Centurian Bank of |
|
|
|
|
|
Punjab Ltd. ñ |
ñ |
1 |
ñ |
1 |
|
HDFC Bank Ltd. |
ñ |
ñ |
1 |
ñ |
1 |
UTI Bank Ltd. |
1 |
|
|
|
1 |
Andhra Bank |
|
|
1 |
|
1 |
Allahabad Bank |
|
|
1 |
|
1 |
Total |
112 |
18 |
35 |
6 |
171 |
ñ : Nil. |
|
|
|
|
|
3.114 Offshore Banking Units (OBUs) of banks set up in Special Economic Zones (SEZs) operate like foreign branches of the Indian banks, but located in India. These OBUs are exempt from CRR and SLR requirements. They provide finance to SEZ units and SEZ developers at international rates. As such, under the scheme for Offshore Banking Units, 14 approvals were issued to 10 banks for opening of such units. Initially, six banks viz., State Bank of India, Bank of Baroda, Union Bank of India, Oriental Bank of Commerce, Punjab National Bank (PNB) and ICICI Bank were given ëin principleí approval to open nine OBUs in SEZs: six in SEEPZ, Mumbai and one each in Kandla, Surat and Cochin. Subsequently in the second phase, five banks (viz. PNB, Canara Bank, Bank of India, HDFC Bank and Vijaya Bank) were given permission to open five OBUs: two in Noida, UP and three in SEEPZ, Mumbai. Vijaya Bank, which was permitted to open an OBU in SEEPZ, Mumbai in 2003, did not renew its licence.
Currently, six banks, viz. State Bank of India, Bank of Baroda, Union Bank of India, Punjab National Bank, ICICI Bank Ltd. and Canara Bank have opened seven OBUs (up to September 2006). Of the seven functioning OBUs, five are located in SEEPZ, Mumbai and one each in SEEPZ, Noida (Canara Bank) and Kochi, Kerala (SBI).
9. Customer Service and Financial Inclusion
3.115 The Reserve Bank has been taking measures, on an ongoing basis, for protection of customersí rights, enhancing the quality of customer service and strengthening the grievance redressal mechanism in banks. To address the issue of banking services to the common man in particular, the Reserve Bank appointed the Committee for Procedures and Performance Audit of Public Services (CPPAPS) (Chairman: Shri S.S. Tarapore), and constituted a separate Customer Service Department (CSD).
3.116 The Reserve Bank has been making concerted efforts to promote financial inclusion since 2004. In November 2005, banks were specifically advised to make available a basic banking ëno-frillsí account with low or nil balances as well as charges, to expand the outreach of such accounts to vast sections of the population. Several banks have since introduced such ëno-frillsí accounts with and without value-added features.† According to the information available with the Reserve Bank, about five lakh ëno-frillsí accounts were opened till March 31, 2006, of which about two-third were with public sector banks and one-third with private sector banks.
3.117 Complaints received against commercial banks located in the jurisdiction of various Regional Offices of the Reserve Bank for the period July 1, 2005 to June 30, 2006 have been collated and categorised into seven broad heads, viz., deposit accounts, remittance/collection facility, loans/advances (general and housing loan), credit cards, activities of direct selling agents (DSAs), harassment in recovery of loans, and general/others. Although number of complaints received against public sector banks, in absolute terms, were the largest, average complaints per branch for public sector banks was much lower ranging from 0.02 to 0.49, as against 0.01 to 1.39 for private sector banks and 0.11 to 8.59 in the case of foreign banks. Most of the complaints were in the category of credit cards (17.20 per cent), followed by deposit accounts (16.39 per cent). Complaints in respect of credit cards were largely against foreign banks and new private sector banks (Appendix Table III.38).
10. Regional Rural Banks
3.118 Regional rural banks (RRBs) have a special place in the multi-agency approach adopted to provide agricultural and rural credit in India, particularly for providing loans to the target groups, including the priority sector. In order to provide a thrust to agricultural lending, the Government of India announced a policy in 2004 to double the flow of credit by banks to the agriculture in three years. With a view to providing guidance to RRBs and monitoring credit flow to agriculture, the Reserve Bank constituted Empowered Committees at all its Regional Offices. In order to make RRBs an important vehicle of credit delivery in rural areas, the Reserve Bank announced, in December 2005, a special package with the following salient features. First, sponsor banks were advised to provide lines of credit to RRBs at reasonable rates of interest to enhance their resource base. Further, RRBs were given access to inter-RRB term money/borrowings and also to the repo/CBLO markets. Second, RRBs were permitted to set up off-site ATMs, issue debit/ credit cards and also to handle pension/ Government business as sub-agents of banks authorised to conduct Government business. Third, the Reserve Bank indicated that taking into account their financial position, requests from RRBs could be considered for opening of currency chests. Fourth, the Reserve Bank is reviewing the existing norms for conduct of various types of foreign exchange transactions by RRBs with a view to allowing them to undertake non-trade related current account transactions relating to release of foreign exchange for certain specified purposes such as overseas education, business travel, medical treatment and private visits. The role of RRBs and their financial performance have been evolving in response to policy initiatives as well as changing business environment (Box III.5). 3.119 In order to reposition RRBs as an effective instrument of credit delivery in the Indian financial system, the Government of India - after consultation with NABARD, the concerned State Government/s and the sponsor bank/s-initiated State-level amalgamation of RRBs, sponsor bank-wise in September 2005 (Box III.6).
Box III.5: Emerging Role of RRBs
Regional Rural Banks (RRBs) were set up under the Regional Rural Banks Act, 1976. RRBs were expected to operate as State sponsored, region based and rural oriented commercial banks. The basic objective of this set of rural financial institutions was to have a feel and familiarity with local need, and professionally managed alternative channel for credit dispensation to small and marginal farmers, agricultural labourers, socio-economically weaker sections of population for development of agriculture, trade, commerce, industry and other productive activities. RRBs were expected to mobilise resources from rural areas and play a significant role in developing agriculture and rural economy by deploying mobilised resources in rural sectors for the needy not covered by SCBs despite their large network. Keeping this objective in view, the capital of RRBs is held by the Central Government, concerned State Government and sponsor bank in the proportion of 50:15:35.
During the first decade of their operations, RRBs concentrated on expanding credit services, which were reflected in the credit-deposit ratio of more than 100 per cent up to 1987. Thereafter, the C-D ratio declined, reflecting a reorientation in their activities. However, the credit-deposit ratio improved to 55.7 per cent in 2005-06 from 41.3 per cent in 2000-01. This resulted in an increase in the share of income from advances from 34.7 per cent in 2000-01 to 53.8 per cent in 2005-06 (Table 1). The share of income from investment, in contrast, declined to 39.5 per cent in 2005-06 from 60.5 per cent in 2000-01.
In the wake of introduction of financial sector reforms in 1991-92, the commercial viability of RRBs emerged as the most crucial factor in deciding about their desired role in the emerging economic scenario. The financial health of RRBs turned weak mainly due to its limited business flexibility with hardly any scope of expansion/diversification, smaller size of loans with higher exposure to risk-prone advances and professional inefficiency in financial deployment. To strengthen RRBs and improve their performance, the Reserve Bank
Table 1: Investment and Advances of RRBs |
(Rs. crore) |
Item |
2000-01 |
2004-05 |
2005-06 |
1 |
2 |
3 |
4 |
1. Share of Income |
|
|
|
from |
|
|
|
(i) Advances |
34.8 |
49.7 |
53.8 |
(ii) Investment |
60.5 |
42.9 |
39.5 |
2. ID Ratio* |
72.2 |
59.2 |
57.6 |
3. CD Ratio |
41.3 |
52.9 |
55.7 |
* : ID (Investment-Deposit) Ratio = Investments including other bank balances and
other investments to total deposits.
Source : NABARD. |
allowed RRBs to lend to non-target groups, deregulated their deposit and lending rates, and permitted investment of their surplus funds in profitable avenues. These measures were supported with well-defined business plan preparation from the branches, time bound implementation for attaining profitability, human resource development programmes, and organisational development initiatives as an integrated tool for turnaround.
The RRBs, which incurred losses of Rs.426 crore in 1995-96, started posting profits after various reform measures were introduced. Net profits increased to Rs.769 crore during 2003-04. Although net profits declined thereafter to Rs.510 crore during 2005-06, mainly because of reduction in net margin and also payment of arrears, the overall health of RRBs has improved significantly over the years. The productivity of RRBs, both in terms of per branch and per employee, increased significantly during last 10 years. An improvement in the performance of RRBs from 2000-01 onwards is particularly significant (Table 2).
Table 2: Business and Financial Indicators of RRBs** |
Indicator† |
2000-01 |
2001-02 |
2002-03 |
2003-04 |
2004-05 |
2005-06 |
1 |
2 |
3 |
4 |
5 |
6 |
7 |
No. of RRBs |
196 |
196 |
196 |
196 |
196 |
133* |
Net Profit (Rs.crore) |
600.6 |
607.9 |
519.3 |
768.7 |
748.2 |
510.3 |
Per Branch Productivity1 (Rs.crore) |
3.8 |
4.4 |
5.0 |
5.7 |
6.6 |
7.7 |
Per Employee productivity2 (Rs.crore) |
0.8 |
0.9 |
1.0 |
1.2 |
1.4 |
1.6 |
Accumulated Loss as percentage to Assets |
5.6 |
4.7 |
4.4 |
3.9 |
3.5 |
2.9 |
Salary as percentage to Assets |
2.0 |
2.2 |
2.3 |
2.6 |
2.0 |
1.8 |
Financial Return3 (per cent) |
9.4 |
10.6 |
9.6 |
8.9 |
8.2 |
6.6 |
Financial Cost4 (per cent) |
6.0 |
6.8 |
6.1 |
5.4 |
4.6 |
3.5 |
Financial margin5 (per cent) |
3.4 |
3.8 |
3.5 |
3.5 |
3.6 |
3.1 |
Risk, operational and other cost (per cent) |
2.1 |
2.6 |
2.6 |
2.2 |
2.3 |
2.9 |
Net Margin6 (per cent) |
1.2 |
1.2 |
0.9 |
1.3 |
1.3 |
0.7 |
* : Reduction in number of RRBs was due to amalgamation, which began in September 2005.
Note :
1 Average level of business (in terms of total deposits and gross advances) per branch during the reporting year.
2 Average level of business (in terms of total deposits and gross advances) per employee of RRBs during the year.
3 Percentage of total income from both advances and investments against average working funds during the year.
4 Percentage of total interest expended for deposits, borrowings etc. against average working funds during the year.
5 Difference between the financial return and financial cost.
6 Difference between the financial margin and risk, operational and other costs, plus miscellaneous income.
Source : NABARD. |
Box III.6: Amalgamation of RRBs
The Advisory Committee on Flow of Credit to Agriculture and Related Activities (Chairman: Shri V.S. Vyas) in June 2004 recommended restructuring of RRBs. Following this, an Internal Working Group on RRBs was set up in the Reserve Bank to examine various alternatives available within the existing legal framework for strengthening RRBs. The Group, in its Report submitted in June 2005, observed large variations in the number of districts covered and the branch network of RRBs. While 47 RRBs covered only one district each, 111 RRBs covered 2-3 districts, 29 RRBs 4-5 districts and 9 operated in 6-9 districts. Similarly, 72 RRBs had up to 50 branches, 87 RRBs 51-100 branches, 21 RRBs 101-150 branches and 16 had more than 150 branches. As many as 6 sponsor banks had only one RRB sponsored by them. While 11 sponsor banks had 2 - 4 sponsored RRBs, 3 sponsor banks had up to 10 RRBs and 8 sponsor banks had more than 10 RRBs sponsored by them in various States. Of these, only 2 sponsor banks had more than 20 RRBs. In order to improve the operational viability of RRBs and take advantage of the economies of scale (by reducing transaction cost), the route of merger/amalgamation of RRBs was suggested taking into account the views of various stakeholders. The merged entities would have a larger area of operation and the merger process would help in strengthening some of the weak RRBs. A two-phase restructuring was suggested: (i) merger between RRBs of the same sponsor bank in the same State; and (ii) merger of RRBs sponsored by different banks in the same State. Merger of RRBs with the sponsor bank is not provided for in the RRBs Act 1976. Further, such mergers would go against the spirit of setting up of RRBs as local entities and for providing credit primarily to weaker sections.
The Government of India has initiated the first phase of amalgamation of RRBs sponsor bank-wise at State level to overcome the deficiencies prevailing in RRBs and making them viable and profitable units. The process of amalgamation of RRBs sponsor bank-wise at the State level started on September 12, 2005 with the issue of notification in respect of formation of 9 amalgamated entities. As on March 31, 2005, 196 RRBs were operating in 26 States across 523 districts (525 in 2005-06) with a network of 14,484 branches (14,489 in 2005-06). RRBs had a large branch network in the rural areas, which constituted nearly 45 per cent of rural branch network of all commercial banks. Till October 31, 2006, 137 RRBs were amalgamated to form 43 new RRBs, sponsored by 18 commercial banks in 15 States, bringing down the total number of RRBs in the country to 102 from 196. The amalgamation process of phase I is in process of being completed. Revised guidelines regarding organisational set-up, appointment of Chairmen and fixation of seniority of staff were issued by NABARD to sponsor banks for implementation in their respective RRBs in the post-amalgamation period. NABARD is providing full guidance and support to smoothen the process of amalgamation.
After amalgamation, RRBs would become bigger in size with a larger area of operation, which would enable them to function in a competitive environment more effectively by taking advantage of the economies of scale and reduction in transaction cost. The process of bringing down the number of RRBs would also make it more convenient for the sponsor banks to manage the affairs of RRBs.
Financial Performance of RRBs
3.120 The consolidated balance sheet of RRBs expanded by 15.1 per cent during 2005-06, notwithstanding the decline in the number of RRBs to 133 at end-March 2006 (due to amalgamation) as compared with 196 at end-March 2005 (Table III.56). On the asset side, net advances of RRBs increased by 21.1 per cent during 2005-06. Among the major items on the liabilities side, borrowings increased by 32.2 per cent and total deposits by 14.8 per cent during the year.
Table III.56: Regional Rural Banks: Consolidated Balance Sheet |
(Amount in Rs. crore) |
Item |
March 31, |
March 31, |
Percentage |
Item |
March
31, |
March 31, |
Percentage |
|
2005 |
2006 (P) |
Variation |
|
2005 |
2006 (P) |
Variation |
1 |
2 |
3 |
4 |
5 |
6 |
7 |
8 |
Liabilities |
77,867 |
89,645 |
15.1 |
Assets |
77,867 |
89,645 |
15.1 |
Share Capital |
196 |
196 |
ñ |
†† |
|
|
|
Reserves |
3,819 |
4,271 |
11.8 |
Cash in Hand |
966 |
1,033 |
6.9 |
Share Capital Deposits |
2,167 |
2,180 |
0.6 |
Balances with RBI |
3,026 |
3519 |
16.3 |
Deposits |
62,143 |
71,329 |
14.8 |
Other Bank Balances |
12,230 |
16,258 |
32.9 |
Currency |
3,257 |
3,953 |
21.4 |
|
|
|
|
|
|
|
|
Other Investments |
24,532 |
24,925 |
1.6 |
Savings |
30,740 |
38,233 |
24.4 |
|
|
|
|
Term |
28,146 |
29,143 |
3.5 |
Loans and Advances (net) |
31,803 |
38,520 |
21.1 |
Borrowings from |
5,524 |
7,303 |
32.2 |
Fixed Assets |
154 |
178 |
15.6 |
NABARD |
5,067 |
6,291 |
24.2 |
Other Assets# |
5,155 |
5,214 |
1.1 |
Sponsor Bank |
450 |
959 |
113.4 |
|
|
|
|
Others |
8 |
53 |
552.1 |
|
|
|
|
Other Liabilities |
4,018 |
4,367 |
8.7 |
|
|
|
|
Memorandum Items: |
† |
† |
† |
|
|
|
|
a. Credit-Deposit Ratio |
51.2 |
55.7 |
|
|
|
|
|
b. Investment-Deposit Ratio |
39.5 |
57.7 |
† |
|
|
|
|
c. (Credit+Investment)-Deposit Ratio |
90.7 |
113.4 |
|
|
|
|
|
ñ : Nil/Negligible. P : Provisional. # : Includes accumulated loss.
Source : NABARD. |
3.121 In view of amalgamation of RRBs, the number of both profit-making and loss-making RRBs declined to 111 and 22, respectively, at end-March 2006 from 166 and 30, respectively, at end-March 2005 (Table III.57). The sharper decline in income as compared with the expenditure resulted in lower net profits of Rs.510 crore for RRBs during 2005-06 as compared with Rs.748 crore during 2004-05. The ratio of gross and net NPAs declined sharply during the year to 7.3 per cent and 4.0 per cent, respectively, enabled by improved recovery to the extent of 80 per cent. 3.122 RRBs issued loans to the extent of Rs.32,871 crore during 2005-06, out of which the share of priority sector was 79.3 per cent. As at end-March 2006, the outstanding advances of RRBs were Rs.39,713 crore, of which the share of priority sector was 81.7 per cent (Table III.58). The share of agricultural loans increased to 54.0 per cent at end-March 2006 from 50.8 per cent at end-March 2005, while the share of non-agricultural loans declined to 46.0 per cent from 49.2 per cent during the period.
Table III.57: Financial Performance of Regional Rural Banks |
(Amount in Rs. crore) |
Items |
2004-05 |
2005-06 |
Variation
Col. (7) |
|
Loss Making |
Profit Making |
RRBs |
Loss Making |
Profit Making |
RRBs |
over |
|
[30] |
[166] |
[196] |
[22] |
[111] |
[133] |
Col. (4) |
1 |
2 |
3 |
4 |
5 |
6 |
7 |
8 |
A. |
Income (i+ii) |
638 |
5,497 |
6,135 |
684 |
4,915 |
5,599 |
-536 |
|
|
|
† |
|
† |
† |
|
† |
(-8.74) |
|
i. |
Interest Income |
597 |
5,078 |
5,675 |
636 |
4,586 |
5,222 |
-453 |
|
|
|
† |
|
† |
† |
|
† |
(-7.98) |
|
ii. |
Other Income |
41 |
419 |
460 |
48 |
329 |
377 |
-83 |
B. |
Expenditure (i+ii+iii) |
792 |
4,595 |
5,387 |
854 |
4,235 |
5,089 |
-298 |
|
† |
|
† |
|
† |
† |
|
† |
(-5.52) |
|
i. |
Interest Expended |
429 |
2,731 |
3,160 |
438 |
2,346 |
2,784 |
-376 |
|
† |
|
† |
|
† |
† |
|
† |
(-11.91) |
|
ii. |
Provisions and Contingencies |
52 |
208 |
260 |
67 |
211 |
278 |
18 |
|
† |
|
† |
|
† |
† |
|
† |
(6.75) |
|
iii. |
Operating expenses |
311 |
1,656 |
1,967 |
350 |
1,678 |
2,028 |
61 |
† |
|
of which: |
† |
|
† |
† |
|
† |
(3.11) |
|
† |
Wage Bill |
249 |
1,277 |
1,526 |
291 |
1,290 |
1,581 |
55 |
C. |
Profit |
† |
|
† |
† |
|
† |
† |
|
i. |
Operating Profit |
-102 |
1,110 |
1,008 |
-104 |
891 |
787 |
-221 |
|
† |
|
† |
|
† |
† |
|
† |
(-21.91) |
|
ii. |
Net Profit |
-154 |
902 |
748 |
-170 |
681 |
510 |
-238 |
|
† |
|
† |
|
† |
† |
|
† |
(-31.87) |
D. |
Total Assets |
9,780 |
68,086 |
77,866 |
11,747 |
77,898 |
88,652 |
10,786 |
|
† |
|
† |
|
† |
† |
|
† |
13.85 |
E. |
Financial Ratios # |
† |
|
† |
† |
|
† |
† |
|
i) |
Operating Profit |
-1.04 |
1.63 |
1.29 |
-0.88 |
1.14 |
0.89 |
† |
|
ii) |
Net Profit |
-1.57 |
1.32 |
0.96 |
-1.45 |
0.87 |
0.57 |
† |
|
iii) |
Income |
6.52 |
8.07 |
7.88 |
5.82 |
6.31 |
6.32 |
† |
|
iv) |
Interest Income |
6.10 |
7.46 |
7.29 |
5.41 |
5.89 |
5.89 |
† |
|
v) |
Other Income |
0.42 |
0.62 |
0.59 |
0.41 |
0.42 |
0.43 |
† |
|
vi) |
Expenditure |
8.10 |
6.75 |
6.92 |
7.27 |
5.44 |
5.74 |
† |
|
vii) |
Interest expended |
4.39 |
4.01 |
4.06 |
3.73 |
3.01 |
3.14 |
† |
|
viii) Operating expenses |
3.18 |
2.43 |
2.53 |
2.98 |
2.15 |
2.29 |
|
|
ix) |
Wage Bill |
2.55 |
1.88 |
1.96 |
2.47 |
1.66 |
1.78 |
† |
|
x) |
Provisions and Contingencies |
0.53 |
0.31 |
0.33 |
0.57 |
0.27 |
0.31 |
† |
|
xi) |
Gross NPAs |
† |
|
8.50 |
† |
|
7.30 |
† |
|
xii) |
Net NPAs |
† |
|
5.15 |
† |
|
3.96 |
† |
# : Ratios to Total Assets. |
|
|
|
|
|
|
|
Note :
1. Figures within [ ] brackets
represent number of RRBs.
2. Figures within brackets in col. 8 represent percentage variation over the year.
3. Data are provisional.
Source : NABARD. |
Table III.58: Outstanding Advances by |
RRBs ñ Purpose-wise |
(As at end-March) |
(Amount in Rs. crore) |
Purpose |
2005 |
2006P |
1 |
2 |
3 |
I. |
Agriculture (i to iii) |
16,710 |
21,394 |
|
|
|
(50.8) |
(54.0) |
|
i. |
Short-term loans (crop loans) |
10,980 |
14,690 |
|
ii. |
Term loans (for agriculture |
|
|
|
|
and allied activities) |
5,730 |
6,704 |
|
iii. |
Indirect Advances |
ñ |
ñ |
II. |
Non-agriculture (iv to vii) |
16,161 |
18,319 |
|
|
|
(49.2) |
(46.0) |
|
iv. |
Rural Artisans, etc. |
713 |
702 |
|
v. |
Other Industries |
580 |
824 |
|
vi. |
Retail Trade, etc. |
4,364 |
3,925 |
|
vii. Other purposes |
10,504 |
12,868 |
|
Total (I+II) |
32,871 |
39,713 |
Memo item: |
|
|
|
a) |
Priority Sector |
26,077 |
32,453 |
|
b) |
Non-priority Sector |
6,794 |
7,259 |
|
|
Share of priority Sector |
|
|
|
|
(per cent) |
79.3 |
81.7 |
P : Provisional. |
|
|
ñ : Nil / Negligible. |
|
|
Note : Figures in brackets are percentages to the total.
Source : NABARD. |
11. Local Area Banks
3.123 Four local area banks (LABs) were functional at end-March 2006. These were: Coastal Local Area Bank Ltd, Vijayawada; Capital Local Area Bank Ltd., Phagwara, Navsari; Krishna Bhima Samruddhi Local Area Bank Ltd., Mehboobnagar; and the Subhadra Local Area Bank Ltd., Kolhapur. Assets, deposits and gross advances of all local area banks increased significantly during 2005-06 (Table III.59). 3.124 The income of LABs registered a sharp rise during 2005-06. The high growth of income was mainly on account of interest income. On the expenditure side, interest expenditure and operating expenditure registered a significant rise during the year. The rise in income was more than the expenditure, resulting in higher net profit of 2.8 per cent as compared with 0.9 per cent in the previous year (Table III.60).
Table III.59: Profile of Local Area Banks |
(Amount in Rs. crore) |
Banks |
Assets |
Deposits |
Gross Advances |
|
2005 |
2006 |
2005 |
2006 |
2005 |
2006 |
1 |
2 |
3 |
4 |
5 |
6 |
7 |
Capital Local |
|
|
|
|
|
|
Area Bank Ltd. |
179 |
252 |
151 |
215 |
90 |
135 |
Coastal Local |
|
|
|
|
|
|
Area Bank Ltd. |
45 |
64 |
36 |
50 |
20 |
30 |
Krishna Bhima Samruddhi |
|
|
|
|
|
Local Area Bank Ltd. |
17 |
29 |
8 |
13 |
12 |
19 |
Subhadra Local |
|
|
|
|
|
|
Area Bank Ltd. |
12 |
19 |
5 |
12 |
8 |
13 |
Source : Based on off-site returns. |
Table III.60: Financial Performance of Local Area Banks |
(Amount in Rs. crore) |
Indicator |
2004-05 |
2005-06 |
Variation |
|
|
|
Absolute |
Percentage |
1 |
2 |
3 |
4 |
5 |
A. |
Income (i+ii) |
21.3 |
30.0 |
8.7 |
41.1 |
|
i) |
Interest income |
17.3 |
25.5 |
8.2 |
47.4 |
|
ii) |
Other income |
4.0 |
4.5 |
0.5 |
13.6 |
B. |
Expenses (i+ii+iii) |
20.4 |
27.2 |
6.8 |
33.6 |
|
i) |
Interest expenses |
8.7 |
12.0 |
3.3 |
38.0 |
|
ii) |
Provisions and contingencies |
2.5 |
2.6 |
0.1 |
5.6 |
|
iii) |
Operating expenses |
9.2 |
12.6 |
3.4 |
37.0 |
|
|
of which : |
† |
|
|
|
|
|
Wage Bill |
3.1 |
4.5 |
1.4 |
44.5 |
C. |
Profit |
† |
|
|
|
|
i) |
Operating Profit/Loss |
3.4 |
5.4 |
2.0 |
59.9 |
|
ii) |
Net Profit/Loss |
0.9 |
2.8 |
1.9 |
210.8 |
D. |
Spread (Net Interest Income) |
8.6 |
13.5 |
†4.9 |
56.9 |
Source :
Off-site returns. |
|