Operations and Performance of Commercial Banks
3.1 avourable macroeconomic conditions continued to underpin the business and financial performance of scheduled commercial banks (SCBs)1 during 2005-06. The operations of SCBs during the year were marked by a large expansion of bank credit for the second year in succession. However, the credit growth was broad-based even as credit expansion in respect of the retail sector, particularly housing, and loans to commercial real estate was more pronounced. On the liability side, deposits grew at a higher rate in comparison with the previous year. However, the expansion of deposits could not keep pace with the high credit growth compelling banks to liquidate some of their holdings of Government securities. Reversing the trend of the previous year, net profits of the SCBs, as a group, increased. To a large extent, this was facilitated by a sharp increase in net interest income due to a strong growth in credit volumes. The asset quality of SCBs improved further during 2005-06 as reflected in the decline in gross non-performing assets in absolute terms for a third year in succession. Banksí capital to risk-weighted assets ratio remained more or less at the previous yearís level, despite application of capital charge for market risk and sharp increase in risk-weighted assets.
3.2 his Chapter profiles the operations and financial performance of scheduled commercial banks at the aggregate and bank group levels. The Chapter is organised into eleven Sections. Section 2 analyses the balance sheets of SCBs on an aggregate basis, while Section 3 delineates their off-balance sheet operations. Financial performance of SCBs is analysed in Section 4. Section 5 profiles the performance of soundness indicators. Operations of SCBs in the capital market are detailed in Section 6. Technological developments in banking during the year are covered in Section 7. Regional spread of banking is set out in Section 8. Section 9 presents an update on customer service and financial inclusion. Apart from the SCBs, there exist 133 regional rural banks (RRBs)2 and four local area banks (LABs). While the performance of SCBs forms the core of this Chapter, the performance of RRBs and LABs are detailed separately in Section 10 and Section 11, respectively.
2. Liabilities and Assets of Scheduled Commercial Banks
3.3 The aggregate balance sheet of SCBs expanded by 18.4 per cent during 2005-06 as compared with 19.3 per cent in 2004-05, including the impact of conversion of a non-banking entity into a banking entity (Table III.1). The number of SCBs declined to 84 at end-March 2006 from 88 at end-March 2005 due to merger of two domestic banks, and one foreign bank, and closure of another foreign bank (Box III.1). The ratio of assets of SCBs to GDP at factor cost at current prices, however, increased significantly to 86.9 per cent at end-March 2006 as compared with 82.8 per cent at end-March 2005, suggesting a faster growth of the banking system in relation to the real economy. The degree of leverage enjoyed by the banking system as reflected in the equity multiplier (measured as total assets divided by total equity), however, remained unchanged at the previous yearís level of 15.7 per cent.
3.4 The behaviour of major balance sheet indicators of SCBs during 2005-06 followed more or less the pattern of the previous year. Underpinned by robust economic growth in general and industrial growth in particular, loans and advances grew by 31.8 per cent during 2005-06 on top of the increase of 33.2 per cent in the previous year. The expansion in loans and advances was funded largely by deposit growth (17.8 per cent in 2005-06 compared with 16.6 per cent in the previous year), significant increase in retained earnings, increased recourse to borrowings and offloading of Government and other approved securities (Table III.2). The growth in credit during 2005-06 outpaced deposits both in percentage and in absolute terms. The year 2005-06 was the second consecutive year, when increase in credit in
Table III.1: Consolidated Balance Sheet of Scheduled Commercial Banks |
(Amount in Rs. crore) |
Item |
As at end-March |
|
2005 |
2006 |
|
Amount |
Per cent to total |
Amount |
Per cent to total |
1 |
2 |
3 |
4 |
5 |
Liabilities |
|
|
|
|
1. |
Capital |
25,904 |
1.1 |
25,203 |
0.9 |
2. |
Reserves and Surplus |
1,23,704 |
5.3 |
1,57,909 |
5.7 |
3. |
Deposits |
18,37,557 |
78.0 |
21,64,477 |
77.6 |
|
3.1. |
Demand Deposits |
2,34,528 |
10.0 |
2,92,932 |
10.5 |
|
3.2. |
Savings Bank Deposits |
4,44,831 |
18.9 |
5,42,830 |
19.5 |
|
3.3. |
Term Deposits |
11,58,197 |
49.2 |
13,28,714 |
47.7 |
4. |
Borrowings |
1,68,086 |
7.1 |
2,05,433 |
7.4 |
5. |
Other Liabilities and Provisions |
2,00,701 |
8.5 |
2,34,866 |
8.4 |
Total Liabilities/Assets |
23,55,955 |
100.0 |
27,87,891 |
100.0 |
Assets |
|
|
|
|
|
1. |
Cash and balances with RBI |
1,18,075 |
5.0 |
1,44,461 |
5.2 |
2. |
Balances with banks and money at call and short notice |
95,356 |
4.0 |
1,16,396 |
4.2 |
3. |
Investments |
8,69,737 |
36.9 |
8,67,790 |
31.1 |
|
3.1 |
Government Securities (a+b) |
6,98,789 |
29.7 |
6,91,946 |
24.8 |
|
|
a. In India |
6,95,426 |
29.5 |
6,87,989 |
24.7 |
|
|
b. Outside India |
3,363 |
0.1 |
3,957 |
0.1 |
|
3.2 |
Other Approved Securities |
16,291 |
0.7 |
13,948 |
0.5 |
|
3.3 |
Non-Approved Securities |
1,54,656 |
6.6 |
1,61,895 |
5.8 |
4. |
Loans and Advances |
11,50,836 |
48.8 |
15,16,557 |
54.4 |
|
4.1 |
Bills purchased and discounted |
91,902 |
3.9 |
1,03,648 |
3.7 |
|
4.2 |
Cash Credits, Overdrafts, etc. |
4,37,018 |
18.5 |
5,68,965 |
20.4 |
|
4.3 |
Term Loans |
6,21,914 |
26.4 |
8,43,942 |
30.3 |
5. |
Fixed Assets |
23,050 |
1.0 |
25,058 |
0.9 |
6. |
Other Assets |
98,898 |
4.2 |
1,17,627 |
4.2 |
Note : Data for 2004-05 are as reported in the balance sheets of banks for 2005-06 and
hence may differ with those reported in the Report on Trend and Progress of Banking in India,
2004-05, as the figures for 2004-05, were revised by some banks.
Source :
Balance sheets of respective banks. |
absolute terms was more than the absolute increase in aggregate deposits. The growth in investments, which had somewhat moderated during 2004-05, turned negative during 2005-06 in view of unwinding of Government securities by public sector banks (PSBs) and old private sector banks to meet the high credit demand [Appendix Table III.1(A) to (C)].
Box III.1: Amalgamations in the Commercial Banking Sector
During 2005-06, two domestic banks and one foreign bank were amalgamated, and one foreign bank was closed reducing the number of scheduled commercial banks from 88 at end-March 2005 to 84 at end-March 2006. On the recommendations of the Reserve Bank, the Central Government placed the Ganesh Bank of Kurundwad Ltd. under a moratorium for a period of 3 months effective January 7, 2006 under Section 45 of the Banking Regulation (B. R.) Act, 1949 because the net worth of the bank had turned negative, and it failed to augment its capital for several years. The scheme of amalgamation of the bank with the Federal Bank Ltd. prepared by the Reserve Bank was sanctioned by the Government on January 24, 2006. However, the proposed amalgamation was challenged by Ganesh Bank of Kurundwad Ltd. and others before the High Court of Bombay. Following the Supreme Court order dated August 28, 2006, dismissing the Petition filed by the bank, the Central Government issued necessary notification on September 1, 2006 to effect the merger from September 2, 2006. The voluntary amalgamation of the Bank of Punjab Ltd. with the Centurion Bank Ltd. was approved by the Reserve Bank in terms of Section 44A of the B. R. Act, and became effective from October 1, 2005. The Centurion Bank subsequently changed its name to Centurion Bank of Punjab Ltd. Among foreign banks, while ING Bank NV closed its business in India, UFJ Bank Ltd. merged its banking business globally with Bank of Tokyo-Mitsubishi Ltd. As a result, ING Bank NV and UFJ Bank Ltd. were excluded from the Second Schedule to the Reserve Bank of India Act, 1934 with effect from October 28, 2005 and January 1, 2006, respectively (details are provided in Section III.8).
Besides two amalgamations of domestic banks in 2005-06, another amalgamation took place in 2006-07 (up to October 31, 2006). The United Western Bank Ltd. (UWB) was placed under moratorium by the Central Government under Subsection (2) of Section 45 of the B. R. Act, 1949, for a period of three months effective September 2, 2006 because the CRAR of UWB had turned negative. During the period of moratorium, the Reserve Bank received expression of interest from 17 entities. Subsequently, the Government notified the Scheme for amalgamation of United Western Bank Ltd. with Industrial Development Bank of India Ltd., which came into effect on October 3, 2006.
Table III.2: Growth of Balance Sheet of Scheduled Commercial Banks ñ Bank Group-wise |
(Per cent) |
Item |
As at end-March |
|
2005 |
2006 |
|
Public |
Old |
New |
Foreign |
All |
Public |
Old |
New |
Foreign |
All |
|
Sector |
Private |
Private |
Banks |
SCBs |
Sector |
Private |
Private |
Banks |
SCBs |
|
Banks |
Sector |
Sector |
|
|
Banks |
Sector |
Sector |
|
|
|
|
Banks |
Banks |
|
|
|
Banks |
Banks |
|
|
1 |
2 |
3 |
4 |
5 |
6 |
7 |
8 |
9 |
10 |
11 |
1. |
Capital |
5.8 |
27.8 |
7.9 |
51.0 |
16.0 |
†-20.6 |
25.6 |
14.2 |
27.5 |
-2.7 |
2. |
Reserves and Surplus |
30.7 |
8.9 |
56.4 |
17.3 |
31.2 |
21.7 |
19.4 |
55.2 |
28.2 |
27.7 |
3. |
Deposits |
17.0 |
10.8 |
21.1 |
7.7 |
16.6 |
†12.9 |
11.4 |
50.7 |
31.7 |
17.8 |
|
3.1. |
Demand Deposits |
15.6 |
19.2 |
10.6 |
19.4 |
15.4 |
20.8 |
15.6 |
29.3 |
48.8 |
24.9 |
|
3.2. |
Savings Bank Deposits |
18.0 |
17.8 |
32.7 |
23.4 |
19.0 |
19.0 |
20.2 |
60.6 |
21.1 |
22.0 |
|
3.3. |
Term Deposits |
16.9 |
8.2 |
21.6 |
-2.1 |
15.9 |
†8.9 |
8.8 |
53.9 |
25.4 |
14.7 |
4. |
Borrowings |
207.0 |
0.9 |
10.4 |
23.7 |
76.2 |
†24.3 |
22.5 |
11.0 |
30.2 |
22.0 |
5. |
Other Liabilities and Provisions |
7.9 |
10.2 |
6.5 |
6.7 |
7.5 |
11.9 |
13.7 |
34.0 |
34.3 |
17.4 |
Total Liabilities/Assets |
20.6 |
10.6 |
19.4 |
12.7 |
19.3 |
†13.6 |
12.2 |
43.2 |
31.2 |
18.4 |
1. |
Cash and balances with RBI |
6.8 |
13.0 |
-7.9 |
-7.1 |
4.3 |
†25.3 |
-0.4 |
16.1 |
20.0 |
22.3 |
2. |
Balances with banks and money |
|
|
|
|
|
|
|
|
|
|
|
at call and short notice |
13.9 |
29.2 |
22.1 |
18.1 |
16.4 |
†14.0 |
7.3 |
37.5 |
64.0 |
22.1 |
3. |
Investments |
9.5 |
-6.0 |
8.1 |
3.1 |
8.1 |
†-7.6 |
0.9 |
41.1 |
25.0 |
-0.2 |
|
3.1 |
Government Securities (a+b) |
11.3 |
-1.4 |
2.3 |
4.3 |
9.4 |
†-8.3 |
3.0 |
50.4 |
23.6 |
-1.0 |
|
|
a. In India |
11.3 |
-1.4 |
2.3 |
4.3 |
9.4 |
†-8.5 |
3.0 |
50.2 |
23.6 |
-1.1 |
|
|
b. Outside India |
16.9 |
-9.3 |
184.3 |
0.0 |
16.9 |
†15.3 |
2.6 |
255.2 |
0.0 |
17.7 |
|
3.2 |
Other Approved Securities |
-11.8 |
-24.4 |
-8.8 |
25.0 |
-11.9 |
†-13.5 |
-14.7 |
-60.9 |
-60.6 |
-14.4 |
|
3.3 |
Non-Approved Securities |
3.9 |
-18.7 |
20.9 |
-1.9 |
5.0 |
†-3.0 |
-5.7 |
24.1 |
32.8 |
4.7 |
4. |
Loans and Advances |
34.9 |
22.7 |
33.0 |
24.5 |
33.2 |
†29.5 |
21.5 |
50.2 |
29.5 |
31.8 |
|
4.1 |
Bills purchased and discounted |
35.6 |
8.1 |
53.0 |
16.4 |
34.0 |
†16.4 |
8.3 |
-10.4 |
27.0 |
12.8 |
|
4.2 |
Cash Credits, Overdrafts, etc. |
16.3 |
18.0 |
35.4 |
14.8 |
17.3 |
†28.5 |
21.3 |
64.2 |
29.1 |
30.2 |
|
4.3 |
Term Loans |
54.5 |
30.7 |
30.3 |
35.9 |
47.0 |
†32.2 |
24.1 |
54.4 |
30.4 |
35.7 |
5. |
Fixed Assets |
16.6 |
4.4 |
-4.2 |
-3.4 |
7.7 |
†9.1 |
6.8 |
2.5 |
27.8 |
8.7 |
6. |
Other Assets |
10.9 |
8.1 |
18.6 |
0.5 |
10.1 |
†12.8 |
13.6 |
31.3 |
37.8 |
19.5 |
Source : Balance sheets of respective banks. |
3.5 Bank group-wise, new private sector banks grew at the highest rate during 2005-06 (43.2 per cent), followed by foreign banks (31.2 per cent), public sector banks (13.6 per cent) and old private sector banks (12.2 per cent) (Table III.2). As a result, the relative significance of PSBs declined significantly with their share in total assets of SCBs declining to 72.3 per cent at end-March 2006 from 75.3 per cent at end-March 2005, while that of new private sector banks increasing to 15.1 per cent from 12.5 per cent. This mainly reflected the trend in deposits on the liabilities side (Table III.3).
Table III.3: Major Components of Balance Sheets of Scheduled Commercial
Banks ñ Bank Group-wise |
(As at end-March) |
(Per cent) |
Bank Group |
Assets |
Deposits |
Advances |
Investments |
|
2005 |
2006 |
2005 |
2006 |
2005 |
2006 |
2005 |
2006 |
1 |
2 |
3 |
4 |
5 |
6 |
7 |
8 |
9 |
Public Sector Banks |
75.3 |
72.3 |
†78.2 |
75.0 |
74.2 |
72.9 |
78.9 |
73.1 |
Nationalised Banks |
45.2 |
44.3 |
49.8 |
48.7 |
45.5 |
45.0 |
46.0 |
44.2 |
State Bank Group |
26.6 |
24.8 |
27.5 |
25.1 |
24.7 |
24.5 |
30.0 |
25.9 |
Other Public Sector Bank |
3.5 |
3.2 |
0.8 |
1.2 |
3.9 |
3.5 |
2.9 |
2.9 |
Private Sector Banks |
18.2 |
20.4 |
17.1 |
19.8 |
19.2 |
20.6 |
16.2 |
20.8 |
Old Private Sector Banks |
5.7 |
5.4 |
6.4 |
6.0 |
5.9 |
5.5 |
5.1 |
5.2 |
New Private Sector Banks |
12.5 |
15.1 |
10.8 |
13.8 |
13.3 |
15.2 |
11.0 |
15.6 |
Foreign Banks |
6.5 |
7.2 |
4.7 |
5.3 |
6.5 |
6.4 |
4.9 |
6.2 |
Scheduled Commercial Banks |
100.0 |
100.0 |
100.0 |
100.0 |
100.0 |
100.0 |
100.0 |
100.0 |
Source : Balance sheets of respective banks. |
3.6 Deposits of SCBs increased at a higher rate of 17.8 per cent during 2005-06 compared with 16.6 per cent in the previous year. Demand deposits and savings deposits grew at a significantly higher rate during 2005-06 as compared with the previous year. The growth rate of time deposits, which had moved up somewhat during 2004-05, slipped slightly during 2005-06, reflecting mainly the impact of growing competition from other savings instruments, especially life insurance policies and units of mutual funds. The efforts made by SCBs to raise deposits to fund the increased credit demand led to a significant shortening of the maturity profile of deposits in the banking system (Box III.2).
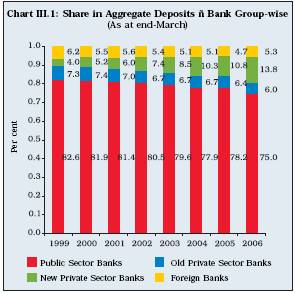
3.7 The issuance of certificates of deposit (CDs) during 2005-06 increased sharply as banks endeavoured to raise funds to meet the increased demand for credit. The amount of CDs outstanding increased from Rs.12,078 crore at end-March 2005 to Rs.43,568 crore by end-March 2006 and further to Rs.63,864 crore (September 15, 2006). The CDs outstanding constituted 2.0 per cent of aggregate deposits of SCBs at end-March 2006 compared with 0.7 per cent a year ago. Private sector banks were the major issuers of CDs, followed by foreign banks. In particular, banks with limited branch network and limited retail customer base have been resorting increasingly to issuance of CDs (Appendix Table III.2). 3.8 Reflecting the impact of India Millennium Deposits (IMDs) redemption (US $ 7.1 billion or Rs.31,959 crore) in December 2005, banksí nonresident foreign currency deposits declined by 22.2 per cent during 2005-06 as against a moderate increase of 1.1 per cent during 2004-05. 3.9 Bank group-wise, deposits of new private sector banks grew at the highest rate (50.7 per cent), followed by foreign banks (31.7 per cent), PSBs (12.9 per cent) and old private sector banks (11.4 per cent). The share of new private sector banks in total deposits has been rising gradually, while that of PSBs has been declining over the years (Chart III.1).
Box III.2: Changing Composition of Deposits of Scheduled Commercial Banks
Deposits of scheduled commercial banks are categorised into demand and time deposits. Demand deposits consist of: (i) current deposits; (ii) demand liability portion of savings bank deposits; (iii) margins held against letters of credit/guarantees; (iv) balances in overdue fixed deposits, cash certificates and cumulative/recurring deposits; (v) outstanding telegraphic transfers, mail transfers and demand drafts; (vi) unclaimed deposits; (vii) credit balances in the cash credit accounts; (viii) demand portion of Participation Certificates (PCs); and (ix) deposits held as security for advances which are payable on demand. Obviously there is no maturity period for demand deposits. On the other hand, time deposits comprise: (i) fixed deposits; (ii) cash certificates; (iii) cumulative and recurring deposits; (iv) time liability portion of savings bank deposits; (v) staff security deposits; (vi) margins held against letters of credit, if not payable on demand; (vii) fixed deposits held as securities for advances; and (viii) time portion of PCs. Time deposits could be further categorised into short-term (time liability portion of savings deposits and term deposits with contractual maturity of up to one year) and long-term deposits (term deposits with contractual maturity above one year).
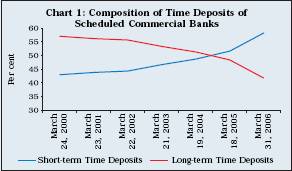
The share of demand deposits increased from 14.7 per cent at end-March 2001 to 17.0 per cent at end-March 20063, while that of time deposits declined from 85.2 per cent to 83.0 per cent during the same period. However, more significant changes were observed in the components of time deposits. The share of short-term deposits in the total time deposits increased sharply from 43.8 per cent at end-March 2000 to 58.2 at end-March 2006, and that of long-term deposits declined correspondingly (Chart 1).
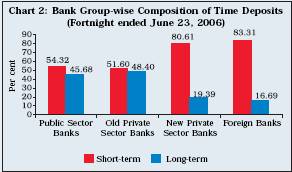
The share of short-term deposits in time deposits as on the last reporting Friday of June 2006, was the highest for foreign banks (83.3 per cent), followed by new private sector banks (80.6 per cent), public sector banks (54.3 per cent) and old private sector banks (51.6 per cent) (Chart 2).
The increased preference for short-term deposits could be attributed to low returns on long-term deposits. This is evident from the spread between short-term and long-term deposits, which narrowed down to 75 basis points at end-March 2006 from 100 basis points at end-March 2005 before widening a little by June 2006. In view of low spread, investors prefer short-term deposits, despite low returns, while waiting for investment opportunities with higher returns.
Banks on the other hand, prefer short-term deposits. With low short-term interest rates, banks are able to mobilise resources at lower cost. This enables banks in a competitive environment to lend at lower cost to well-rated business firms to contain defaults on their loans. In the Indian context, it is observed that foreign and private sector banks have relatively high share of low cost deposits. Incidentally, these bank groups also have high profit margin and low NPA levels.
Reference:
Reserve Bank of India (1998), Report of the Working Group on Money Supply: Analytics and Methodology of Compilation
(Chairman: Y.V. Reddy).
Non-Deposit Resources
3.10 In order to meet high credit demand and strengthen the capital base, eleven banks accessed the equity market to raise Rs.11,067 crore. Banks also raised Rs.30,151 crore from 97 issues in the private placement market as compared with Rs.15,219 crore through 87 issues in the previous year (refer section 6 for details).
International Liabilities of Banks
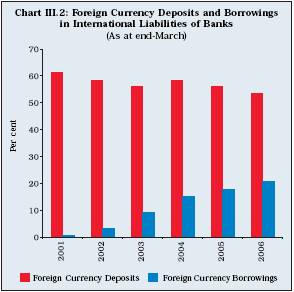
3.11 The international liabilities of banks increased sharply by 20.2 per cent during 2005-06 as against 15.5 per cent in 2004-05 mainly due to a sharp increase in foreign currency borrowings, FCNR(B) deposits, NRE rupee deposits, equities of banks held by non-residents and issuance of ADRs/ GDRs (Table III.4). Continuing the trend of last few years, the relative significance of foreign currency deposits declined further during 2005-06, while that of foreign currency borrowings increased (Chart III.2). As redemption of IMDs in December 2005 outweighed a sharp increase in holding of equities of banks by non-residents which boosted the share of ëother liabilitiesí, there was a decline in the share of ëown issues of securities/bondsí during 2005-06.
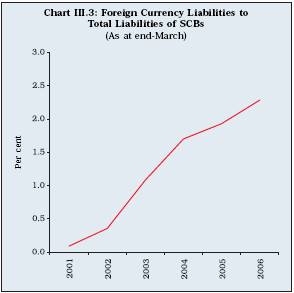
3.12 In recent years, external (international) sources of funds in banks' operations has been increasing, suggesting growing integration of the Indian banking sector with the international capital markets. This was reflected in the increase in the share of international liabilities of SCBs in total liabilities (Chart III.3).
Table III.4: International Liabilities of |
Banks ñ By Type |
(Amount in Rs. crore) |
Liability Type |
As at end-March |
|
2004 |
2005 |
2006 |
1 |
2 |
3 |
4 |
1. |
Deposits and Loans |
1,78,994 |
2,03,154 |
2,46,246 |
|
|
|
(81.1) |
(79.7) |
(80.3) |
|
of which: |
|
|
|
|
a) |
Foreign Currency |
|
|
|
|
|
Non-Resident Bank |
45,386 |
50,796 |
58,110 |
|
|
[FCNR(B)] |
(20.6) |
(19.9) |
(19.0) |
|
b) |
Foreign currency |
33,598 |
45,539 |
63,722 |
|
|
Borrowings * |
(15.2) |
(17.9) |
(20.8) |
|
c) |
Non-resident External |
75,938 |
85,811 |
1,00,310 |
|
|
Rupee (NRE) A/C |
(34.4) |
(33.7) |
(32.7) |
|
d) |
Non-Resident Ordinary |
4,059 |
6,393 |
5,449 |
|
|
(NRO) Rupee Deposits |
(1.8) |
(2.5) |
(1.8) |
2. |
Own Issues of Securities/Bonds 27,720 |
29,235 |
4,856 |
|
(including IMD/RIBs) |
(12.6) |
(11.5) |
(1.6) |
3. |
Other Liabilities |
14,017 |
22,609 |
55,506 |
|
of which: |
(6.4) |
(8.9) |
(18.1) |
|
a) |
ADRs/GDRs |
6,396 |
9,910 |
14,835 |
|
|
|
(2.9) |
(3.9) |
(4.8) |
|
b) |
Equities of banks |
1,379 |
3,230 |
28,438 |
|
|
held by non-residents |
(0.6) |
(1.3) |
(9.3) |
|
c) |
Capital/remittable profits |
|
|
|
|
|
of foreign banks in India |
|
|
|
|
|
and other unclassified |
6,242 |
9,469 |
12,233 |
|
|
international liabilities |
(2.8) |
(3.7) |
(4.0) |
Total International Liabilities |
2,20,730 |
2,54,999 |
3,06,609 |
(1+2+3) |
(100.0) |
(100.0) |
(100.0) |
* : Inter-bank borrowings in India and from abroad, and external commercial borrowings of banks.
Note : Figures in brackets are percentages to total.
Source: Locational Banking Statistics. |
Bank Credit
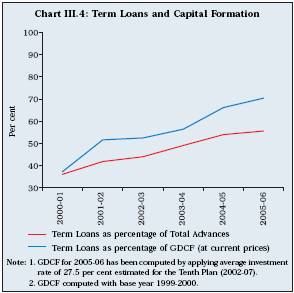
3.13 Loans and advances of SCBs registered a robust growth of 31.8 per cent during 2005-06 on top of the high growth of 33.2 per cent in 2004-05 (Box III.3). Among the major components of bank credit, while bills purchased and discounted grew at a lower rate in 2005-06 as compared with the previous year, cash credit and overdrafts registered a robust growth. Term loans, which constitute the largest component of advances, grew sharply by 35.7 per cent during the year, the trend which was observed in previous years as well. As a result, the share of term loans in both total advances and gross domestic capital formation (GDCF) has increased significantly in recent years (Chart III.4). Sectoral Deployment of Gross Bank Credit
3.14 Non-food bank credit increased sharply during 2005-06. The credit growth was broad based. Credit to services (including personal loans and other services) increased by 52.8 per cent in 2005-06, accounting for 58.3 per cent of incremental non-food gross bank credit (NFGBC). Personal loans increased sharply in 2005-06 mainly on account of housing loans. Real estate loans more than doubled during the year (Table III.5; Appendix Table III.3). Other personal loans such as credit card outstanding and education loans also recorded sharp increases of 59.3 per cent and 96.5 per cent, respectively.
Box III.3: Analysis of Credit Growth
The bank lending has expanded in a number of emerging market economies, especially in Asia and Latin America, in recent years. Bank credit to the private sector, in real terms, was rising at a rate between 10 and 40 per cent in a number of countries by 2005 (BIS, 2006). Several factors have contributed to the significant rise in bank lending in emerging economies such as strong growth, excess liquidity in banking systems reflecting easier global and domestic monetary conditions, and substantial bank restructuring. The recent surge in bank lending has been associated with important changes on the asset side of banksí balance sheet. First, credit to the business sector - historically the most important component of banksí assets - has been weak, while the share of the household sector has increased sharply in several countries. Second, banksí investments in Government securities increased sharply until 2004-05. As a result, commercial banks continue to hold a very large part of their domestic assets in the form of Government securities - a process that seems to have begun in the mid-1990s.
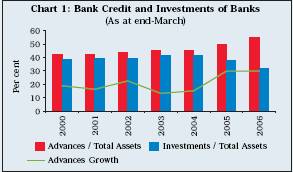
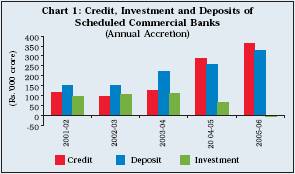
There has been a sharp pick up in bank credit in India in recent years. The rate of growth in bank credit which touched a low of 14.4 per cent in 2002-03, accelerated to more than 30.0 per cent in 2004-05, the rate which was maintained in 2005-06 (Chart 1). The upturn in the growth rate of bank credit can be attributed to several factors. One, macroeconomic performance of the economy turned robust with GDP growth rates hovering between 7.5 per cent and 8.5 per cent during the last three years. Two, the hardening of sovereign yields from the second half of 2003-04 forced banks to readjust their assets portfolio by shifting from investments to advances. While the share of gross advances in total assets of commercial banks grew from 45.0 per cent to 54.7 per cent, that of investments declined from 41.6 per cent to 32.1 per cent in the last two years.
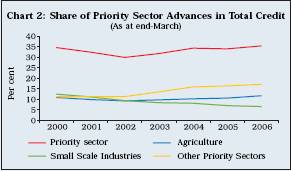
However, the credit growth has been broad-based making banks less vulnerable to credit concentration risk. The declining trend of priority sector loans in 2001-02 in the credit book of banks was due to prudential write offs and compromise settlements of a large number of small accounts which was reversed from 2002-03 on the strength of a spurt in the housing loan portfolio of banks (Chart 2). Even though credit to industry and other sectors has also picked up, their share in total loans has declined marginally.
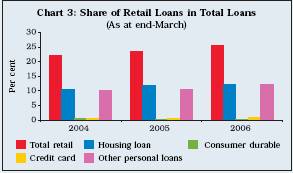
Retail loans, which witnessed a growth of over 40.0 per cent in 2004-05 and again in 2005-06, have been the prime driver of the credit growth in recent years. Retail loans as a percentage of gross advances increased from 22.0 per cent in March 2004 to 25.5 per cent in March 2006 (Chart 3). Of the components of retail credit, the growth in housing loans was 50.0 per cent in 2004-05 and 34.0 per cent in 2005-06. Banksí direct exposure to commercial real estate also more than doubled in the last financial year.
The cyclical uptrend in the economy along with the concomitant recovery in the business climate brings with it improved abilities of the debtors to service loans, thereby greatly improving banksí
asset quality. Despite the sharp rise in credit growth in recent years, not only the proportional levels of gross non-performing loans (NPLs) have declined, but the absolute levels of gross NPLs declined significantly. Several factors have contributed to the marked improvement in the Indian banksí asset quality. One, banks have gradually improved their risk management practices and introduced more vigorous systems and scoring models for identifying credit risks. Two, a favourable macroeconomic environment in recent years has also meant that many entities and units of traditionally problematic industries are now performing better. Three, diversification of credit base with increased focus on retail loans, which generally have low delinquency rates, has also contributed to the more favourable credit risk profile. Four, several institutional measures have been put in place to recover the NPAs. These include Debt Recovery Tribunals (DRTs), Lok Adalats (peopleís courts), Asset Reconstruction Companies (ARCs) and corporate debt restructuring mechanism (CDRM). In particular, the Securitisation and Reconstruction of Financial Assets and Enforcement of Security Interest (SARFAESI) Act, 2002 for enforcement of security interest without intervention of the courts has provided more negotiating power to the banks for resolving bad debts.
References:
Bank for International Settlement (2006), ëThe Banking System in Emerging Economies: How much progress has been made?í BIS Papers No 28, August.
Djankov, S. C. McLiesh and A. Shleifer (2005), ëPrivate credit in 129 countriesí, NBER Working Paper 11078, January.
International Monetary Fund (2004), ëAre Credit Booms in Emerging Markets a Concern?í, World Economic Outlook, Chapter IV, April.
Liping, H. and F. Gang (2002), ëConsumer Finance in China: Recent Development Trendsí, China and World Economy.
3.15 Based on the provisional data available, bank credit to the retail sector increased by 47.2 per cent at end-June 2006 (year-on-year) with housing loans increasing by 54.3 per cent. Credit to real estate recorded an annualised growth of 102.4 per cent. Growth in credit to agriculture and industry was 36.8 per cent and 26.6 per cent, respectively.
Priority Sector Advances
3.16 Credit to the priority sector increased by 33.7 per cent in 2005-06 as against 40.3 per cent in the previous year. The agriculture and housing sectors were the major beneficiaries, which together accounted for more than two-third of incremental priority sector lending in 2005-06. Credit to small scale industries also accelerated (Table III.6). Several favourable policy initiatives undertaken by the Central Government and the Reserve Bank including, inter alia, the policy package for stepping up of credit to small and medium enterprises (SMEs) announced on August 10, 2005, have had a positive impact.
Table III.6: Credit to the Priority Sector |
(Amount in Rs. crore) |
Category |
|
Outstanding as on |
|
|
March |
March |
March |
March |
|
21, 2003 |
19, 2004 |
18, 2005 |
31, 2006 |
1 |
2 |
3 |
4 |
5 |
Priority Sector |
2,11,609 |
2,63,834 |
3,81,476 |
5,09,910 |
(a+b+c) |
(20.7) |
(24.7) |
(40.3) |
(33.7) |
a) Agriculture |
73,518 |
90,541 |
1,25,250 |
1,72,292 |
|
(21.0) |
(23.2) |
(35.1) |
(37.6) |
b) Small Scale |
60,394 |
65,855 |
74,588 |
90,239 |
Industries |
(5.6) |
(9.0) |
(12.2) |
(21.0) |
c) Other Priority |
77,697 |
1,07,438 |
1,81,638 |
2,47,379 |
Sectors |
(35.6) |
(38.3) |
(61.8) |
(36.2) |
Note :
1. Figures in brackets are annual growth rates in per cent.
2. Due to reclassification of sectors and increase in coverage
of banks, data for 2004-05 (47 banks) are not strictly
comparable to those of 2005-06 (52 banks). |
3.17 The outstanding advances of PSBs to priority sector increased by 33.7 per cent during 2005-06. The PSBs, as a group, achieved the priority sector target of 40.0 per cent of net bank credit (NBC) as on the last reporting Friday of March 2006. However, the sub-targets of 18.0 per cent and 10.0 per cent of NBC for credit to agriculture sector and the weaker sections, respectively, were not met (Table III.7 and Appendix Table III.4 and III.5). At the individual bank-level, all the nationalised banks, and all but
Table III.7: Priority Sector Lending by |
Public and Private Sector Banks |
(As on the last reporting Friday of March) |
(Amount in Rs. crore) |
Item |
Public Sector |
Private Sector |
|
Banks |
Banks |
|
2005 |
2006@ |
2005 |
2006@ |
1 |
2 |
3 |
4 |
5 |
Priority Sector |
3,07,046 |
4,10,379 |
69,886 |
1,06,566 |
Advances |
|
(42.8) |
(40.3) |
(43.6) |
(42.8) |
of which: |
|
|
|
|
|
Agriculture |
1,09,917 |
1,54,900 |
21,636 |
36,185 |
|
|
|
(15.3) |
(15.2) |
(13.5) |
(13.5) |
Small-scale Industries |
67,800 |
82,492 |
8,592 |
10,447 |
|
|
|
(9.5) |
(8.1) |
(5.4) |
(4.2) |
Other Priority Sector |
1,25,114 |
1,64,473 |
38,797 |
58,243 |
|
|
|
(17.4) |
(16.2) |
(24.2) |
(23.4) |
@: Provisional.
Note: (i) Figures in brackets represent percentages to net bank credit for the respective groups.
(ii) Indirect agriculture is reckoned up to 4.5 per cent of
net bank credit for calculation of percentage of agriculture. |
two of the State Bank group (State Bank of India and State Bank of Patiala) were able to meet the priority sector target of 40 per cent of NBC. However, only ten PSBs (Allahabad Bank, Andhra Bank, Bank of India, Indian Bank, Indian Overseas Bank, Punjab National Bank, Syndicate Bank, State Bank of Bikaner and Jaipur, State Bank of Indore and State Bank of Saurashtra) were able to achieve the sub-targets for agriculture, while the sub-target for weaker sections was met by eight PSBs (Allahabad Bank, Andhra Bank, Bank of India, Indian Bank, Indian Overseas Bank, Punjab National Bank, Syndicate Bank and State Bank of Patiala).
3.18 Total priority sector advances extended by private sector banks increased sharply by 52.5 per cent during 2005-06. As on the last reporting Friday of March 2006, the credit to the priority sector by private sector banks accounted for 42.8 per cent of net bank credit ñ well above the stipulated target level (Table III.7). While advances to agriculture by private sector banks registered a sharp increase of 67.2 per cent in 2005-06, in relation to NBC, it still fell short of the sub-target of 18 per cent. None of the private sector banks could meet the sub-targets for agriculture and weaker sections, barring one (Ganesh Bank of Kurundwad). Loans to ëother priority sectorí increased by 50.1 per cent and to SSIs by 21.6 per cent, respectively, during 2005-06. In the case of private sector banks, the share of ëother priority sectorí was the highest at 36.4 per cent of NBC, followed by advances to agriculture and small scale industries (Appendix Table III.6 and III.7). 3.19 Lending to the priority sector by foreign banks constituted 34.6 per cent of net bank credit as on the last reporting Friday of March 2006, which was well above the stipulated target of 32 per cent. The share of export credit in total net bank credit at 19.4 per cent was significantly above the prescribed sub-target of 12.0 per cent. Foreign banks, however, fell a little short of the sub-target of 10.0 per cent in respect of lending to SSIs (Table III.8).
Special Agricultural Credit Plans
3.20 The Reserve Bank had advised public sector banks to prepare Special Agricultural Credit Plans (SACP) on an annual basis in 1994. The SACP mechanism for private sector banks was made applicable from 2005-06, as recommended by the Advisory Committee on Flow of Credit to Agriculture and Related Activities from the Banking System (Chairman: Prof. V.S. Vyas) and announced in the Mid-term Review of Annual Policy for 2004-05. Public sector banks were advised to make efforts to increase their disbursements to small and marginal farmers to 40.0 per cent of their direct advances under SACP by March 2007. The disbursement to agriculture under SACP by public sector banks aggregated Rs.94,278 crore during 2005-06, which was much above the target of Rs.85,024 crore and the disbursement of Rs.65,218 crore during 2004-05. The disbursement by private sector banks during 2005-06 at Rs.31,119 crore was above the target of Rs.24,222 crore.
3.21 Public sector banks were advised to earmark 5.0 per cent of their net bank credit to women. At end-March 2006, aggregate credit to women by public sector banks stood at 5.37 per cent of their net bank credit with 22 banks achieving the target. A consortium of select public sector banks was formed, with the State Bank of India as the leader of the consortium, to provide credit to the Khadi and Village Industries Commission (KVIC). These loans are provided at 1.5 per cent below the average prime lending rates of five major banks in the consortium. An amount of Rs.322 crore was outstanding at end-July 2006 out of Rs.738 crore disbursed by the consortium under the scheme.
Table III.8: Priority Sector Lending by Foreign Banks |
(As on the last reporting Friday of March) |
(Amount in Rs. crore) |
Sector |
2004 |
2005 |
2006@ |
|
Amount |
Percentage |
Amount |
Percentage |
Amount |
Percentage |
|
|
to net bank |
|
to net bank |
|
to net bank |
|
|
credit |
|
credit |
|
credit |
1 |
2 |
3 |
4 |
5 |
6 |
7 |
Priority Sector Advances # |
17,960 |
34.1 |
23,843 |
35.3 |
30,449 |
34.6 |
of which: |
|
|
|
|
|
|
Export credit |
9,760 |
18.5 |
12,339 |
18.3 |
17,102 |
19.4 |
Small-scale industries |
5,307 |
10.1 |
6,907 |
10.2 |
8,446 |
9.6 |
@ : Provisional.
# : Inclusive of advances for setting up industrial estates, loans to software industries, food and agro-processing sector, self-help groups and venture capital. |
Micro-finance
3.22 The Reserve Bank has been making consistent efforts to strengthen credit delivery, improve customer service and encourage banks to provide banking services to all segments of the population. Despite considerable expansion of the banking system in India, large segments of the countryís population do not have access to banking services. Expanding the outreach of banking services has, therefore, been a major thrust area of the policy of the Government of India and the Reserve Bank in recent years. The cumulative number of SHGs, with the credit linkages by banks increased to 2.24 million as on March 31, 2006 from 1.62 million as on March 31, 2005. Loans extended by banks grew by 65.2 per cent to Rs.11,398 crore at end-March 2006. The number of poor families, thus, benefiting through SHGs increased by 35.4 per cent to over 32.9 million as on March 31, 2006 (see Chapter IV).
Credit to Industry
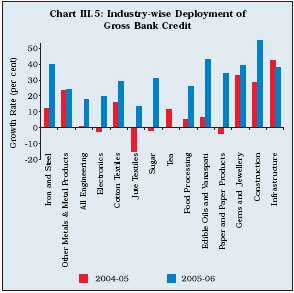
3.23 Credit to industry (small, medium and large) exhibited a higher growth in 2005-06 as compared with the previous year. However, the share of outstanding credit to industry in non-food gross bank credit declined to 39.1 per cent in March 2006 from 42.7 per cent in March 2005 due to higher increase in the overall credit. Infrastructure accounted for the largest share (24.4 per cent) of incremental total bank credit to industry, followed by basic metals and metal products (14.1 per cent) and textiles (11.2 per cent) (Appendix Table III.8). Power (within infrastructure structure) and iron and steel (within metal and metal products industry) accounted for the largest increase. The other major industries to which flow of bank credit increased were cotton textiles, food processing, construction, gems and jewellery, and engineering (Chart III.5).
Retail Credit
3.24 Continuing the strong growth in recent years, retail advances increased by 40.9 per cent to Rs.3,75,739 crore in 2005-06, which was significantly higher than the overall credit growth of 31.0 per cent. As a result, their share in total loans and advances increased during the year. Auto loans experienced the highest growth, followed by credit card receivables, other personal loans (comprising loans mainly to professionals and for educational purposes) and housing finance. Loans for consumer durables increased by 17.3 per cent as against the decline of 39.1 per cent in the previous year (Table III.9).
Table III.9: Retail Portfolio of Banks |
(Amount in Rs. crore) |
Item |
Outstanding as at |
Percentage |
|
end-March |
Variation |
|
2005 |
2006 |
|
1 |
2 |
3 |
4 |
1. |
Housing Loans |
1,34,276 |
1,79,116 |
33.4 |
2. |
Consumer Durables |
3,810 |
4,469 |
17.3 |
3. |
Credit Card Receivables |
8,405 |
12,434 |
47.9 |
4. |
Auto Loans |
35,043 |
61,369 |
75.1 |
5. |
Other Personal Loans |
85,077 |
1,18,351 |
39.1 |
Total Retail Loans |
2,66,610 |
3,75,739 |
40.9 |
(1+2+3+4+5) |
(23.7) |
(25.5) |
|
Total Loans and |
|
|
|
Advances of SCBs |
11,25,056 |
14,73,723 |
31.0 |
Note : Figures within brackets represent percentage share in total loans and advances.
Source : Off-site Returns. |
Table III.10: Lending to the Sensitive Sector |
by Scheduled Commercial Banks |
(As at end-March) |
(Amount in Rs. crore) |
Sector |
2005 |
Per cent |
2006 |
Per cent |
|
|
to Total |
|
to Total |
1 |
2 |
3 |
4 |
5 |
1. Capital Market |
15,860 |
9.83 |
22,077 |
7.7 |
† |
(265.80) |
† |
(39.2) |
† |
2. Real Estate Market |
1,45,605 |
88.71 |
2,60,223 |
90.77 |
|
(820.71) |
† |
(81.78) |
† |
3. Commodities |
2,366 |
1.47 |
4,391 |
1.53 |
|
(-74.69) |
† |
(85.56) |
† |
Total (1+2+3) |
1,63,831 |
100.0 |
2,86,691 |
100.0 |
|
(452.06) |
† |
(77.65) |
† |
Note : Figures in brackets are percentage
Variations over the previous year. |
Lending to the Sensitive Sectors
3.25 Lending by SCBs to the sensitive sectors (capital market, real estate and commodities) increased sharply during 2005-06 mainly on account of a sharp increase in exposure to the real estate market (Table III.10). Total exposure of SCBs to the sensitive sectors consituted 18.9 per cent of aggregate bank loans and advances (comprising 17.2 per cent to real estate, 1.5 per cent to the capital market and 0.3 per cent to the commodities sector).
3.26 Among bank groups, new private sector banks had the highest exposure to the sensitive sectors (measured as percentage to total loans and advances of banks) mainly due to the increase in exposure to the real estate market, followed by foreign banks, old private sector banks and public sector banks (Table III.11 and Appendix Table III.10).
Investments
3.27 Investments by banks comprise two broad categories, viz., SLR investments (comprising Government and other approved securities which are eligible for being reckoned for maintaining the statutory liquidity ratio) and non-SLR investments (comprising commercial paper, shares, bonds and debentures issued by the corporate sector). Almost four-fifths of the investments of banks are in the SLR securities. During 2005-06, overall investments of SCBs declined marginally by 0.3 per cent, as against the increase of 8.1 per cent in the previous year, mainly due to decline in SLR investments.
3.28 Banks are required to maintain statutory liquidity ratio (SLR) of 25 per cent of the net demand and time liabilities (NDTL) in Government and other approved securities from October 1997. However, SCBs have been investing in Government and other approved securities much in excess of the statutory stipulation since the mid-1990s. Such investments reached an all-time high of 42.7 per cent of NDTL on April 16, 2004. However, in the wake of increased credit demand, banks have been gradually readjusting their SLR portfolio in the last two years (Box III.5). For the first time since the nationalisation of banks in 1969, investment by SCBs in SLR securities in absolute terms declined by Rs.21,699 crore during 2005-06 in contrast to an increase of Rs.61,566 crore in 2004-05 (Chart III.6).
Non-SLR Investments
3.29 Banksí investments in non-SLR securities also declined by 9.4 per cent (Rs.13,824 crore) as compared with an increase of 4.1 per cent
Table III.11: Lending to the Sensitive Sectors ñ Bank Group-wise* |
(Per cent) |
Sector |
Public Sector |
New Private |
Old Private |
Foreign |
|
Banks |
Sector Banks |
Sector Banks |
Banks |
|
2004-05 |
2005-06 |
2004-05 |
2005-06 |
2004-05 |
2005-06 |
2004-05 |
2005-06 |
1 |
2 |
3 |
4 |
5 |
6 |
7 |
8 |
9 |
Capital Market# |
1.1 |
1.2 |
2.2 |
2.3 |
1.1 |
1.3 |
3.1 |
2.3 |
Real Estate Market@ |
9.1 |
14.2 |
28.4 |
28.8 |
12.7 |
14.5 |
21.5 |
25.6 |
Commodities |
0.1 |
0.1 |
0.7 |
1.3 |
0.1 |
0.2 |
0.0 |
0.0 |
Total Advances to Sensitive Sectors |
10.3 |
15.5 |
31.3 |
32.4 |
14.0 |
16.0 |
24.6 |
27.9 |
* Advances to sensitive sector as percentage to total loans and advances of the concerned bank group.
# : Exposure to capital market is inclusive of both investments and advances.
@ : Exposure to real estate sector is inclusive of both direct and indirect lending. |
Box III.4: Changing Investment Portfolio of Banks
Banks are required to invest a prescribed minimum of their net demand and time liabilities in Government and other approved securities, as per the BR Act, 1949. As a part of the financial sector reforms, the SLR requirement for the banks was gradually reduced to 25 per cent by October 1997 from its peak of 38.5 per cent in February 1992. However, even after major reduction in SLR stipulations, banks maintained an average SLR investments of 37.3 per cent of the net demand and time liabilities during the period 1998-99 to 2002-03. The reduced demand for credit on account of slowdown of industrial sector, which was undergoing a phase of restructuring, forced banks to park their funds in Government securities. In the declining interest rate scenario, such investments became particularly attractive for banks due to their high yield. Incidentally, the period of low demand for credit coincided with the period when banks were making efforts to raise their capital levels and reduce the levels of NPAs. The application of capital adequacy norms, which required banks to maintain 8 per cent of their risk-weighted assets as capital from March 31, 1996, and the pressure to bring down their NPA levels made banks somewhat risk averse. As such investments in Government and other approved securities, which attracted zero-risk weights, became the preferred form of investments by banks.
The period 1998-99 to 2002-03 was followed by a period of high economic growth and a sharp pick-up in credit. From 2003-04 onwards, however, banks faced increased competition from other saving instruments and the growth of aggregate deposits slowed down to 15.4 per cent in 2004-05 from 16.4 per cent in 2003-04 caused primarily by term deposits. During this period, sovereign yield hardened significantly. The combination of these factors led to a significant adjustment in the investment portfolio of banks. Banks endeavoured to meet the increased credit demand by restricting fresh investments in Government securities (2004-05) and then liquidating Government securities (2005-06). A more or less similar trend was observed in respect of non-SLR investments. Increased access to the capital market and recourse to non-deposit resources eased the pressure for the banks only to an extent (Chart 1).
References:
RBI Bulletin (2005), Performance of the Private Corporate Sector in the post Liberalisation Period, November. Ramasastri, A. S and N. K. Unnikrishnan (2006),ëIs the Role of Banks as Financial Intermediaries Decreasing? A Helicopter Tourí, Economic and Political Weekly, Vol XLI, No.11, March.
(Rs.5,700 crore) in the previous year (Table III.12). While investments in bonds/debentures declined sharply, those in shares and commercial paper increased. The total flow of funds from SCBs to
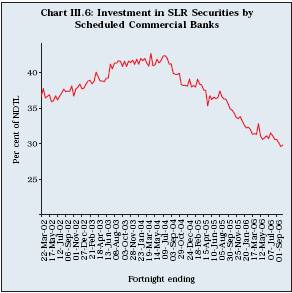
Table III.12: Non-SLR Investments of |
Scheduled Commercial Banks |
(Amount in Rs. crore) |
Sector |
March |
Per cent |
March |
Per cent |
|
18, 2005 |
to |
17, 2006 |
to |
|
|
Total |
|
Total |
1 |
2 |
3 |
4 |
5 |
1. |
Commercial Paper |
3,944 |
2.7 |
4,166 |
3.1 |
2. |
Investment in shares |
13,795 |
9.4 |
15,496 |
11.7 |
|
of which: |
|
|
|
|
|
a) Public sector |
|
|
|
|
|
undertakings |
1,886 |
1.3 |
2,274 |
1.7 |
|
b) Private corporate sector |
10,289 |
7.0 |
10,501 |
7.9 |
3. |
Investments in bonds/ |
|
|
|
|
|
debentures |
1,15,894 |
79.2 |
1,05,452 |
79.6 |
|
of which: |
|
|
|
|
|
a) Public sector undertakings 46,939 |
32.1 |
33,724 |
25.4 |
|
b) Private corporate sector |
31,994 |
21.9 |
31,236 |
23.6 |
4. |
Units of Mututal Funds |
12,744 |
8.7 |
7,439 |
5.6 |
Total Non-SLR Investment |
|
|
|
|
(1+2+3+4) |
1,46,377 |
100.0 |
1,32,553 |
100.0 |
Note : Data exclude RRBs.
Source : Section 42 (2) returns submitted by SCBs. |
Table III.13: Composition of Non-SLR Investments |
(Per cent) |
|
2000-01 |
2001-02 |
2002-03 |
2003-04 |
2004-05 |
2005-06 |
1 |
2 |
3 |
4 |
5 |
6 |
7 |
Commercial Paper |
7.3 |
7.2 |
3.1 |
2.7 |
2.7 |
3.1 |
Bonds/debentures |
80.3 |
81.7 |
84.2 |
81.5 |
79.2 |
79.6 |
Shares |
6.0 |
6.6 |
7.9 |
7.3 |
9.4 |
11.7 |
Units of Mutual Funds |
6.3 |
4.5 |
4.9 |
8.5 |
8.7 |
5.6 |
Note: Data excludes RRBs.
Source: Section 42(2) returns submitted by SCBs. |
the commercial sector, including non-SLR investments, increased by 28.3 per cent (Rs.3,40,573 crore) compared with 29.0 per cent (Rs.2,59,259 crore) in the last year.
3.30 A part of non-SLR portfolios was also used to fund the strong demand for credit. Among the major heads of non-SLR portfolio, reduction was significant in fixed income instruments such as bonds and debentures of public sector undertakings and units of mutual funds. Investments in shares, however, increased significantly. This was reflected in the composition of non-SLR investments (Table III.13).
International Assets of the Banking System
3.31 Increased demand for credit was also reflected in high growth of foreign currency loans to residents and outstanding export bills drawn on non-residents by residents. The share of ënostro balancesí in total international assets increased by 1.3 percentage points during 2005-06 as compared with a decline by 7.1 percentage points during 2004-05. (Table III.14).
3.32 The consolidated international claims of banks rose by 24.9 per cent during 2005-06 as against the decline of 5.0 per cent during 2004-05. Reversing the trend of the previous year, the
Table III.14: International Assets of Banks ñ By Type |
(As at end-March) |
(Amount in Rs. crore) |
|
|
2004 |
2005 |
2006 |
1 |
|
2 |
3 |
4 |
International Assets (1+2+3) |
1,15,765 |
1,33,237 |
1,58,201 |
1. |
Loans and Deposits |
1,08,527 |
1,24,582 |
1,46,014 |
|
of which |
|
(93.7) |
(93.5) |
(92.3) |
|
a) |
Loans to Non-Residents* |
|
4,281 |
4,103 |
6,270 |
|
|
|
|
|
(3.7) |
(3.1) |
(4.0) |
|
b) |
Foreign Currency Loans to Residents ** |
44,079 |
58,092 |
63,231 |
|
|
|
|
|
(38.1) |
(43.6) |
(40.0) |
|
c) |
|
Outstanding Export Bills drawn on Non-Residents by Residents |
20,609 |
26,171 |
31,556 |
|
|
|
|
|
(17.8) |
(19.6) |
(19.9) |
|
d) |
Nostro Balances@ |
|
39,282 |
35,673 |
44,515 |
|
|
|
|
|
(33.9) |
(26.8) |
(28.1) |
2. |
Holdings of Debt Securities |
|
858 |
979 |
2,079 |
|
|
|
|
|
(0.7) |
(0.7) |
(1.3) |
3. |
Other Assets @@ |
|
6,380 |
7,676 |
10,109 |
|
|
|
|
|
(5.5) |
(5.8) |
(6.4) |
* : Includes Rupee loans and foreign currency (FC) loans out of non-residents (NR) deposits.
** : Includes loans out of FCNR (B) deposits, PCFCís, FC lending to and FC deposits with banks in India.
@ : Includes placements made abroad and balances in term deposits with NR banks.
@@ : Capital supplied to and receivable profits from foreign branches/subsidiaries of Indian banks and other Unclassified international assets.
Note
: Figures in brackets are percentages to total.
Source : Locational Banking Statistics. |
share of short-term claims (with residual maturity less than one year) in the consolidated international claims declined during 2005-06, while that of long-term claims increased more or less correspondingly.
3.33 Sector-wise classification of the international claims of banks indicated, by and large, the pattern of the previous year. The reporting banks preferred to invest/lend largest amount to ënon-bank privateí sector, followed by the bank sector (Table III.15).
Table III.15: Classification of Consolidated
International Claims of Banks ñ
By Maturity and Sector
(As at end-March) |
(Amount in Rs. crore) |
Residual Maturity/Sector |
2004 |
2005 |
2006 |
1 |
2 |
3 |
4 |
Total Consolidated |
|
|
|
International Claims |
78,124 |
74,238 |
92,711 |
a) Maturity-wise |
|
|
|
1) Short-term (residual maturity |
58,677 |
61,113 |
73,176 |
less than one year) |
(75.1) |
(82.3) |
(78.9) |
2) Long Term (residual maturity |
17,820 |
11,951 |
18,627 |
of one year and above) |
(22.8) |
(16.1) |
(20.1) |
3) Unallocated |
1,627 |
1,174 |
907 |
|
(2.1) |
(1.6) |
(1.0) |
b) Sector-wise |
|
|
|
1) Bank |
43,057 |
34,301 |
43,050 |
|
(55.1) |
(46.2) |
(46.4) |
2) Non Bank Public |
1,520 |
1,145 |
1,248 |
|
(1.9) |
(1.5) |
(1.3) |
3) Non Bank Private |
33,547 |
38,792 |
48,413 |
|
(42.9) |
(52.3) |
(52.2) |
Note :
1. Figures in brackets are percentages to total.
2. Unallocated residual maturity comprises maturity
not applicable (e.g.,
for equities) and maturity
information not available from reporting bank
branches.
3. Bank sector includes official monetary institutions
(e.g., IFC, ECB, etc.) and central banks.
4. Prior to the quarter ended March 2005, ënon-bank
publicí sector comprised of companies/institutions
other than banks in which shareholding of state/
central governments was at least 51 per cent,
including state/central governments and their
departments. From March 2005 quarter, ënon-bank
publicí sector comprises only state/central
governments and
their departments and,
accordingly, all other entities excluding banks are
classified under ënon-bank privateí sector.
Source:
Consolidated Banking Statistics ñ Immediate Country
Risk Basis. |
3.34 The consolidated international claims of banks based on immediate country risk, underwent some change during the year. While the share of claims of banks on the US and Hong Kong declined significantly, those on the U.K. increased. As at end-March 2006 the US, the UK, Hong Kong, Germany and Singapore together accounted for 57.0 per cent of total consolidated international claims (Table III.16).
Quarterly Trends - Commercial Banking Survey4
3.35 As the reporting Fridays for end-September and end-March during 2005-06 fell on September 30, 2005 and March 31, 2006 (coinciding with half-yearly and annual closing, respectively), the second and fourth quarters witnessed sharp increases in deposits and credit aggregates vis-a-vis the other quarters as well as the corresponding quarters of the previous year. 3.36 During Q1 of 2005-06, credit expansion was more than fresh accretion to deposits due mainly to a sharp decline in demand deposits. To meet the gap, banks liquidated their SLR and non-SLR investments. Banks also liquidated foreign currency assets. A sharp increase in capital account also enabled banks to meet the increased credit demand.
Table III.16: Consolidated International Claims
of Banks on Countries other than India |
(As at end-March) |
(Amount in Rs. crore) |
|
2004 |
2005 |
2006 |
1 |
2 |
3 |
4 |
Total Consolidated |
|
|
|
International Claims |
78,124 |
74,238 |
92,711 |
Of which: |
|
|
|
|
a) |
United States of America |
19,915 |
22,348 |
23,176 |
|
|
|
(25.5) |
(30.1) |
(25.0) |
b) |
United Kingdom |
9,879 |
7,608 |
14,212 |
|
|
|
(12.6) |
(10.2) |
(15.3) |
c) |
Hong Kong |
12,353 |
7,389 |
6,652 |
|
|
|
(15.8) |
(10.0) |
(7.2) |
d) |
Germany |
4,593 |
3,607 |
4,678 |
|
|
|
(5.9) |
(4.9) |
(5.0) |
e) |
Singapore |
3,729 |
3,510 |
4,182 |
|
|
|
(4.8) |
(4.7) |
(4.5) |
Note : Figures in brackets are percentage share in total international claims.
Source : Consolidated Banking Statistics ñ Immediate Country Risk Basis. |
3.37 In Q2, net accretion to deposits was quite large as also the expansion of credit to the commercial sector. However, net accretion to aggregate deposits exceeded the credit to the commercial sector. Banks, therefore, increased their investment in government securities. 3.38 In Q3, accretion to aggregate deposits and credit offtake declined sharply. However, credit to commercial sector was almost four times the fresh accretion in aggregate deposits. Banks investments in foreign currency assets also increased sharply. To meet the funding gap, banks liquidated investments both in Government securities and non-SLR investments.
3.39 During Q4, while aggregate deposits of residents increased sharply, non-repatriable foreign currency deposits declined. Credit offtake also increased during Q4. However, banks liquidated investments in Government and other approved securities but increased their exposure to non-SLR securities. Banks also augmented their cash and balances with the Reserve Bank (Table III.17 and Appendix Table III.11).
Table III.17: Operations of Scheduled Commercial Banks : Quarterly Trends |
(Amount in Rs. crore) |
Item |
Outstanding |
Variations |
|
at end-March
2006 |
2004-05 |
2005-06 |
2006-07 |
|
|
Q1 |
Q2 |
Q3 |
Q4 |
Q1 |
Q2 |
Q3 |
Q4 |
Q1 |
Q2 |
1 |
2 |
3 |
4 |
5 |
6 |
7 |
8 |
9 |
10 |
11 |
12 |
Components |
|
|
|
|
|
|
|
|
|
|
|
1. Aggregate Deposits of |
|
|
|
|
|
|
|
|
|
|
|
Residents |
20,49,773 |
57,050 |
21,232 |
38,447 |
78,251 |
7,145 |
1,29,596 |
13,065 |
1,90,983 |
30,677 |
1,57,233 |
a. |
Demand Deposits |
3,64,640 |
-12,155 |
2,277 |
15,280 |
17,604 |
-22,249 |
41,167 |
-3,430 |
63,135 |
-41,272 |
33,809 |
b. |
Time Deposits of |
|
|
|
|
|
|
|
|
|
|
|
|
Residents |
16,85,133 |
69,206 |
18,955 |
23,167 |
60,647 |
29,394 |
88,430 |
16,495 |
1,27,848 |
71,949 |
1,23,423 |
2. Call/Term Funding from |
|
|
|
|
|
|
|
|
|
|
|
Financial Institutions |
83,144 |
5,409 |
530 |
35,464 |
3,451 |
-1,002 |
7,359 |
1,836 |
3,031 |
3,118 |
-1,611 |
Sources |
|
|
|
|
|
|
|
|
|
|
|
1. Credit to Government |
7,00,742 |
40,056 |
-9546 |
-5,918 |
39,632 |
-1,457 |
18,324 |
-25,068 |
-11,314 |
23,238 |
6,904 |
2. Credit to the Commercial |
|
|
|
|
|
|
|
|
|
|
|
Sector (a to d) |
16,63,499 |
32,884 |
40,538 |
1,08,835 |
79,929 |
12,862 |
1,04,416 |
53,032 |
1,72,011 |
22,606 |
1,38,787 |
a. |
Bank Credit |
15,07,077 |
38,085 |
41,605 |
1,07,402 |
72,551 |
8,994 |
1,15,035 |
62,858 |
1,67,981 |
14,050 |
1,33,607 |
|
i) Food Credit |
40,691 |
7,100 |
-4,872 |
5,590 |
-2,659 |
4,788 |
-5,255 |
1,464 |
-322 |
607 |
-7,840 |
|
ii) Non-food Credit |
14,66,386 |
30,985 |
46,477 |
1,01,812 |
75,210 |
4,206 |
1,20,290 |
61,394 |
1,68,303 |
13,443 |
1,41,446 |
b. |
Net Credit to |
|
|
|
|
|
|
|
|
|
|
|
|
Primary Dealers |
4,369 |
-678 |
977 |
-923 |
125 |
7,130 |
-2,759 |
1,128 |
-2,930 |
-1,963 |
2,916 |
c. |
Investments in other |
|
|
|
|
|
|
|
|
|
|
|
|
Approved Securities |
16,712 |
184 |
-561 |
-1,232 |
-680 |
-532 |
-10 |
-736 |
-2,017 |
526 |
4,642 |
d. |
Other Investments |
|
|
|
|
|
|
|
|
|
|
|
|
(in non-SLR Securities) |
1,35,340 |
-4,339 |
-1482 |
3,587 |
7,933 |
-2,730 |
-7,851 |
-10,218 |
8,961 |
9,993 |
-2,327 |
3. Net Foreign currency assets |
|
|
|
|
|
|
|
|
|
|
|
of Commercial Banks |
-45,616 |
-6,706 |
904 |
-3,172 |
-8,652 |
-2,057 |
-4,850 |
9,935 |
26,612 |
-21,137 |
11,679 |
a. |
Foreign Currency Assets |
43,494 |
-2,741 |
56 |
2,441 |
-8,051 |
-2,179 |
-1,044 |
11,169 |
6,114 |
-13,919 |
9,283 |
b. |
Non-resident Foreign |
|
|
|
|
|
|
|
|
|
|
|
|
Currency Repatriable |
|
|
|
|
|
|
|
|
|
|
|
|
Fixed Deposits |
59,275 |
953 |
-189 |
-654 |
692 |
804 |
187 |
1,856 |
-19,723 |
3,917 |
1,506 |
c. |
Overseas Foreign |
|
|
|
|
|
|
|
|
|
|
|
|
Currency Borrowings |
29,834 |
3,012 |
-658 |
6,267 |
-90 |
-925 |
3,618 |
-622 |
-775 |
3,301 |
-3,903 |
4. Net Bank Reserves |
1,38,619 |
10,392 |
-3,644 |
14,151 |
-1,267 |
3,060 |
9,679 |
-2,886 |
25,729 |
-6,090 |
20,455 |
5. Capital Account |
1,77,727 |
14,884 |
1,393 |
9,435 |
3,423 |
20,359 |
2,530 |
9,342 |
8,090 |
12,025 |
3,079 |
Note :
1. Data are provisional.
2. Time deposits include the impact of redemption of India Millennium Deposits (IMDs), since December 29, 2005.
3. Data relate to last reporting Friday of each quarter. |
Credit-Deposit Ratio
3.40 The high rate of bank credit growth during last two years had resulted in a unique behaviour of credit-deposit (C-D) ratio and investment-deposit (I-D) ratio. The incremental C-D ratio, which was lower than the incremental I-D ratio up to August 6, 2004, rose sharply thereafter, while the incremental I-D ratio declined. This trend was accentuated in 2005-06 as throughout the year the C-D ratio remained significantly higher than the I-D ratio. 3.41 Owing to large credit offtake, the incremental C-D ratio remained generally above hundred per cent throughout the year. On account of unwinding of investment in SLR securities, the incremental I-D ratio varied in the range of 22.3 per cent to (-) 11.6 per cent. The incremental credit-deposit and investment-deposit ratios generally depicted a negative relationship. When the incremental C-D ratio fell from its peak of 111.8 per cent in July 2005 through to 96.0 per cent in mid-November 2005, the incremental I-D ratio turned negative in July 2005, and then moved upwards to 16.0 per cent by mid-November 2005. The incremental I-D ratio again turned negative during the fortnight ended January 6, 2006. The ratio recovered to the positive region till February 3, 2006 only to turn negative again. Thus, in times of high credit demand, banks may not prefer to invest in Government securities (Chart III.7). 3.42 The C-D and I-D ratios, based on the outstanding amount, which moved more or less
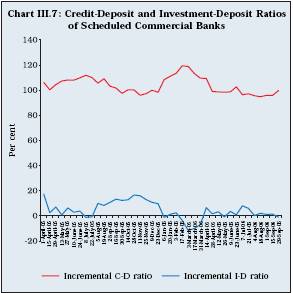
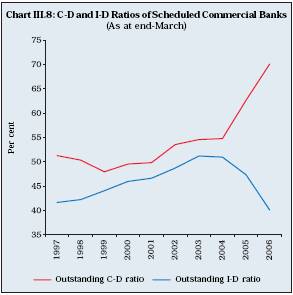
in the same direction between 1999 and the third quarter of 2004-05, tended to move in opposite directions thereafter. As at end-March, the C-D ratio stood at an all-time high level of 70.1 per cent, while the I-D ratio dropped to a low of 40.1 per cent (Chart III.8).
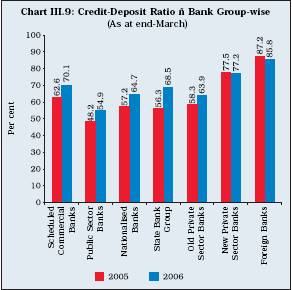
3.43 Among bank-groups, foreign banks had the highest C-D ratio (in terms of outstanding amount) at end-March 2006, followed by new private sector banks, old private sector banks and public sector banks (Chart III.9).
1 SCBs comprise 28 public sector banks (State Bank of India and its seven associates, 19 nationalised banks and the Industrial Development Bank of India Ltd.), 8 new private sector banks, 19 old private sector banks and 29 foreign banks. Ganesh Bank of Kurundwad Limited, which was placed under moratorium on July 7, 2006 and later merged with Federal Bank Limited on September 2, 2006, did not bring out its annual accounts for the year 2005-06.
2 As at end-March 2006.
3 Percentages presented are based on the last reporting Friday of the respective month and year, as reported under Section 42 (2) of the Reserve Bank of India Act, 1934.
4 Based on information received under Section 42 (2) Returns of the Banking Regulation Act, 1949. |