Headline inflation remained at
elevated levels till August 2006 in major advanced economies against the backdrop
of high international crude oil prices. There was some easing during September
2006 on the back of softening of oil prices; core inflation, however, remains
firm. Many central banks continued with pre-emptive monetary tightening to abate
the second round effects of soaring oil prices, especially in the face of strong
demand. In August 2006, the European Central Bank (ECB), the Bank of England,
the Reserve Bank of Australia, the Bank of Korea, the Bank of Israel and the
South African Reserve Bank raised their policy rates. The ECB and the South
African Reserve Bank raised their policy rates again in October 2006. The US
Fed, however, has left its rates unchanged since end-June 2006.
In India, headline inflation has
largely remained contained during 2006-07 so far. Primary food articles prices
have emerged as the key driver of inflation. Wholesale price inflation was 5.2
per cent on October 7, 2006 as compared with 4.1 per cent at end-March 2006.
Pre-emptive monetary and fiscal measures have helped in containing inflationary
expectations although underlying inflationary pressures remain.
Global Inflation
Headline inflation remained firm up to August 2006 in major advanced economies
in tandem with the movements in international crude oil prices; there was, however,
some easing during September 2006 on the back of base effects as well as the
sharp decline in international crude oil prices (Chart 19). Consumer price
inflation in the OECD countries,
as a whole, increased from 2.5 per cent in March 2006 to 3.2 per cent in June
2006 before moderating marginally to 3.0 per cent in August 2006. Headline inflation
in the US reached 4.3 per cent in June 2006 before easing sharply to 2.1 per
cent in September 2006 largely due to the softening of international crude oil
prices as well as the favourable base effects of higher fuel prices a year ago.
Similarly, in the euro area, inflation remained above the target of ‘below but
close to 2.0 per cent’ till August 2006 (2.3 per cent). It moderated to 1.8
per cent in September 2006. However, core inflation, which had till recently
remained relatively stable, has shown signs of some increase. Many central banks,
therefore, tightened monetary policy during the second quarter of 2006-07 in
order to contain inflation and inflationary expectations, especially in view
of continued strength of demand and possible stronger pass-through of previous
increases in oil prices.
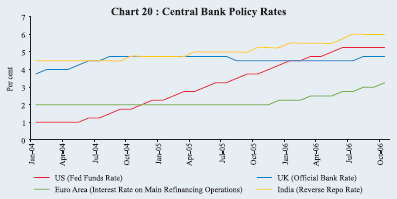
The US Fed, after having raised
its target federal funds rate by 25 basis points on 17 successive occasions
between June 2004 and June 2006 – a cumulative increase of 425 basis points
since the tightening began in June 2004 – paused at each of its three meetings
held since end-June 2006 (Chart 20). Economic growth has moderated from its
quite strong pace earlier this year, partly reflecting a cooling of the housing
market. Although core inflation has been elevated in recent months, and the
high level of resource utilisation has the potential to sustain inflation pressures,
the Fed sees inflation pressures likely to moderate over time reflecting reduced
impetus from energy prices, contained inflation expectations, and the cumulative
effects of monetary policy actions and other factors restraining aggregate demand.
The FOMC has indicated that the extent and timing of any additional firming
that may be needed to address the inflation risks will depend on the evolution
of the outlook for both inflation and economic growth, as implied by incoming
information.
As regards the euro area, notwithstanding
some easing in inflation in September 2006, risks to the price outlook are seen
on the upside due to the possibility of stronger pass-through of past oil price
rises, and additional increases in administered prices and indirect taxes along
with stronger than currently expected wage developments. The European Central
Bank (ECB), therefore, raised the key policy rate by 25 basis points each in
August and October 2006 – a total increase of 125 basis points since December
2005 – to keep medium to long-term inflation expectations in the euro area anchored
to levels consistent with price stability (Table 25). The ECB has indicated
that it would resort to a progressive withdrawal of monetary accommodation if
situation so warrants. In the UK, in view of strong economic activity, limited
spare capacity, rapid growth of broad
|
Table 25: Global Inflation Indicators |
| |
|
|
|
|
|
|
(Per cent) |
|
Country/ |
Key Policy Rate |
Policy Rates |
Changes in |
CPI |
Growth |
|
Region |
|
(As on October |
Policy Rates |
Inflation |
(y-o-y) |
| |
|
25, 2006) |
(basis points) |
(y-o-y) |
|
|
| |
|
|
Since |
Since |
2005 |
2006 |
2005 |
2006 |
| |
|
|
end- |
end- |
(Sept.) |
(Sept.) |
(Q2) |
(Q2) |
| |
|
|
March |
March |
|
|
|
|
| |
|
|
2005 |
2006 |
|
|
|
|
|
1 |
2 |
3 |
4 |
5 |
6 |
7 |
8 |
9 |
|
Developed Economies |
|
|
|
|
|
|
|
|
Australia |
Cash Rate |
6.00 (Aug. 2) |
50 |
50 |
3.0 |
3.9 |
2.6 |
1.9 |
|
Canada |
Overnight Rate |
4.25 (May 24) |
175 |
50 |
3.4 |
0.7 |
2.7 |
2.9 |
|
Euro area |
Interest Rate on |
3.25 (Oct. 5) |
125 |
75 |
2.6 |
1.8 |
1.5 |
2.4 |
| |
Main Refinancing |
|
|
|
|
|
|
|
| |
Operations |
|
|
|
|
|
|
|
|
Japan |
Uncollateralised |
0.25 (July 14) |
** |
25 |
-0.3 |
0.9 * |
2.6 |
2.5 |
| |
Overnight Call Rate |
|
|
|
|
|
|
|
|
UK |
Official Bank Rate |
4.75 (Aug. 3) |
0 |
25 |
2.5 |
2.4 |
1.7 |
2.6 |
|
US |
Federal Funds Rate |
5.25 (June 29) |
250 |
50 |
4.7 |
2.1 |
3.1 |
3.5 |
|
Developing Economies |
|
|
|
|
|
|
|
|
Brazil |
Selic Rate |
13.75 (Oct. 18) |
(-)550 |
(-)275 |
6.1 |
3.7 |
3.8 |
1.2 |
|
India |
Reverse Repo Rate |
6.00 (July 25) |
125 |
50 |
3.4 |
6.3 * |
8.5 |
8.9 |
|
Indonesia |
BI Rate |
10.75 (Oct. 5) |
225^ |
(-)200 |
9.1 |
14.5 |
5.6 |
5.2 |
|
Israel |
Key Rate |
5.25 (Oct. 23) |
175 |
50 |
1.9 |
1.3 |
4.8 |
6.2 |
|
Korea |
Overnight Call Rate |
4.50 (Aug. 10) |
125 |
50 |
2.7 |
2.4 |
4.5 |
4.6 @ |
|
Philippines |
Reverse Repo Rate |
7.50 (Oct. 20, |
75 |
0 |
7.0 |
5.7 |
4.8 |
5.5 |
| |
|
2005) |
|
|
|
|
|
|
|
South Africa |
Repo Rate |
8.50 (Oct. 13) |
100 |
150 |
4.0 |
5.4 * |
4.5 |
3.6 |
|
Thailand |
14-day Repurchase Rate |
5.00 (June 7) |
275 |
50 |
6.0 |
2.7 |
4.6 |
4.9 |
|
*: August. ^: Change since July 2005. @: Third Quarter.
** : The Bank of Japan decided on March 9, 2006 to change the operating target of money market operations from the
outstanding balance of current accounts at the Bank to the uncollateralised overnight call rate.
Note :
1. Indian data on inflation pertain to CPI for Industrial Workers.
2. Figures in parentheses in column (3) give the date when the policy rates were last revised.
Source : International Monetary Fund, websites of respective central banks and the Economist. |
money and credit, and expectations about inflation remaining
above the target, the Bank of England – after keeping the policy rate unchanged
for almost a year –raised its policy rate by 25 basis points to 4.75 per cent
on August 3, 2006.
In Japan, the Bank of Japan (BoJ) expects the economy to expand
for a sustained period and the year-on-year change in the consumer prices is
also projected to continue to follow a positive trend. Accordingly, after maintaining
zero interest rates for an extended period, the BoJ, on July 14, 2006, increased
the uncollateralised overnight call rate (adopted as the operating target of
monetary policy since March 2006) by 25 basis points. The Reserve Bank of Australia
also raised its policy rate by 25 basis points each in May 2006 and August 2006
to 6.0 per cent in response to strong economic activity and underlying inflation
pressures.
As regards emerging Asia, inflation remains relatively modest
in a number of economies reflecting both pre-emptive monetary tightening as
well as appreciation of the exchange rates. In view of inflationary pressures
seen from strong economic recovery and high oil prices, the Bank of Korea raised
the policy rate by 25 basis points each in June and August 2006 to 4.50 per
cent – a total increase of 125 basis points since the tightening began in October
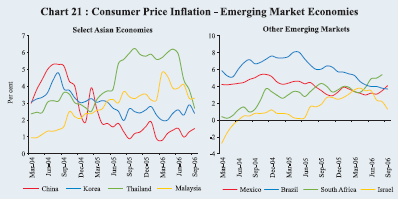
2005. Despite strong growth, consumer price inflation in China remains low (1.3
per cent in August 2006, same level as a year ago) as higher prices of foodgrains,
fruits and residence were offset by lower prices of poultry and its products
(Chart 21). In view of stronger growth in money supply and credit, however,
the People’s Bank of China increased the benchmark 1-year lending rate by 27
basis points each in April 2006 and August 2006. It has also raised the cash
reserve ratio by 50 basis points each effective July 5, 2006 and August 15,
2006 to 8.5 per cent. On the other hand, after raising the policy rate by 275
basis points between June 2005
and June 2006, Thailand has kept its policy rate unchanged
thereafter as core inflation remains within the target range. In Indonesia,
the policy rate has been cut by 200 basis points since May 2006 to 10.75 per
cent to support growth. The Bank Indonesia had raised policy rates by 425 basis
points during July-December 2005. Inflation still remains high reflecting the
oil price pass-through, although there has been some moderation from its recent
peak of 18.4 per cent in November 2005 to 14.5 per cent in September 2006.
Amongst other emerging economies, South Africa – after having
kept policy rates unchanged since April 2005 – raised the policy rates by 50
basis points each in June, August and October 2006 to 8.5 per cent to control
inflationary pressures emanating from persistent petrol price increases and
currency depreciation. Turkey increased its policy rate by 425 basis points
during June-July 2006 as inflation rate significantly exceeded the target path
and on concerns over the possible pass-through effect of the exchange rate movements
arising from the volatility in international financial markets. On the other
hand, in view of weak economic activity, Brazil has reduced policy rates on
eleven occasions (by 600 basis points) since September 2005 to 13.75 per cent
on October 18, 2006. The Bank of Israel also cut its policy rate by 25 basis
points on October 23, 2006, after having raised rates by 200 basis points between
October 2005 and August 2006.
Global Commodity Prices
During the quarter ended September 2006, metals prices remained firm largely
reflecting strong demand on the back of robust growth in emerging economies,
especially China (Chart 22). Prices of wheat have edged higher, largely reflecting
shortfall in global production. Prices of edible oils have also increased
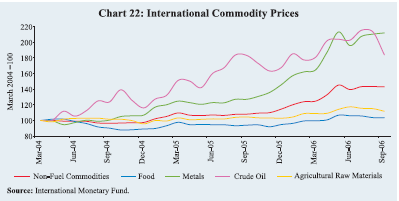
in recent months. Crude oil and sugar prices, on the other hand, eased during
the quarter ended September 2006.
Despite some deceleration in growth in global oil demand, international
crude oil prices firmed up till mid-August 2006 reflecting limited spare capacity
and geo-political uncertainties (Table 26). WTI prices reached a high of US
$ 75.3 a barrel on April 21, 2006 reflecting renewed concerns over Iran’s nuclear
programme and unrest in Nigeria. Prices eased marginally in subsequent weeks
to around US $ 70 a barrel, partly on concerns of slowdown in demand in view
of further monetary tightening. However, they again edged higher on concerns
of geo-political uncertainties in the Middle East and reached a new record high
of US $ 78.4 a barrel on July 14, 2006.
After hovering around US $ 75 a barrel during July 2006 and
the first half of August 2006, prices eased sharply to reach around US $ 60
a barrel in the second half of September 2006 – the lowest in the past six months
– on the back of signs of possible slowdown of the US economy, increased US
stocks and easing of tensions over Iran’s nuclear programme. Prices fell below
US $ 60 a barrel in early October 2006 on the back of substantial build up of
US inventories. Although prices have eased significantly over the past one month,
they still remain quite high. Moreover, it is uncertain as to whether this recent
fall will be sustained in view of limited spare global crude oil production
capacity and tight supply-demand balance (Table 27). Furthermore, in view of
the decline in oil prices, the
|
Table 26: International Crude Oil Prices |
| |
|
|
|
(US dollars per barrel) |
|
Year/Month |
Dubai Crude |
UK Brent |
US WTI |
Average |
Indian |
| |
|
|
Crude Price |
Basket Price |
|
1 |
2 |
3 |
4 |
5 |
6 |
| |
|
|
|
|
|
|
2001-02 |
21.8 |
23.2 |
24.1 |
23.0 |
22.4 |
|
2002-03 |
25.9 |
27.6 |
29.2 |
27.6 |
26.6 |
|
2003-04 |
26.9 |
29.0 |
31.4 |
29.1 |
27.8 |
|
2004-05 |
36.4 |
42.2 |
45.0 |
41.3 |
38.9 |
|
2005-06 |
53.4 |
58.0 |
59.9 |
57.1 |
55.4 |
|
March 2004 |
30.5 |
33.8 |
36.7 |
33.7 |
31.9 |
|
March 2005 |
45.6 |
53.1 |
54.2 |
50.9 |
48.8 |
|
March 2006 |
57.7 |
62.3 |
62.9 |
60.9 |
59.6 |
|
April 2006 |
64.1 |
70.4 |
69.5 |
68.0 |
66.8 |
|
May 2006 |
64.9 |
70.2 |
70.9 |
68.7 |
67.2 |
|
June 2006 |
65.1 |
68.9 |
70.9 |
68.3 |
66.7 |
|
July 2006 |
69.1 |
73.9 |
74.4 |
72.5 |
71.1 |
|
August 2006 |
68.8 |
73.6 |
73.0 |
71.8 |
70.9 |
|
September 2006 |
59.8 |
62.8 |
63.8 |
62.1 |
61.1 |
|
January-September 2006 (Average) |
62.8 |
67.3 |
68.1 |
66.0 |
64.7 |
|
Source : International Monetary Fund and the World Bank. |
|
Table 27: World Supply-Demand Balance of Oil |
| |
|
|
|
|
|
|
|
(Million barrels per day) |
|
Item |
2003 |
2004 |
2005 |
2006 |
2007 |
|
2006 |
|
|
| |
|
|
|
|
(P) |
(P) |
Q1 |
Q2 P |
Q3 P |
Q4 P |
|
1 |
|
2 |
3 |
4 |
5 |
6 |
7 |
8 |
9 |
10 |
|
Demand |
|
|
|
|
|
|
|
|
|
|
1. |
OECD |
48.7 |
49.5 |
49.4 |
49.3 |
49.7 |
50.0 |
47.9 |
49.1 |
50.1 |
|
2. |
Non-OECD |
31.2 |
33.0 |
34.4 |
35.7 |
36.8 |
35.1 |
35.2 |
35.5 |
36.9 |
| |
of which: China |
5.6 |
6.5 |
6.9 |
7.4 |
7.9 |
7.2 |
7.3 |
7.4 |
7.6 |
|
3. |
Total (1+2) |
79.9 |
82.5 |
83.8 |
85.0 |
86.5 |
85.1 |
83.1 |
84.6 |
87.0 |
|
Supply |
|
|
|
|
|
|
|
|
|
|
4. |
Non-OPEC |
48.9 |
50.1 |
50.2 |
50.9 |
52.1 |
50.4 |
50.6 |
51.0 |
51.5 |
|
5. |
OPEC |
30.7 |
32.9 |
34.2 |
33.8 |
34.4 |
33.9 |
33.6 |
34.0 |
33.8 |
|
6. |
Total (4+5) |
79.6 |
83.1 |
84.4 |
84.7 |
86.5 |
84.4 |
84.3 |
85.0 |
85.3 |
|
Stock Changes |
0.3 |
-0.6 |
-0.5 |
0.2 |
0.0 |
0.8 |
-1.1 |
-0.4 |
1.7 |
|
P : Projections.
Source : US Energy Information Administration, October 2006. |
Organisation of the Petroleum Exporting Countries (OPEC) has decided to reduce crude oil production by 1.2 million barrels per day effective November 1, 2006. The Energy Information Administration (EIA) of the US expects WTI prices to average US $ 63 a barrel in the fourth quarter of calendar 2006. Accordingly, the EIA expects prices to average US $ 66.9 per barrel in calendar year 2006, an increase of about 18 per cent over the price prevailing in 2005 (US $ 56.5 per barrel).
Prices of metals, led by copper, zinc and aluminium, firmed up sharply during April and early May 2006, reaching record highs/multi-year highs on the back of robust construction and manufacturing demand from China and the US, and supply constraints amidst growing investors’ interest (Table 28). However, following the release of higher than anticipated US inflation data for April 2006, global metal prices witnessed correction in mid-May 2006 on fears that further tightening by the US might slow down demand for metals. Metals have recovered some of the losses since then. As a result, prices are still substantially higher than their levels a year ago – prices of copper and zinc during September 2006 were higher by about 98 per cent and 143 per cent, respectively, over September 2005 levels. International steel prices corrected in May 2006 but again edged higher during June-July 2006.
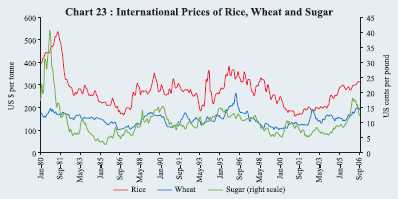
Wheat and rice prices have firmed up since the second half of 2005 due to lower production, higher demand from many countries in Asia, and a tightening of export availabilities in major exporting countries. The recent rise in international prices of wheat and rice comes after a period of some softness in the late 1990s. International prices of rice had eased from 1997 onwards and stabilised at around US $ 200 per tonne during 2000-2003. Since then,
|
Table 28: International Commodity Prices |
| |
|
|
|
2005 |
2006 |
2006 |
|
Commodity |
Unit |
2004 |
2005 |
Jul-Sep |
Apr-Jun |
Jul-Sep |
Mar |
|
May |
Jun |
Aug |
Sep |
|
1 |
2 |
3 |
4 |
5 |
6 |
7 |
8 |
|
9 |
10 |
11 |
12 |
|
Energy |
|
|
|
|
|
|
|
|
|
|
|
|
|
Coal |
$/mt |
53.0 |
47.6 |
48.4 |
52.6 |
50.3 |
49.7 |
|
52.6 |
52.4 |
50.9 |
47.3 |
|
Crude oil (Average) |
$/bbl |
37.7 |
53.4 |
60.0 |
68.3 |
68.8 |
60.9 |
|
68.7 |
68.3 |
71.8 |
62.1 |
|
Non-Energy Commodities |
|
|
|
|
|
|
|
|
|
|
|
|
Palm oil |
$/mt |
471.3 |
422.1 |
415.0 |
438.7 |
492.7 |
440.0 |
|
440.0 |
437.0 |
510.0 |
497.0 |
|
Soybean oil |
$/mt |
616.0 |
544.9 |
551.7 |
576.3 |
620.3 |
539.0 |
|
588.0 |
601.0 |
629.0 |
602.0 |
|
Soybeans |
$/mt |
306.5 |
274.7 |
278.3 |
263.7 |
263.6 |
256.0 |
|
266.0 |
267.0 |
262.0 |
257.0 |
|
Rice |
$/mt |
237.7 |
286.3 |
281.6 |
307.6 |
313.4 |
303.5 |
|
308.0 |
312.5 |
312.7 |
312.0 |
|
Wheat |
$/mt |
156.9 |
152.4 |
151.0 |
189.6 |
196.1 |
174.4 |
|
193.2 |
195.2 |
189.9 |
196.0 |
|
Sugar |
c/kg |
15.8 |
21.8 |
22.0 |
36.5 |
30.6 |
38.0 |
|
37.1 |
34.0 |
29.8 |
26.6 |
|
Cotton A Index |
c/kg |
136.6 |
121.7 |
120.4 |
121.8 |
128.4 |
129.3 |
|
120.2 |
121.5 |
132.1 |
131.0 |
|
DAP |
$/mt |
221.2 |
247.0 |
261.6 |
266.9 |
260.3 |
256.6 |
|
270.8 |
269.2 |
260.9 |
258.8 |
|
Urea |
$/mt |
175.3 |
219.0 |
211.7 |
228.1 |
210.4 |
244.1 |
|
227.8 |
208.2 |
213.7 |
215.3 |
|
Aluminium |
$/mt |
1716.0 |
1898.0 |
1829.0 |
2653.0 |
2482.0 |
2429.0 |
2861.0 |
2477.0 |
2460.0 |
2473.0 |
|
Copper |
$/mt |
2866.0 |
3679.0 |
3757.0 |
7210.0 |
7670.0 |
5103.0 |
8046.0 |
7198.0 |
7696.0 |
7602.0 |
|
Gold |
$/toz |
409.2 |
444.8 |
439.5 |
627.4 |
621.5 |
557.1 |
|
675.4 |
596.1 |
632.6 |
598.2 |
|
Silver |
c/toz |
669.0 |
734.0 |
709.0 |
1226.0 |
1169.0 |
1037.5 |
1337.8 |
1077.4 |
1225.0 |
1160.0 |
|
Steel products |
1990=100 |
121.5 |
137.9 |
138.6 |
131.6 |
135.8 |
138.6 |
|
125.2 |
131.2 |
135.8 |
135.8 |
|
price index |
|
|
|
|
|
|
|
|
|
|
|
|
|
Steel cold-rolled |
$/mt |
607.1 |
733.3 |
750.0 |
666.7 |
700.0 |
750.0 |
|
600.0 |
650.0 |
700.0 |
700.0 |
|
coil/sheet |
|
|
|
|
|
|
|
|
|
|
|
|
|
Steel hot-rolled |
$/mt |
502.5 |
633.3 |
650.0 |
591.7 |
600.0 |
650.0 |
|
550.0 |
575.0 |
600.0 |
600.0 |
|
coil/sheet |
|
|
|
|
|
|
|
|
|
|
|
|
|
Tin |
c/kg |
851.3 |
738.0 |
704.7 |
852.9 |
865.3 |
794.0 |
|
883.7 |
789.6 |
850.2 |
903.9 |
|
Zinc |
c/kg |
104.8 |
138.1 |
129.7 |
329.2 |
336.3 |
241.7 |
|
356.6 |
322.6 |
334.7 |
340.3 |
|
$ : US dollar c : US cent bbl: barrel mt : metric tonne kg : kilogram toz : troy oz.
Source : World Bank. |
prices have edged higher to cross US $ 300, but still remain
lower than the levels touched in mid-1990s. Similarly, prices of wheat, after
remaining largely range-bound between 1998 and 2004, have edged higher from
mid-2005 onwards (Chart 23). According to the latest assessment by Food and
Agriculture Organisation (FAO), global cereal production is expected to decline
by 1.6 per cent in 2006-07 mainly on account of decline of 4.6 per cent in wheat
on the back of exceptionally hot and dry weather affecting crops in Australia,
Argentina and Brazil; as a result, wheat stocks are expected to fall by 12.4
per cent by the end of 2006-07 season. Rice production, on the other hand, is
expected to increase by 0.5 per cent. With utilisation recording a steady increase,
stocks of cereals are estimated to fall to 421.7 million tonnes by the end of
2006-07 season – a decline of 10 per cent over the previous season. This is
expected to keep prices of cereals, especially wheat, firm.
Prices of oilseeds and edible oils edged up till August 2006
due to strong consumption demand from China, and demand for non-food uses such
as biodiesel from the EU and the US. Prices, however, fell to some extent in
September 2006. International sugar prices, after having recorded large increase
during January-February 2006, eased sharply during August-September 2006 on
forecasts of higher global production during 2006-07. According to the International
Sugar Organisation, global sugar production is estimated to increase by about
5 million tonnes to 155 million tonnes during 2006-07 (October-September) season,
exceeding global consumption by 2.2 million tonnes. The continuing expansion
in Brazil, the world’s largest producer, along with likely higher production
in India and recovery in the Far East is expected to more than offset the contraction
in EU output. Notwithstanding the recent easing, prices of sugar in September
2006 were almost 14 per cent higher than their levels a year ago.
Inflation Conditions in India
Taking into account the real, monetary and global factors having
a bearing on domestic prices, the Reserve Bank in its Annual Policy Statement
for 2006-07 (April 2006) noted that containing inflationary expectations would
continue to pose a challenge to monetary management. The policy endeavour would
be to contain the year-on-year inflation rate for 2006-07 in the range of 5.0-5.5
per cent. Against the backdrop of widespread and simultaneous monetary policy
tightening among several countries in early June 2006 following marked and heightened
volatility in the international financial markets, and in the light of the prevailing
domestic monetary and credit environment, the LAF reverse repo and repo rates
were increased effective June 9, 2006 by 25 basis points each to
5.75 per cent and 6.75 per cent, respectively. In its First
Quarter Review of the Annual Statement on Monetary Policy (July 2006), the Reserve
Bank observed that containing inflation in the range of 5.0-5.5 per cent warrants
appropriate priority in policy responses. Accordingly, the Reserve Bank raised
the reverse repo rate and the repo rate by 25 basis points each to 6.00 per
cent and 7.00 per cent, respectively, on July 25, 2006 while continuing to keep
Bank Rate and cash reserve ratio unchanged (Table 29).
Inflation movements in 2006-07 have been driven largely by
primary food articles prices. The impact of mineral oils, which have been the
major driver of inflation over the past two years, petered out by early September
2006 on the back of base effects. Headline inflation remained within the indicative
trajectory although underlying inflationary pressures continued. Inflation expectations
remained largely stable, reflecting pre-emptive monetary policy and fiscal measures.
The pass-through of international oil prices to domestic prices in a phased
manner amidst the burden sharing strategy by oil companies as well as duty reductions
also mitigated the immediate cost push impact of international crude oil prices.
Furthermore, competitive pressures, corporate profitability and
|
Table 29: Movement in Key Policy Rates |
| |
|
|
|
|
(Per cent) |
|
Effective since |
Reverse |
Repo |
Effective since |
Bank |
Effective since |
CRR |
| |
Repo |
Rate |
|
Rate |
|
|
| |
Rate |
|
|
|
|
|
|
1 |
2 |
3 |
4 |
5 |
6 |
7 |
|
March 5, 2002 |
6.00 |
8.50 |
April 2, 2000 |
7.00 |
December 29, 2001 |
5.50 |
|
March 28, 2002 |
6.00 |
8.00 |
July 22, 2000 |
8.00 |
June 1, 2002 |
5.00 |
|
June 27, 2002 |
5.75 |
8.00 |
February 17, 2001 |
7.50 |
November 16, 2002 |
4.75 |
|
October 30, 2002 |
5.50 |
8.00 |
March 2, 2001 |
7.00 |
June 14, 2003 |
4.50 |
|
November 12, 2002 |
5.50 |
7.50 |
October 23, 2001 |
6.50 |
September 18, 2004 |
4.75 |
|
March 3, 2003 |
5.00 |
7.50 |
October 30, 2002 |
6.25 |
October 2, 2004 |
5.00 |
|
March 7, 2003 |
5.00 |
7.10 |
April 30, 2003 |
6.00 |
|
|
|
March 19, 2003 |
5.00 |
7.00 |
|
|
|
|
|
August 25, 2003 |
4.50 |
7.00 |
|
|
|
|
|
March 31, 2004 |
4.50 |
6.00 |
|
|
|
|
|
October 27, 2004 |
4.75 |
6.00 |
|
|
|
|
|
April 29, 2005 |
5.00 |
6.00 |
|
|
|
|
|
October 26, 2005 |
5.25 |
6.25 |
|
|
|
|
|
January 24, 2006 |
5.50 |
6.50 |
|
|
|
|
|
June 9, 2006 |
5.75 |
6.75 |
|
|
|
|
|
July 25, 2006 |
6.00 |
7.00 |
|
|
|
|
|
Note : With effect from October 29, 2004, nomenclature of repo and reverse repo has been interchanged as per international usage.
Prior to that date, repo indicated absorption of liquidity while reverse repo meant injection of liquidity.
The nomenclature in this Report is based on the new use of terms even for the period prior to October 29, 2004. |
productivity gains in several sectors have enabled corporates
to absorb a part of the higher input costs into their profit margins. This has
partially helped in abating the second order effects of higher oil prices and
contained manufactured products inflation.
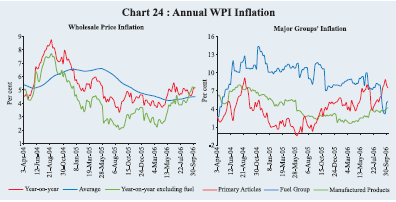
Headline inflation, based on movement in the wholesale
price index (WPI), eased initially to 3.7 per cent as on April 15, 2006 from
4.1 per cent at end-March 2006, reflecting partly the base effect of higher
prices last year. Inflation rate edged up in May-June 2006 to reach 5.5 per
cent on June 17, 2006 due to higher prices of petrol and diesel, vegetables,
milk and metals. Subsequently, inflation moderated to reach 4.6 per cent as
on July 15, 2006. It edged up again to 5.0 per cent during August 2006. Headline
inflation moderated thereafter to 4.6 per cent on September 9, 2006 partly due
to favourable base effects, but edged up to 5.2 per cent during the week ended
October 7, 2006 reflecting higher electricity prices (Chart 24 and Table 30).
The average WPI inflation rate eased to 4.5 per cent as on October 7, 2006 from
5.3 cent a year ago.
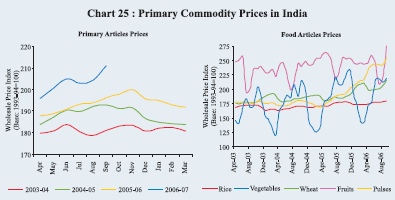
Prices of primary food articles led by wheat, pulses, fruits
and milk have posed upward pressures on headline inflation during 2006-07 (Chart
25). Wheat prices have remained firm on the back of low stocks and high international
prices. On a year-on-year basis, wheat prices have increased by 18 per cent
as on October 7, 2006. Prices of pulses also edged higher (43 per cent) from
last year’s level reflecting stagnant domestic production as well as higher
demand. Fruits and milk prices have increased by 9.3 per cent and 7.5 per cent,
respectively. Vegetable prices have increased by about 57 per cent over end-March
2006 (63 per cent increase during the corresponding period of the previous fiscal),
reflecting the seasonal hardening patterns. Overall, prices of primary articles
have increased
|
Table 30: Wholesale Price Inflation in India (year-on-year) |
| |
|
|
|
|
|
|
|
|
(Per cent) |
|
Commodity |
|
2005-06 |
|
2005-06 |
|
2006-07 P |
| |
|
|
|
(March 25) |
(Oct. 8) |
|
(Oct. 7) |
| |
|
|
Weight |
Inflation |
WC |
Inflation |
WC |
Inflation |
WC |
|
1 |
|
|
2 |
3 |
4 |
5 |
6 |
7 |
8 |
|
All Commodities |
100.0 |
4.1 |
100.0 |
4.9 100.0 |
5.2 |
100.0 |
|
1. |
Primary Articles |
22.0 |
5.4 |
28.3 |
3.6 |
16.5 |
7.5 |
32.0 |
| |
Food Articles |
15.4 |
6.6 |
24.2 |
4.9 |
15.6 |
8.6 |
25.8 |
| |
i. |
Rice |
2.4 |
2.7 |
1.4 |
4.8 |
2.2 |
1.2 |
0.5 |
| |
ii. |
Wheat |
1.4 |
12.9 |
4.3 |
1.4 |
0.4 |
18.0 |
4.5 |
| |
iii. |
Pulses |
0.6 |
33.2 |
4.4 |
5.5 |
0.6 |
42.9 |
4.8 |
| |
iv. |
Vegetables |
1.5 |
8.1 |
2.1 |
5.2 |
1.7 |
4.0 |
1.2 |
| |
v. |
Fruits |
1.5 |
-1.0 |
-0.5 |
7.3 |
2.7 |
9.3 |
3.3 |
| |
vi. |
Milk |
4.4 |
1.9 |
1.9 |
0.4 |
0.4 |
7.5 |
5.9 |
| |
vii. |
Eggs, Fish and Meat |
2.2 |
14.3 |
7.9 |
15.8 |
7.2 |
0.5 |
0.2 |
| |
Non-Food Articles |
6.1 |
-1.9 |
-2.7 |
-2.9 |
-3.6 |
2.5 |
2.8 |
| |
i. |
Raw Cotton |
1.4 |
-1.4 |
-0.4 |
-11.8 |
-2.8 |
9.3 |
1.8 |
| |
ii. |
Oilseeds |
2.7 |
-7.8 |
-4.5 |
-5.5 |
-2.9 |
-1.4 |
-0.7 |
| |
iii. |
Sugarcane |
1.3 |
0.7 |
0.3 |
0.6 |
0.2 |
0.7 |
0.2 |
| |
Minerals |
0.5 |
43.6 |
6.8 |
30.9 |
4.4 |
19.8 |
3.3 |
|
2. |
Fuel, Power, Light and Lubricants |
14.2 |
8.9 |
47.9 |
11.3 |
49.3 |
5.2 |
22.9 |
| |
i. |
Mineral Oils |
7.0 |
13.2 |
39.8 |
18.0 |
43.2 |
5.6 |
14.4 |
| |
ii. |
Electricity |
5.5 |
4.5 |
8.2 |
3.8 |
5.7 |
6.0 |
8.5 |
| |
iii. |
Coal Mining |
1.8 |
0.0 |
0.0 |
0.7 |
0.3 |
0.0 |
0.0 |
|
3. |
Manufactured Products |
63.8 |
1.7 |
23.2 |
3.0 |
34.6 |
4.2 |
45.0 |
| |
i. |
Food Products |
11.5 |
0.9 |
2.2 |
1.0 |
2.3 |
2.5 |
5.1 |
| |
|
of which: Sugar |
3.6 |
6.6 |
4.9 |
10.6 |
6.1 |
3.8 |
2.2 |
| |
|
Edible Oils |
2.8 |
-2.4 |
-1.3 |
-7.8 |
-3.7 |
5.3 |
2.1 |
| |
ii. |
Cotton Textiles |
4.2 |
1.1 |
1.0 |
-12.4 |
-9.8 |
6.5 |
4.1 |
| |
iii. |
Man Made Fibres |
4.4 |
-4.6 |
-2.5 |
-4.4 |
-2.1 |
4.1 |
1.6 |
| |
iv. |
Chemicals and Chemical Products |
11.9 |
3.6 |
10.2 |
3.8 |
8.9 |
2.2 |
4.9 |
| |
|
of which : Fertilisers |
3.7 |
0.3 |
0.2 |
3.1 |
2.1 |
0.9 |
0.5 |
| |
v. |
Basic Metals, Alloys and Metal Products |
8.3 |
-2.9 |
-6.7 |
8.2 |
15.3 |
6.0 |
11.0 |
| |
|
of which: Iron and Steel |
3.6 |
-7.5 |
-8.7 |
8.9 |
8.4 |
0.2 |
0.2 |
| |
vi. |
Non-Metallic Mineral Products |
2.5 |
8.6 |
4.7 |
8.4 |
3.6 |
12.6 |
5.3 |
| |
|
of which: Cement |
1.7 |
13.0 |
4.8 |
10.4 |
3.0 |
18.2 |
5.1 |
| |
vii. |
Machinery and Machine Tools |
8.4 |
3.9 |
6.1 |
5.8 |
7.4 |
3.9 |
4.8 |
| |
viii. |
Transport Equipment and Parts |
4.3 |
1.2 |
1.1 |
2.6 |
1.9 |
2.4 |
1.6 |
| |
Memo: |
|
|
|
|
|
|
|
| |
Food Items (Composite) |
26.9 |
4.2 |
26.5 |
3.3 |
17.8 |
6.2 |
30.9 |
| |
WPI Excluding Food |
73.1 |
4.0 |
73.5 |
5.4 |
82.2 |
4.8 |
69.1 |
| |
WPI Excluding Fuel |
85.8 |
2.7 |
52.1 |
3.1 |
50.7 |
5.1 |
77.1 |
|
WC : Weighted Contribution. |
|
|
|
|
|
|
|
by 9.6 per cent since end-March 2006 (7.5 per cent a year ago)
and, by 7.5 per cent on a y-o-y basis (3.6 per cent a year ago). Accordingly,
the contribution of primary articles to headline inflation increased to about
32 per cent as on October 7, 2006 from around 17 per cent a year ago. In order
to improve domestic supplies
so as to stabilise inflation expectations, the Government,
during June and August 2006, took fiscal measures such as exempting imports
of pulses and sugar from customs duty (till March 31, 2007 and September 30,
2006, respectively), allowing import of wheat (initially at a concessional rate
of 5 per cent customs duty and, effective September 2006, at zero duty till
end-December 2006), reduction in customs duty on palm oil (from 80-90 per cent
to 70-80 per cent) and restriction on exports of pulses.
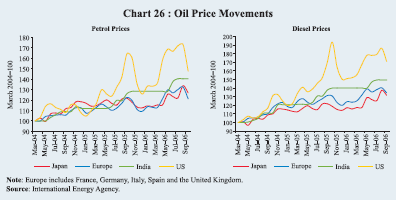
Fuel prices dominated the inflation outcome till end-August
2006, notwithstanding the incomplete pass-through. In view of sustained rise
in international crude oil prices, domestic petrol and diesel prices were increased
by about Rs. 4 (around nine per cent) and Rs.2 (around 6 per cent), respectively,
effective June 6, 2006. Apart from raising oil prices, the Government also announced
the following measures: i) reduction in customs duty on petrol and diesel to
7.5 per cent from the existing 10.0 per cent, and ii) issuance of oil bonds
worth Rs.28,000 crore (over and above Rs.11,500 crore issued during 2005-06)
to oil marketing companies to compensate for their under-recoveries in domestic
operations.
Fuel group inflation rose to a peak of 9.9 per cent, y-o-y,
on June 17, 2006 under the impact of the rise in domestic petrol and diesel
prices on June 6, 2006 (Chart 26). Subsequently, the fuel group’s inflation
rate, however, moderated to 3.3 per cent, y-o-y, as on September 16, 2006, mainly
due to the base effects; domestic prices of petrol and diesel, it may be recalled,
were increased by 6-7 per cent a year ago (September 7, 2005). Reduction in
domestic prices of freely-priced petroleum products such as naphtha and furnace
oil in September 2006 following the decline in international crude oil prices
also reduced fuel group
inflation. Accordingly, the y-o-y WPI inflation excluding the
fuel group in the week ended September 9, 2006 exceeded – after a gap of nearly
29 months – the headline inflation rate (see Chart 24). The upward revision
in electricity prices pushed fuel group’s inflation to 5.2 per cent during the
week ended October 7, 2006. The y-o-y inflation excluding the fuel group at
5.1 per cent as on October 7, 2006 was marginally lower than the headline rate.
In evaluating movements in fuel group inflation, it may be noted that the pass-through
of higher international oil prices has been restricted to petrol and diesel.
Domestic prices of liquefied petroleum gas (LPG) have remained unchanged since
November 2004 while kerosene prices have been unchanged since April 2002 on
grounds of social concerns.
Manufactured products inflation has remained relatively moderate
so far, although it has edged higher to 4.2 per cent, y-o-y, as on October 7,
2006 from 3.0 per cent a year ago. Competitive pressures, productivity gains
as well as strong corporate profitability have provided firms the flexibility
to absorb higher input prices into their profit margins. Furthermore, pre-emptive
monetary actions by anchoring inflation expectations have restrained the second
order effects of past increases in oil prices to manufactured products prices.
Manufactured products inflation was led by metals, textiles and cement. Non-ferrous
metal prices have moved in line with international trends (Chart 27). Illustratively,
domestic prices of copper and zinc have increased, y-o-y, by about 64 per cent
and 97 per cent, respectively, as on October 7, 2006. In contrast, iron and
steel prices have increased marginally by 0.2 per cent, y-o-y, as on October
7, 2006 as compared with an increase of 8.9 per cent a year ago; however, since
March 2006 the prices have increased sharply (14.2 per cent) in tandem
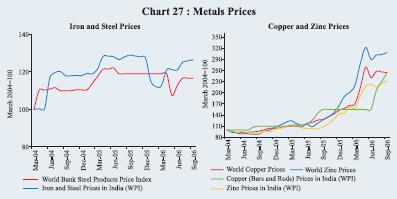
with international price movements. Domestic sugar prices have eased in recent
months in line with global trends.
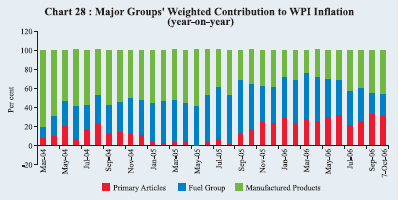
In brief, primary articles’ contribution to the overall y-o-y
inflation increased to 32 per cent (from 17 per cent a year ago) mainly due
to higher prices of wheat, pulses, milk and fruits (Chart 28). Manufactured
products group’s contribution was higher at 45 per cent (35 per cent), largely
on account of an increase in prices of metals, cement and textiles. The contribution
of fuel prices to the y-o-y headline inflation, on the other hand, fell to 23
per cent as on October 7, 2006 from 49 per cent a year ago.
|
Table 31: Consumer Price Inflation (CPI) in India (year-on-year) |
| |
|
|
|
|
|
|
|
|
(Per cent) |
|
Inflation |
March |
March |
|
March |
March |
June |
July |
August |
September |
|
Measure |
2003 |
2004 |
|
2005 |
2006 |
2006 |
2006 |
2006 |
2006 |
|
1 |
2 |
3 |
|
4 |
5 |
6 |
7 |
8 |
9 |
|
CPI-IW |
4.1 |
3.5 |
|
4.2 |
4.9 |
7.7 |
6.7 |
6.3 |
.. |
|
CPI- UNME |
3.8 |
3.4 |
|
4.0 |
5.0 |
6.5 |
5.7 |
6.1 |
6.6 |
|
CPI-AL |
4.9 |
2.5 |
|
2.4 |
5.3 |
7.2 |
6.3 |
6.5 |
7.3 |
|
CPI-RL |
4.8 |
2.5 |
|
2.4 |
5.3 |
7.2 |
5.9 |
6.2 |
7.0 |
|
Memo: |
|
|
|
|
|
|
|
|
|
|
WPI Inflation (end-Month) |
6.5 |
4.6 |
|
5.1 |
4.1 |
4.8 |
4.7 |
5.0 |
5.2 |
|
.. : Not available. IW : Industrial Workers UNME : Urban Non-Manual Employees
AL : Agricultural Labourers RL : Rural Labourers |
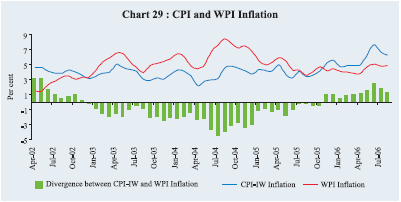
Consumer Price Inflation
Consumer price inflation has remained higher than the WPI inflation since November
2005, reflecting the higher order of increase in food prices as well as the
higher weight of food items in the CPI (Table 31 and Chart 29).
Disaggregated data for CPI-Industrial Workers (CPI-IW), available
up to August 2006, indicate that food group inflation increased from 3.1 per
cent in August 2005 (y-o-y) to 10.0 per cent in June 2006 before moderating
marginally to 8.3 per cent in August 2006 (y-o-y). This was largely the outcome
of higher prices of cereals and pulses which recorded increases of 10.7 per
cent and 18.5 per cent, respectively, in August 2006. Higher prices of meat,
fish and eggs, and vegetables and fruits also contributed to food group inflation.
Prices of fuel and
light increased by 8.6 per cent y-o-y in August 2006 as against
a decline of 6.6 per cent a year ago. On the other hand, housing inflation –
reflecting rents on housing – decelerated sharply from 11.7 per cent in August
2005 to 6.8 per cent in August 2006 (Table 32).
Asset Prices
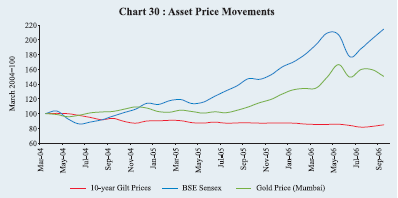
During the second quarter of 2006-07, domestic equity markets recovered most
of the losses recorded in the preceding quarter. Domestic stock markets which,
in consonance with international trends, had declined sharply during mid-May
and early June 2006, recovered during the quarter ended September 2006 on the
back of renewed buying interest, strong growth prospects and better corporate
results. As on October 23, 2006 domestic equity prices were around 12 per cent
higher over end-March 2006 levels (Chart 30).
Domestic gold prices mirrored movements in international prices. International
gold prices after rising to US $ 715 per ounce on May 12, 2006
|
Table 32: CPI for Industrial Workers- Major Groups (Base: 2001=100) |
| |
|
|
|
|
|
|
|
|
(Per cent) |
| |
|
|
|
Year-on-Year Variation |
| |
|
|
|
|
2005 |
2006 |
| |
|
|
|
Weight |
August |
March |
June |
July |
August |
|
1 |
|
|
|
2 |
3 |
4 |
5 |
6 |
7 |
|
General Index |
100.0 |
3.4 |
4.9 |
7.7 |
6.7 |
6.3 |
| |
I. |
Food Group |
46.2 |
3.1 |
4.9 |
10.0 |
7.6 |
8.3 |
| |
|
i) |
Cereals and Products |
13.5 |
2.2 |
8.3 |
10.4 |
9.9 |
10.7 |
| |
|
ii) |
Pulses and Products |
2.9 |
6.4 |
20.3 |
26.9 |
21.4 |
18.5 |
| |
|
iii) |
Oils and Fats |
3.2 |
-4.1 |
-2.9 |
1.6 |
1.2 |
3.2 |
| |
|
iv) |
Meat, Fish and Eggs |
4.0 |
5.9 |
3.5 |
12.4 |
11.5 |
10.4 |
| |
|
v) |
Milk and Products |
7.3 |
1.3 |
2.4 |
4.0 |
4.0 |
4.0 |
| |
|
vi) |
Condiments and Spices |
2.6 |
2.2 |
0.7 |
5.3 |
4.7 |
4.6 |
| |
|
vii) |
Vegetables and Fruits |
6.1 |
2.0 |
3.0 |
15.9 |
3.4 |
10.1 |
| |
|
viii) |
Other Food |
6.7 |
6.2 |
4.3 |
5.2 |
4.6 |
3.5 |
| |
II. |
Pan, Supari, Tobacco and Intoxicants |
2.3 |
2.4 |
3.1 |
3.7 |
3.7 |
3.8 |
| |
III.Fuel and Light |
6.4 |
-6.6 |
-2.9 |
8.7 |
8.7 |
8.6 |
| |
IV. |
Housing |
15.3 |
11.7 |
6.6 |
6.6 |
6.8 |
6.8 |
| |
V. |
Clothing, Bedding and Footwear |
6.6 |
2.6 |
3.0 |
2.8 |
2.8 |
2.8 |
| |
VI. |
Miscellaneous Group (Services) |
23.3 |
4.4 |
4.6 |
4.7 |
4.9 |
5.1 |
| |
|
i) |
Medical Care |
4.6 |
2.8 |
5.3 |
6.8 |
6.7 |
6.8 |
| |
|
ii) |
Education, Recreation and Amusement |
6.2 |
6.5 |
3.3 |
2.3 |
2.0 |
2.5 |
| |
|
iii) |
Transport and Communication |
4.9 |
8.2 |
7.3 |
8.9 |
7.8 |
7.9 |
| |
|
iv) |
Personal Care and Effects |
4.2 |
2.8 |
3.1 |
3.4 |
3.6 |
3.6 |
| |
|
v) |
Other Miscellaneous Items |
3.4 |
2.7 |
3.1 |
4.1 |
4.7 |
4.5 |
|
Note : The variations are worked out by linking the new series (Base: 2001=100) with the old series (Base: 1982=100) with the relevant conversion factors. |
witnessed sharp correction and fell to US $ 559 as on June
14, 2006 in consonance with the trends in various commodities in the international
market. Prices initially recovered to US $ 664 per ounce as on July 14, 2006
but again fell to below US $ 600 per ounce in the second week of September 2006
as headline inflation in major economies eased in tandem with softening of international
crude oil prices. Domestic gold prices, after crossing Rs.10,000 per 10 grams
in mid-May 2006, fell to about Rs.8,470 per 10 grams on June 14, 2006. Prices
recovered to Rs.10,070 per 10 grams as on July 17, 2006 but have since then
declined and were Rs. 8,842 per 10 grams as on October 20, 2006. Gilt prices
fell and yields rose up to mid-July 2006 on the back of increase in yields in
major economies, concerns over domestic inflation in view of higher oil prices
and the hike in the reverse repo rate. Gilt yields have, however, eased since
then reflecting softening of international crude oil prices and easing of yields
in the US market.
|