Tables
1, 2, 12, 236 & 237 GDP Gross Domestic Product NDP Net Domestic
Product
GNP Gross National Product NNP Net National Product
GDCF Gross
Domestic Capital Formation NDCF Net Domestic Capital Formation
GDS Gross
Domestic Savings NDS Net Domestic Savings GFCF Gross Fixed Capital Formation PFCE
Private Final Consumption Expenditure GFCE Government Final Consumption Expenditure
Table 11
The difference between financial assets
and financial liabilities, i.e., financial savings, may not tally with
the financial savings of the household sector presented in Table No. 10 due to
the differences in reporting periods.
Table 14
(i) The public sector comprises all Governmental agencies: Central, State, Quasi-Government
(both Central and State) and local bodies.
(ii) The private sector comprises
all establishments (under the organised sector) employing 10 or more persons.
(iii) The employment data for public and private sectors from 1970-71 to 1980-81
pertain to end-December.
(iv) Data on number of persons on live register also
include the cumulative number of applicants who remain on the registers of employment
exchanges as needing employment assistance at the end of the year.
Table
15
Base : The index numbers of agricultural production
are computed on the basis of weights. The weight of a commodity for the production
index is taken as the average production of the commodity in the base year, multiplied
by the national average price of the commodity during the base year as obtained
from the National Accounts Statistics. The average of triennium is taken to fix
the base production by eliminating the cyclical fluctuations and evaluate the
production with the same price for all States in view of wide variations observed
in State prices.
The Index numbers of agricultural production covers 46 crops
under two main groups and eight sub-groups.
Tables 15, 21 &
22
Yield : The average production per hectare
of any crop/class of crops attained in any given area (such as State) in a year/
cropping season. This is usually given in kilograms per hectare as the unit.
Tables 16, 18, 20, 22 & 23
The eleven oilseeds
comprise of groundnut, castorseed, sesamum, nigerseed, rapeseed and mustard, linseed,
safflower, sunflower, soyabean, cottonseed and coconut. Output of cottonseed and
coconut is not included in the total.
Tables 17 & 18
For details on crops and groups, please see Area, Production and Yield of
Principal Crops in India and Agricultural Statistics at a Glance, Ministry of
Agriculture, Government of India. Table
24
High yielding varieties of seeds : The varieties
of seeds have been developed scientifically with the help of genetic engineering
over a period of time for most of the cereals and other crops. These have higher
resistance to pests, diseases and moisture stress. The cultivation of these seeds
is usually associated with higher levels of inputs such as chemical fertilisers
and pesticides. Table 27
Public
Distribution System (PDS) : Under this scheme, various important items of
consumption are distributed to ration card holders at subsidised rates. The commodities
that are distributed under PDS include inter alia, rice, wheat, sugar,
edible oil and kerosene oil. The PDS is perceived as an essential component
of India's food security policy. A new scheme was implemented, with effect from
June 1, 1992, under Revamped Public Distribution System (RPDS) in order to improve
PDS's reach to the consumers living in areas of relative economic disadvantage.
Subsequently, in 1997, the Government of India decided to convert the universal
PDS into a targeted PDS (TPDS) and dual issue pricing was introduced for rice
and wheat for households above and below the poverty line level (APL and BPL).
Procurement : The act of purchasing foodgrains (by Central and State
Government agencies as well as the Food Corporation of India (FCI)) from farmers
at Minimum Support Price (MSP) so as to provide remunerative prices to farmers
as also for distributing under various schemes of the Government, including TPDS,
etc.
Minimum Support Price (MSP) : The price at which
the Government assures to purchase foodgrains from farmers to provide remunerative
prices to the producers. The MSPs are declared before each procurement season
(Kharif marketing season for rice covering the period October to September,
and Rabi marketing season for wheat covering the period April to March),
and are generally based on the recommendations of the Commission of Agricultural
Costs and Prices.
Off-take : The quantity of foodgrains sold
and distributed under various schemes of the Government including TPDS, open market
sales and other welfare schemes.
Open Market Sale (OMS) : The
sale of foodgrains by FCI to private traders and millers for exports as well as
domestic consumption.
Other Welfare Schemes (OWS) : Various Central
Government schemes other than TPDS, under which foodgrains are distributed either
freely or at subsidised rates. Various schemes covered under OWS include Antyodaya
Anna Yojana, Food for Work Programme, Nutrition Programme, Relief Work, Flood
Relief, Mid-Day Meal, etc.
Stocks : The Stocks of foodgrains
that are available with the public sector agencies including FCI, Central Warehousing
Corporation and State Warehousing Corporations.
Buffer Stocks
: The amount of stocks that are maintained with the public sector agencies to
meet the food security requirements of the country. The buffer stocks are maintained
in accordance with the buffer stock norms: those quantities of foodgrains, that
are deemed to be sufficient to meet the food security requirement. These norms
have been fixed for four quarters of the year, i.e., 1st April, 1st July, 1st
October and 1st January, based on the production and consumption requirements
of foodgrains during the respective quarters.
Tables 28, 29,
30, 31, 179, 180, 181, 239, 240 & 241
With a view to ensuring
stability in the monthly series of Index of Industrial Production (IIP) and remove
the effect of change of deflators from the growth rates, the whole series of 2-digit
level as well as use-based indices from April 1994 to May 2000 have been revised
in July 2000 consequent to the shift in the base of the Wholesale Price Index
(WPI) series from 1981-82 to 1993-94. On account of the above one-time revision,
the growth rates under certain industry groups/use-based categories have undergone
some changes. As most of the new deflators have been used in Industry Group 38,
i.e., 'Other Manufacturing Industries', the effect of one-time revision
in the indices in this industry group is more prominent. Another
revision of IIP was made in January 2001 for the entire period April 1998 to November
2000 due to several reasons, such as: (i) the need for exclusion from the IIP
commodity basket, few items, such as radio receivers, photo sensitised paper,
chasis for heavy commercial vehicle (HCV) and engines, as they are highly prone
to month to month variations, and (ii) availability of revised data on monthly
indices of 'mining sector' from the Indian Bureau of Mines (IBM), Nagpur, for
the period April 1994 onwards. The IBM had revised the index by incorporating
the data on production of natural gas by private sector and joint venture companies
and the internal utilisation part of the output of natural gas by public sector.
Tables 35 & 60
The small scale industries (SSI)
sector covers a wide spectrum of industries categorised under (a) small scale
industrial undertakings, (b) Ancillary Industrial Undertakings (ANC), (c) Export
Oriented Units (EOU), (d) Tiny Enterprises (TINY), (e) Small Scale Service Enterprises
(SSSEs), (f) Small Scale Service Business (Industry Related) Enterprises (SSSBEs),
(g) artisans, village and cottage industries, and (h) women entrepreneurs' enterprises,
i.e., a small scale unit where one or more women entrepreneurs have not
less than 51 per cent financial holding.
UPPER LIMIT OF ORIGINAL
VALUE OF PLANT AND MACHINERY | (Rupees
lakh) | Year | SSI | ANC | TINY | EOU | SSSEs | SSSBEs | Remarks
| 1 | 2 | 3 | 4 | | 5 | 6 | 7 | 8
| 1970 | 7.5 | 10 | – | | – | – | – | –
| 1975 | 10 | 15 | – | | – | – | – | –
| 1977 | 10 | 15 | 1
* | – | – | – | *Units
located in rural areas/towns with | | | | | | | | | maximum
population of 50,000 as per 1971 | | | | | | | | | Census.
| 1980 | 20 | 25 | 2
* | – | – | – | -do-
| 1985 | 35 | 45 | 2 | | – | 2
# | – | #
Units located in rural areas/towns with | | | | | | | | | maximum
population of up to 5 lakhs as per | | | | | | | | | 1981Census.
| 1991 | 60 | 75 | 5 | @ | 75 | ** | 5 | @
The location-specific condition was | | | | | | | | | withdrawn.
| | | | | | | | | **
The SSSEs classification was suspended in | | | | | | | | | 1990-91
and replaced by the term SSSBEs. | 1997 | 300 | 300 | 25 | | 300 | – | 5 | –
| 1999 | 100 | 100 | 25 | Same
as SSI | – | 5 | –
| 2000 | 100 | 100 | 25 | Same
as SSI | – | 10 | –
| The definition of small scale
industries sector is broadly based on the criterion of original value of plant
and machinery which is revised periodically. A small scale industry cannot be
owned, controlled or be subsidiary of another industrial undertaking.
Tables 39, 182, 246 & 253
Pursuant to the recommendations
of the Working Group for the Revision of Index Numbers of the Wholesale Prices
in India (Chairman: Prof. S.R. Hashim), a revised series of wholesale price index
with base year 1993-94 was introduced. In the revised series, the three major
groups, viz., primary articles, fuel, power, light and lubricants and
manufactured products have been accorded the weightages of 22.02 per cent, 14.23
per cent and 63.75 per cent, respectively.
Table 42
(i) Rupee coins and small coins include ten-rupee coins issued since October
1969, two rupee-coins issued since November 1982 and five rupee coins issued since
November 1985.
(ii) ‘Deposits - Others’ include deposits
from foreign central banks, multilateral institutions, financial institutions,
RBI employees’ provident fund deposits, surplus earmarked pending transfer
to the Government and sundry deposits.
(iii) Other liabilities include internal
reserves and provisions of the Reserve Bank such as Exchange Equalisation Account
(EEA), Currency and Gold Revaluation Account (CGRA), Contingency Reserve and Asset
Development Reserve. The reserves, viz., Contingency Reserve, Asset Development
Reserve, CGRA and EEA reflected in ‘Other Liabilities’ are in addition
to the ‘Reserve Fund’ of Rs.6,500 crore held by the Reserve Bank as
a distinct balance sheet head. Gains/losses on valuation of foreign currency assets
and gold due to movements in the exchange rates and/or prices of gold are not
taken to Profit and Loss Account but instead booked under a balance sheet head
named as CGRA. The balance represents accumulated net gain on valuation of foreign
currency assets and gold. CGRA was earlier known as Exchange Fluctuation Reserve
(EFR). The balance in EEA represents provision made for exchange losses
arising out of forward commitments. Contingency Reserve represents the amount
set aside on a year-to-year basis for meeting unexpected and unforeseen contingencies
including depreciation in value of securities, exchange guarantees and risks arising
out of monetary/ exchange rate policy compulsions. In order to meet the internal
capital expenditure and make investments in subsidiaries and associate institutions,
a further specified sum is provided and credited to the Asset Development Reserve.
(iv) Consequent to the establishment of NABARD, data from 1982-83 are not comparable
with those of the earlier periods. National Rural Credit (Stabilisation) Fund
and National Rural Credit (LTO) Fund were earlier designated as National Agricultural
Credit (Stabilisation) Fund and National Agricultural Credit (LTO) Fund, respectively,
and were maintained by the Reserve Bank of India prior to the formation of NABARD
on July 12, 1982.
(v) Data on loans and advances to ARDC/NABARD since 1980-81
relate to NABARD.
(vi) Consequent to the establishment of NABARD, the data
on loans and advances to State co-operative banks from the year 1982-83 are not
comparable with those of the earlier periods.
(vii) Following the announcement
in the Union Budget for 1992-93, it was decided to discontinue the practice of
appropriating amounts from the Reserve Bank of India for advancing loans to industrial
and agricultural financial institutions, before transferring the surplus profits
of the Reserve Bank to the Government of India. Therefore, no allocation was made
to IDBI, EXIM Bank, IIBI, and SIDBI out of NIC (LTO) Fund and to NHB out of NHC
(LTO) Fund in 1992-93. Thereafter, the Reserve Bank has been making only token
contributions to these funds. It was decided in 1997-98 to transfer the unutilised
balance in the NIC (LTO) Fund arising from repayments to Contingency Reserve on
a year-to-year basis.
Furthermore, loans and advances granted out of NIC (LTO)
Fund by the Bank have been transferred on March 30, 2002 to the Government of
India.
(viii) Loans and advances to State Governments also include temporary
overdrafts to State Governments.
(ix) Balances held abroad include cash, short-term
securities and fixed deposits.
(x) Data may not add up due to rounding-off. Tables
43 to 45 & 185, 186, 188 to 191
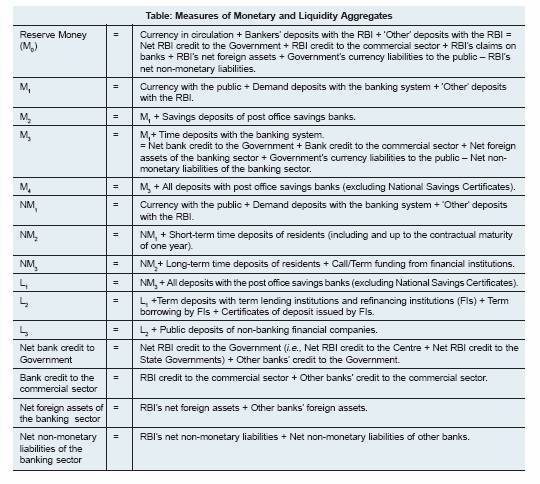
(i) Key monetary and liquidity
measures compiled in India and their definitions are set out in the following
Table.
(ii) The monthly data relate to the last Friday of
the month for the period 1950-51 to 1984-85 and for the subsequent period these
pertain to the last reporting Friday of the month, except for March in which case
they incorporate data relating to a) the Reserve Bank as on March 31, and
b) scheduled commercial banks as on the last reporting Friday (last Friday prior
to March 1985) of the year.
(iii) Banks include commercial and co-operative
banks. The coverage of co-operative banks has increased over time. As regards
co-operative banks, data upto February 1970 include State co-operative banks,
while that from March 1970 onwards are also inclusive of central co-operative
banks and primary co-operative banks.
(iv) The details of the compilation
of the new monetary/banking aggregates are available in the Report of the Working
Group on c of Compilation (WGMS) (Chairman: Dr. Y. V. Reddy), June 1998.
are used to distinguish the The acronyms NM1, NM2 and NM3 new monetary aggregates
as proposed by the WGMS from the existing monetary aggregates.
(v) Monetary
data have been revised since April 1992 in line with the new accounting standards
and consistent with the methodology suggested by the WGMS. The revision
is in respect of pension and provident funds with commercial banks which are classified
as other demand and time liabilities and includes those banks which have reported
such changes so far.
(vi) There was a change in the treatment of apportionment
of savings deposits into its two components - demand and time in March 1978. Savings
bank accounts are now bifurcated into demand and time portions depending on whether
interest is actually paid on such deposits vide circular DBOD. No. Ref. BC. 127/C-96
(Ret)-77 dated October 15,1977.
Banks are required to report (vide circular
DBOD. No. Ref. BC.142/09.16.001/97-98 dated November 19, 1997) such classification
on the basis of the position as at close of business at September 30 and March
31 instead of as at end-June and as at end-December as done hitherto.
(vii)
Available data on demand deposits of scheduled banks for the period prior to November
1960 were inclusive of inter-bank deposits. Inter-bank deposits are, however,
not a part of money supply. As separate data on inter-bank deposits were not available
for the period prior to November 1960, estimates of inter-bank deposits were derived
based on information available in the corresponding data on demand deposits obtained
from Form XIII (see pages 1215-1220 of the RBI Bulletin, August 1962 for detailed
estimation methodology). These estimates of inter-bank deposits have been deducted
from demand deposits for the period up to November 1960.
(viii) Scheduled
commercial banks’ time deposits take into account Rs.17,945 crore on account
of proceeds arising from Resurgent India Bonds (RIBs) on August 28,1998; Rs.25,662
crore on account of proceeds from India Millennium Deposits (IMDs) on November
17, 2000; the redemption of RIBs of Rs.22,693 crore on October 1, 2003; and the
redemption of IMDs of Rs. 31,959 crore on December 29, 2005.
(ix) NM2 and
NM3 are based on the residency concept and hence do not directly reckon non-resident
foreign currency repatriable fixed deposits in the form of FCNR(B) deposits, Resurgent
India Bonds (RIBs) and India Millennium Deposits (IMDs).
(x) On the establishment
of the National Bank for Agricultural and Rural Development (NABARD) on July 12,
1982, certain assets and liabilities of the Reserve Bank were transferred to NABARD,
necessitating some re-classification of aggregates on the sources side of money
stock since that date.
(xi) The Reserve Bank’s credit to the commercial
sector represents investments in bonds/shares of financial institutions, loans
to them and holdings of internal bills purchased and discounted. In case of the
new monetary aggregates, the RBI’s refinance to the NABARD, which was earlier
part of RBI’s claims on banks, has been classified as part of RBI credit
to commercial sector.
(xii) The Reserve Bank’s net foreign exchange
assets take into account the impact of appreciation in the value of gold following
its revaluation close to international market price effective October 17, 1990.
Such appreciation has a corresponding effect on Reserve Bank’s net non-monetary
liabilities.
(xiii) In the new monetary aggregate NM3, capital account consists
of paid-up capital and reserves. 'Other Items (net)' is the residual balancing
the components and sources of the monetary and banking accounts and includes other
demand and time liabilities, net inter-bank liabilities etc. as applicable.
Tables 47, 187, 219, 243 & 244
(i) Banking
data pertain to scheduled banks from 1950-51 to 1965-66 and to scheduled commercial
banks (SCBs) from 1966-67 onwards.
(ii) The monthly data relate to the last
Friday of the month for the period 1950-51 to 1984-85 and for the subsequent period
these pertain to the last reporting Friday of the month.
(iii) Demand deposits
include all liabilities which are payable on demand and include current deposits,
demand liabilities portion of savings bank deposits, margins held against letters
of credit/guarantees, balances in overdue fixed deposits, cash certificates and
cumulative/recurring deposits, outstanding Telegraphic Transfers (TTs), Mail Transfer
(MTs), Demand Drafts (DDs), unclaimed deposits, credit balances in the Cash Credit
account and deposits held as security for advances which are payable on demand.
(iv) Time deposits are those which are payable otherwise than on demand and they
include fixed deposits, cash certificates, cumulative and recurring deposits,
time liabilities portion of savings bank deposits, staff security deposits, margin
held against letters of credit if not payable on demand, deposits held as securities
for advances which are not payable on demand, and gold deposits.
(v) Other
Demand and Time Liabilities (ODTL) include interest accrued on deposits, bills
payable, unpaid dividends, suspense account balances representing amounts due
to other banks or public, net credit balances in branch adjustment account, any
amounts due to the “Banking System” which are not in the nature of
deposits or borrowing. Such liabilities may arise due to items like collection
of bills on behalf of other banks and interest due to other banks.
(vi) Assets
with banking system include balances with banks in current accounts, balances
with banks and notified financial institutions in other accounts, funds made available
to the banking system by way of loans or deposits repayable at call or short notice
of a fortnight or less and loans other than money at call and short notice made
available to the banking system.
(vii) There was a change in the treatment
of apportionment of savings deposits into its two components - demand and time
in March 1978. Savings bank accounts are now bifurcated into demand and time portions
depending on whether interest is actually paid on such deposits.
(viii) Since
November 25, 1960, the definition of bank credit conforms to the present definition
of bank credit, namely, the sum of (a) loans, cash credit and overdrafts, and
(b) inland and foreign bills - purchased and discounted. Data for 1950-51 are
inclusive of ‘money at call and short notice’ and ‘due from
banks’ but exclude ‘foreign bills purchased and discounted’.
The series for 1952-53 to 1953-54 includes ‘due from banks’ but excludes
‘foreign bills purchased and discounted’. The series for 1954-55 to
1960-61 (up to October 1960) is inclusive of ‘due from banks’. (For
details, see the article ‘’Major Banking Aggregates : 1950-51 to 1997-98'’
RBI Bulletin, November 1998).
Tables 48 & 49
(i) Data are provisional and relate to select scheduled commercial banks
(47 banks for 2003-04 and 52 banks for 2004-05 and 2005-06) which account for
about 90 per cent of the bank credit extended by all scheduled commercial banks.
(ii) Non-food gross bank credit data include bills rediscounted with RBI, IDBI,
EXIM Bank, other approved financial institutions and inter-bank participations.
Net bank credit data are exclusive of bills rediscounted with RBI, IDBI, EXIM
Bank and other approved financial institutions.
Table 51
The data on scheduled commercial banks - maturity pattern of term deposits exclude
inter-bank deposits. For the year 1990, the data cover only about 72 per cent
of the total term deposits.
Table 53
Short-term
finance outstanding to IFCI is made under Section 17(4B)(b) of the Reserve Bank
of India Act, 1934.
Short-term finance outstanding to SFCs is made under Section
17(4A)/17(BB)(b) of the Reserve Bank of India Act, 1934. SFCs also include Tamil
Nadu Industrial Investment Corporation Ltd.
Short-term finance outstanding
to ICICI is made under Section 17(4BB)(b) of the Reserve Bank of India Act, 1934.
Short-term finance outstanding to IDBI is made under Section 17(4H)(b) of the
Reserve Bank of India Act, 1934.
Short-term finance outstanding to DFHI was
made under Section 17(4BB)(a) and 17(4.1) of the Reserve Bank of India Act, 1934.
Refinance facility under Section 17(4.1) of the Reserve Bank of India Act, 1934
was withdrawn with effect from August 25, 1994 and that under Section 17(4BB)(a)
was withdrawn effective from June 4, 1996.
Consequent to coming into force
of the Public Financial Institutions Laws (Amendment) Act, 1975, shareholding
of the Reserve Bank of India in all the SFCs and IDBI have been transferred to
and vested with IDBI and Government of India, respectively, from February 16,
1976.
Long-term finance to Export-Import Bank of India is given out of NIC
(LTO) Fund for the purpose of any business of the Exim Bank.
Long-term finance
to Industrial Investment Bank of India (previously known as Industrial Reconstruction
Bank of India) is given out of NIC (LTO) Fund for the purpose of any business
of IIBI.
Long-term finance to National Housing Bank (NHB) is given out of
National Housing Credit (LTO) Fund for the purpose of any business of NHB, under
Section 46C(2)(c) of RBI Act, 1934.
Long-term finance to Small Industries
Development Bank of India (SIDBI) is given out of NIC (LTO) Fund for any of the
eligible purposes stipulated in Section 46C(2)(c) of RBI Act, 1934.
Consequent
on the announcement in the Union Budget for 1992-93, it has been decided to discontinue
the practice of appropriating amounts from the Reserve Bank of India for advancing
loans to industrial and agricultural financial institutions, before transferring
the surplus profits of the Bank to the Government of India. Accordingly, the Reserve
Bank has been making only token contributions to these funds, thereafter. Further,
loans and advances granted out of NIC (LTO) Fund by the Bank have been transferred
on March 30, 2002 to the Government of India.
Tables 54, 55 &
56
Direct Institutional Credit for Agriculture : Loans
advanced to agriculture by institutions such as co-operatives, scheduled commercial
banks, regional rural banks and State Governments. These loans are issued directly
to the beneficiary/borrower by the concerned institutions.
Table
57
Indirect Institutional Credit for Agriculture :
Comprise loans advanced for agriculture and allied activities to promote agricultural
productivity or increase agricultural income. These loans are advanced by such
institutions as co-operatives, scheduled commercial banks, regional rural banks
and Rural Electrification Corporation Ltd. These loans are normally routed
through some other agency/conduit/tier.
Table 61
Total direct finance includes direct finance (short-term, medium-term and
long-term) to farmers for agricultural operations and other types of direct finance
to farmers. Other types of indirect finance include advances to State-supported
corporations/ agencies for on-lending to weaker sections in agriculture (i.e.,
small and marginal farmers and those engaged in allied activities with limits
up to Rs.10,000).
Table 65
Rural, semi-urban,
urban and metropolitan centres comprise of places having population up to 9,999;
10,000 to 99,999; 1,00,000 to 9,99,999 and 10,00,000 & above, respectively.
Population group-wise classification of banked centres is based on 1961 Census
for the year 1969, 1971 Census for the years 1972 to 1983, 1981 Census for the
years 1984 to 1994 and 1991 Census for the years 1995 to 2005 and 2001 Census
for the year 2006.
The number of bank offices excludes administrative offices.
The data represent number of offices of all scheduled commercial banks.
Data
relate to last Friday of June for the years 1969 and 1973 to 1989 and end-March
for the years from 1990 to 2006. Data for 1972 relate to last Friday of December.
Table 66
Government securities include treasury
bills and treasury deposit receipts for the period 1970-71 to 1979-80.
As
the data relate only to areas to which the Act is extended, the total liabilities
do not agree with the total assets.
Data relate to the last Friday of March
except for some years including 1983, 1995-99, 2001-03 for which data relate to
March 31; 1989-1993, for which data relate to the last reporting Friday of March
and 1994, for which data relate to February 25. Table
68
Aggregate deposits represent total of demand and time deposits
from 'Others'. Investment in Government securities at book value; include treasury
bills and treasury deposit-receipts, treasury saving deposit certificates and
postal obligations. Bank credit represents total of loans, cash-credits and overdrafts
and bills purchased and discounted.
Table 73
The data cover the number and amount of cheques, drafts, bills, interest warrants,
payment orders, etc., which pass through the clearing houses, including
the documents returned unpaid.
Data do not cover cheques encashed over the
counter, outstation cheques collected directly without passing through the clearing
houses and transfer transactions.
The data include both high value clearing
and MICR clearing.
Tables 74, 192 & 235
(i) Scheduled commercial banks, co-operative banks and primary dealers are permitted
to both borrow and lend in call/ notice money market. The extent of coverage has
improved over the years as indicated below :
Period | Extent
of Coverage | Since
August 6, 2005 | Scheduled commercial banks,
co-operative banks and primary dealers. | October
5, 2002-August 5, 2005 | Scheduled commercial
banks, co-operative banks, primary dealers, financial institutions, mutual funds
and insurance companies. | May
2001 to October 5, 2002 | Scheduled commercial
banks, primary dealers, financial institutions, mutual
funds and insurance
companies (i.e., without co-operative banks). | 1998-99
to May 5, 2001 | Scheduled commercial banks,
primary dealers and select Fls. | Up
to 1997-98 | Select scheduled commercial
banks at Mumbai only (Data upto 1997-98 were also published in Volume II of the
Report on Currency and Finance). | ii)
Deposit rates were based on Inter-Bank Agreement up to September 1964 and on the
Reserve Bank's directives thereafter.
iii) Effective April 22, 1992,
a single prescription of 'not exceeding 13.0 per cent per annum' was prescribed
for 46 days to 3 years and above. The ceiling rate was revised from time to time.
Effective October 1, 1995, the deposit rates over 2 years were freed. Subsequently,
effective July 2, 1996, minimum maturity period was reduced to 30 days from 46
days and the deposit rates over 1 year were freed. Between April 16, 1997 and
October 21, 1997, the ceiling for interest rate on term deposit for 30 days and
up to 1 year was 'not exceeding Bank Rate minus two percentage points'. Effective
October 22, 1997, the ceiling was removed and banks were given the freedom to
determine their own interest rates on term deposits of 30 days and over.
The stipulation of a minimum maturity period of term deposits was reduced to 15
days effective April 29, 1998, reduced to 7 days effective April 19, 2001 for
wholesale deposit of Rs.15 lakh and above and further reduced to 7 days effective
November 1, 2004 for retail domestic term deposits (under Rs. 15 lakh).
iv) Relates to State Bank's prime lending rate, which is the benchmark interest
rate for the various categories and classes of advances granted by the bank.
v) The data relate to all commercial banks including SBI until 1993-94. In
the revised interest rates structure which became effective March 2, 1981, no
general minimum lending rate was fixed but a broad framework of interest rates
was provided with fixed rates on certain types of advances and ceiling rate on
other types of advances. Wherever ceiling rates were prescribed, the rates of
interest fixed for the preceding advance would serve as floor rate for advances
in that category. Effective September 22, 1990, a new structure of lending rates
of scheduled commercial banks linking interest rate to the size of the loan (for
loans over two lakh) was introduced and, for food procurement, banks were advised
to follow the same minimum rate as far as possible. The six slabs of credit size
were reduced to four effective April 22, 1992 and then to three effective April
8, 1993.
vi) Effective October 18, 1994, the lending rates were deregulated
except those for the credit limit up to Rs. 2 lakh. For credit limits of over
Rs.2 lakh, the prescription of minimum lending rates was abolished and the banks
were given freedom to fix a lending rate for such limits. The banks were required
to obtain the approval of their respective Boards for the prime lending rate which
would be the minimum rate charged by the banks for credit limits over Rs.2 lakh. Effective
April 29, 1998, it has been stipulated that the lending rates for credit limits
of Rs. 2 lakh and below should not exceed the prime lending rate. Effective
April 19, 2001, PLR has been converted to a benchmark rate for banks rather
than treating it as the minimum rate chargeable to the borrowers. Banks are now
allowed to offer loans above Rs.2 lakh at or below PLR rates to exporters and
other creditworthy borrowers on the lines of a transparent and objective policy
approved by their Board. Following the announcement in the Monetary and Credit
Policy in April 2003 and operational guidelines issued by Indian Banks' Association
in November 2003, banks switched over to the new system of benchmark PLR
(BPLR) in the year 2004. vii) IRBI has been reconstituted as Industrial
Investment Bank of India Ltd. (IIBI) with effect from March 27, 1997.
viii) Lending rate charged to small-scale industries. ix) Dividend as
percentage of weighted average sale price during the year worked out with weights
proportional to the number of units sold at different prices. x) Redemption
yields are based on BSE quotations upto 1994-95 and from 1995-96 onwards, on transactions
in the SGL account. Tables 77 to 79 Data also
include amounts mobilised through existing open-ended schemes (sales less
purchases). Data do not include amounts mobilised by off-shore funds.
Table 77 1. All schemes of Bank of
India Mutual Fund have been transferred to Principal Mutual Fund. 2.
All schemes of PNB Mutual Fund have been transferred to Principal Mutual Fund.
3. All schemes of GIC Mutual Fund have been transferred to Canbank
Mutual Fund. 4. All schemes of IDBI Mutual Fund have been
transferred to Principal Mutual Fund. Table 79
1. Kothari Pioneer was renamed as Pioneer ITI w.e.f.
August 6, 2001. 2. HB Mutual Fund was merged with Taurus
Mutual Fund w.e.f. February 25,1999. 3. ITC Classic
Threadneedle has migrated to Zurich India Mutual Fund w.e.f. December
15,1999. 4. First India Mutual Fund was renamed as Sahara
Mutual Fund w.e.f. March 19, 2004. 5. Zurich India
Mutual Fund has migrated to HDFC Mutual Fund w.e.f. June 19, 2003.
6. ANZ Grindlays Mutual Fund was renamed as Standard Chartered
Mutual Fund w.e.f. March 2001. 7. The IDBI Principal
Mutual Fund was renamed as Principal Mutual Fund (Pvt.) Ltd. w.e.f. June
23, 2003. All schemes of the PNB Mutual Fund were taken over by Principal
Mutual Fund w.e.f. April 30, 2005. 8. All schemes
of Alliance Capital Mutual Fund have migrated to Birla Sun Life Mutual Fund w.e.f.
September 2005. 9. All schemes of Sun F&C
Mutual Fund have been transferred to Principal Mutual Fund w.e.f. May
14, 2004. 10. All schemes of IL&FS Mutual Fund have been transferred to
UTI Mutual Fund w.e.f. July 5, 2004. Table 88
Data on disbursements relate to loans drawn from and debentures subscribed
by NABARD, excluding short-term disbursement. Data relate to the position
as at the end of each year on a cumulative basis, suitably adjusted on account
of schemes withdrawn/replaced subsequently. NABARD has switched over to the accounting
year April-March from the year 1988-89. Table 91
The data on insured deposits are inclusive of commercial banks, co-operative
banks and regional rural banks. Number of fully protected accounts represent
number of accounts with balances not exceeding Rs.10,000 till June 30, 1976, Rs.30,000
till April 30,1993 and Rs.1,00,000 with effect from May 1, 1993. Total amount
of insured deposits represent deposits upto Rs. 30,000 till April 30, 1993
and Rs.1,00,000 with effect from May 1, 1993 Assessable deposits mean the entire
amount of deposits including portions which are not provided insurance cover. Table
92
Following the modification in the terms and conditions of
the Credit Guarantee Scheme in April 1995, number of banks participating in this
scheme gradually started declining. Since 2003-04, no bank is participating in
this scheme. The corporation is, therefore, not operating these schemes now.
Table 95
Data on liabilities and assets of DICGC
(General Fund) relate to end-December upto 1989 and from 1989-90 onwards, they
refer to the financial year (April-March).
Table 96
Loans and advances to overseas institutions relate to special credit to Bangladesh,
overseas buyers' credit and overseas investment finance. Data on other assets
are inclusive of cash in hand/transit and balances with banks.
IDBI has switched
over to the accounting year as April-March basis from the year 1989. Data relate
to General Fund and Development Assistance Fund which were separate till 1991
and merged since 1992. Amount pertaining to ad hoc bonds has been classified
under 'Other sources' which also include deposits and foreign currency borrowings.
Bonds and debentures include public issue of unsecured bonds. Table
97
Advance towards capital shows as per the pending amendment
to NABARD Act, 1981 for enhancement of capital.
NRC (LTO) | National
Rural Credit (Long Term Operations) | NRC
(Stabilisation) | National Rural Credit
(Stabilisation) | IBRD | International
Bank for Reconstruction and Development | IDA | International
Development Association | ARDR | Agricultural
and Rural Debt Relief | RIDF | Rural
Infrastructure Development Fund | MT
and LT | Medium Term and Long Term |
ST | Short
Term | ADFC | Agricultural
Development Finance Companies | Table
98
Data on other liabilities are inclusive of specific grant
from Government of India in terms of agreement with KfW- Germany from December
1973.
Effective March 28, 1997, the Industrial Reconstruction Bank of India
(IRBI) is reconstituted as the Industrial Investment Bank of India (IIBI).
Table 99
Data on debentures and bonds are inclusive
of Partially Convertible Notes (PCNs).
Data on investments include amounts
subscribed as a result of underwriting operations.
Data on Rupee loans include
borrowing/loans out of Interest Differential Funds (in terms of KfW loan agreement)
and Rupee loans recoverable from borrowers under UK/India Grant 1984.
Data
on other assets also include fixed assets.
Table 100
Exim Bank has switched over to the accounting on April-March basis from 1989.
Data relate to General Fund and Export Development Fund (EDF)
Previous year's
figures have been regrouped wherever necessary.
Data on borrowing from IDBI
show balance payable on transfer of export loan/guarantee business. Table
102
Number of corporations also include Tamil Nadu Industrial
Investment Corporation Ltd. Fixed deposits include cash certificates of one corporation.
Figures for the year 2004-05 are available in respect of 17 SFCs.
Figures
for the year 2005-06 are available in respect of 12 SFCs.
Table
103
Data on assets and liabilities of IIBI are on July-June
basis for 1981 to 1990 and on April-March basis from 1991 onwards.
Effective
March 28, 1997, the Industrial Reconstruction Bank of India is reconstituted as
the Industrial Investment Bank of India.
Table 104
Bonds and debentures include SLR bonds and unsecured bonds.
For the years
1994 to 1996, deposits represent amounts placed with SIDBI by foreign banks in
lieu of shortfall in their advances to priority sector. For the year 1997 and
onwards, deposits represent deposits from foreign banks and private sector banks
in lieu of shortfall in their advances to priority sector and deposits under SIDBI's
fixed deposits scheme.
Borrowings from other sources include (a) consideration
payable to IDBI against transfer of outstanding portfolio relating to small scale
sector, and (b) foreign currency borrowings.
Other assets include cash in
hand/transit and balances with banks.
Table 105
(i) Development Reserve Fund (DRF) started from 1984.
(ii) Dividend
Equalisation Reserve Fund started in 1988.
(iii) For other funds data are
not available from 1971 to 1974.
(iv) For Government securities/deposits,
detailed breakup not available from 1971 to 1977.
Tables 107,
112, 116, 121, 248 to 250
Major deficit indicators presented
in these tables are defined as follows : revenue deficit denotes the difference
between revenue receipts and revenue expenditure. The conventional deficit (budgetary
deficit) is the difference between all receipts and expenditure, both revenue
and capital. Since March 1997, conventional deficit is represented as draw down
of cash balances. The gross fiscal deficit (GFD) is the excess of total expenditure
(including loans net of recovery) over revenue receipts (including external grants)
and non-debt capital receipts. Since 1999-2000, GFD excludes States' share in
small savings as per the new system of accounting. The net fiscal deficit is the
gross fiscal deficit less net lending of the Central Government. Gross primary
deficit is defined as GFD minus interest payments. The net primary deficit
denotes net fiscal deficit minus net interest payments. Primary revenue
balance denotes revenue deficit minus interest payments. The net RBI
credit to the Central Government represents the sum of variations in the RBI's
holdings of (i) Central Government dated securities, (ii) treasury bills, (iii)
Rupee coins, and (iv) loans and advances from RBI to the Centre since April 1,
1997 adjusted for changes in the Centre's cash balances with RBI in the case of
Centre. Regarding State Governments, net RBI credit refers to variation in loans
and advances given to them by the RBI net of their incremental deposits with the
RBI, for the State Governments having accounts with the RBI. The combined deficit
indicators have been worked out after netting out the inter-Governmental transactions
between Centre and States. Combined GFD is the GFD of Central Government plus
GFD of State Governments minus net lending from Central Government to
State Governments. Revenue deficit is the difference between revenue receipts
and revenue expenditure of the Central and State Governments adjusted for interGovernmental
transactions in the revenue account. Combined gross primary deficit is defined
as combined GFD minus combined interest payments.
Tables
108 to 110 & 248
The accounting classification of the Central
Budget has undergone two major changes since 1970-71, once in 1974-75 and again
in 1987-88. Besides, there have been regrouping and reclassification of certain
receipts and expenditure items between revenue and capital accounts. These regrouping/reclassifications
were in the nature of (i) external grants, which were treated as capital receipts
prior to 1991-92, have been reclassified under revenue receipts since then; (ii)
prior to 1982-83, capital expenditure was inclusive of discharge of debt (both
internal and external debt) and since then, capital expenditures have been shown
net of discharge of debt; (iii) beginning 1987-88, the budgetary classification
has been changed by regrouping the expenditures into plan and non-plan heads from
the classification of developmental and non-developmental heads followed then;
(iv) receipts under small savings were shown net of loans to States and UTs against
their collections, prior to 1990-91. The 1991-92 Central Government Budget published
the back data up to 1982-83 incorporating the above regrouping/ reclassification.
Data presented in the Handbook for the period prior to 1982-83 have also been
adjusted for these changes to the extent possible to build a consistent and comparable
time-series data, while retaining the deficit figures unaltered as given in the
Budget documents. Accordingly, the receipts and expenditure figures of the Central
Government given in these tables will not tally with the figures published in
the respective Budget documents prior to 1991-92.
Table 109
In the Union Budget 1999-00, a National Small Savings Fund (NSSF) has been
created in the Public Account of India and all collections/ disbusements under
small savings certificates, deposits and public provident fund are made into/out
of this Fund. Under the new accounting system, investments from the Fund are being
made in Central and State Government securities as per the norms decided from
time to time by the Government of India. Therefore, the figures for small savings
since 1999-2000 relate to Centre's share in small savings and prior to this period,
the figures represent total small saving collections. Since April 1, 2002 the
entire net collections under the small saving schemes are transferred to States/Union
Territories. Thereafter, the amount represents reinvestment by NSSF in Central
Government securities from redemption proceeds.
Table 111
The expenditure figures given in the table differ from the data given in
the Expenditure Budget of the Central Government on account of inclusion of the
gross transactions of commercial departments in the revenue account. Regarding
classification of budgetary figures into developmental and non-developmental,
data from 1974-75 onwards cover expenditure on food subsidy under the head 'agriculture
and allied services' under developmental expenditure; in earlier years, data on
the expenditure on these items were included under the head 'other expenditure'
as part of non-developmental expenditure. The expenditure figures for the years
1986-87 to 1998-99 have been revised in the later Budgets. As the component-wise
details are not available, these revisions have been effected only in the totals.
Hence, the individual components of developmental and non-developmental heads
will not add up to totals for these years.
Table 112
For the years 1994-95 to 1996-97, GFD receipts include values of bonus shares
also. For the years 1999-2000 to 2001-02, small savings and public provident funds
are represented by National Small Savings Fund (NSSF) investment in Central Government
special securities which form part of Centre's public debt and are included in
other borrowings. Reinvestments of redemption proceeds by NSSF in Central Government
special securities also from part of Centre’s public debt and are included
in other borrowings from 2003-04 onwards.
Tables 116 to
120, 129 & 249
The account figures of 2000-01 include the
data of Chhattisgarh and Uttaranchal for the period November 2000 to March 2001
and do not include those of Jharkhand.
Table 117
In terms of the change in the constitutional provision for sharing Central
taxes between the Centre and the States, all taxes and duties (except surcharge
on taxes and duties and any cess for specific purpose) are distributed between
the Union and the States from the year 2000-01 as against the earlier provision
for sharing of income tax and union excise duty. As full details of State's share
in the Central taxes are not uniformly available in the State Budgets, only aggregate
position of the States' share in Central taxes has been presented.
Tables
121, 122 & 124
Figures for Centre and States do not
add up to the combined position due to inter-Government adjustments. The data
relating to combined receipts and expenditure of Central Government and State
Governments are shown net of interGovernmental transactions. The adjustments are
thus: (i) revenue receipts of the States and revenue expenditure of the Centre
are adjusted for grants from the Centre to the States, (ii) revenue expenditure
of the States and revenue receipts of the Centre are net of interest payments
to the Centre by the States, (iii) capital receipts of the States and capital
disbursements of the Centre are adjusted for loans from the Centre to States,
and (iv) capital disbursements of the States and capital receipts of the Centre
are net of repayments of loans by the States to the Centre, (v) the tax revenue
for 2000-01 onward is net of amount transferred to National Calamity Contingency
Fund (NCCF).
Table 123
Centre's gross tax revenue
excludes assignments of Union Territories taxes to local bodies up to 1993-94.
It includes amounts transferred to National Calamity Fund from 2000-01.
Table 124
Regarding Centre, the expenditure data for the years
1986-87 to 1988-89 have been revised in the later budgets as the component-wise
details are not available; these revisions have been effected in the totals.
Hence, the individual components of developmental and non-developmental heads
will not add up to totals for these years.
Table 127
With the creation of National Small Savings Fund (NSSF) in April 1999, the
outstanding balances under small savings amounting to Rs. 1,80,273 crore were
converted into Central Government special securities which formed part of internal
debt. Internal debt also includes liabilities on account of Market Stabilisation
Scheme (MSS). All investments by NSSF in Central Government’s special secrurities
form part of internal debt since 1999-2000. The sharp increase in internal debt
and corresponding decline in small savings and provident funds in 1999-2000 is
due to this accounting change.
Table 128
(i)
Loans and advances from the Central Government also include medium-term loans
extended by the Centre to States to clear their overdrafts outstanding with the
Reserve Bank of India. These include Rs.1,743 crore in 1982-83, Rs.400 crore in
1983-84 and Rs.1,628 crore in 1985-86.
(ii) Loans from banks and other
institutions include cash credit and loans from State Bank of India and other
banks, loans from National Rural Credit (Long-Term Operations) Fund of the NABARD,
National Co-operative Development Corporation, Life Insurance Corporation of India,
Employees State Insurance Corporation, Khadi and Village Industries Commission,
etc.
(iii) With the change in the system of accounting with
effect from 1999-2000, States' share in small savings collections which was included
under loans from the Centre is included under internal debt and shown as special
securities issued to National Small Savings Fund (NSSF) as a separate item.
(iv) Total liabilities include Internal Debt (including market borrowings
and Loans against Special Securities issued to NSSF), loans and advances from
the Centre, small savings, State provident funds, insurance and pension funds,
trusts endowments, reserve funds, deposits & advances and contingency funds.
Tables 129 & 251
Domestic liabilites of the
Centre include internal debt and other liabilities viz., National Small
Savings Fund, State Provident Fund, special deposits and reserve funds and deposits.
The liabilities of the Centre and States will not add up to the combined
liabilities on account of netting out of inter-Governmental transactions.
Also see note on Table 128 (iv).
Table 131
(i) All the postal savings schemes do not come under the purview of Wealth Tax
Act from the assessment year 1993-94.
(ii) Interest rates on post office
savings account and public provident funds are floating, i.e., changes
in interest rates would be applicable on cumulative outstanding balance.
(iii) Interest on post office time deposit is compounded quarterly.
(iv)
National Savings Scheme 1992 was withdrawn with effect from November 1, 2002.
(v) In addition to the interest, post office monthly income scheme also includes
a bonus of 10 per cent payable on maturity after 6 years. However, the 10
per cent bonus payment is not available to accounts opened on or after February
13, 2006.
(vi) Interest rate on NSC VIII is compounded semi-annually.
(vii) Indira Vikas Patra has been discontinued with effect from July 17,
1999.
(viii) The Deposit Scheme for Retiring Government Employees 1989
& Deposit Scheme for Retiring Employees of Public Sector Companies 1991 have
been discontinued with effect from July 9, 2004.
(ix) The Senior Citizens
Savings Scheme was introduced from August 2, 2004. The scheme is available at
post offices and designated public sector banks. Persons of 60 years of age and
above and retired employees of 55 years of age and above but less than 60 years
are eligible to open deposits under the scheme. The deposits are subject to a
maximum ceiling of Rs.15 lakh (limited to retirement benefits in case of eligible
retired employees below 60 years of age) and interest is paid on a quarterly basis.
(x) Section 80C, introduced vide Finance Act, 2005, allows for deduction
from income, an amount not exceeding Rs. 1 lakh with respect to sums paid or deposited
in the previous year, out of income chargeable to tax, in certain specified schemes.
(xi) Investments under all small saving schemes including Kisan Vikas Patra
have been restricted to individuals only with effect from May 13,
2005.
Table 132
Data on Public Provident Fund
up to 1992-93 relate to State Bank of India transactions only and from 1993-94
onwards they relate to post office transactions only.
Table 133
The statement on Government of India loans also includes (i) 5.5% Banks (Acquisition
of Shares) Compensation Bonds, 1999, (ii) 4.5% Jayanti Shipping Company (Acquisition
and Transfer) Compensation Bonds, 1981, and (iii) 5.75% Bonds, 1985, (Voluntary
Disclosure of Income and Wealth Ordinance, 1975), now (Voluntary Disclosure of
Income and Wealth Act, 1976). Special Bearer Bonds issued on February 2, 1981
are not covered.
Tables 134 to 146, 209 & 210
The above tables relating to India's foreign trade are based on the data
received from the Directorate General of Commercial Intelligence and Statistics
(DGCI&S), Ministry of Commerce, Government of India. Some of the important
aspects of coverage and composition of the data presented in these tables are
briefly given below; for details, reference may be made to the DGCI&S publications,
namely: (i) Monthly Statistics of the Foreign Trade of India, Volume I and II,
and (ii) Foreign Trade Statistics of India (Principal Commodities and Countries).
Foreign trade data relate to merchandise trade through
all the recognised seaports, airports, land custom stations and inland container
depots located all over India. Data on exports, which include re-exports, relate
to free on board (f.o.b.) values and imports relate to cost, insurance and freight
(c.i.f.) values. Exports and imports are based on the general system of recording,
according to which exports relate to Indian merchandise and re-exports relate
to foreign merchandise previously imported into India. Imports relate to foreign
merchandise, whether intended for home consumption, bonding or re-exportation.
Indian Trade Classification, Revision-2 (ITC-Rev. 2) which was based on Standard
International Trade Classification Revision-2 (SITC-Rev. 2), was in vogue from
April 1977 to March 1987. A new system of commodity classification known as Indian
Trade Classification (based on Harmonised Commodity Description and Coding System),
in short ITC (HS) has been adopted from April 1987. The ITC (HS) is an extended
version of the International Classification System called ';Harmonized Commodity
Description and Coding System'; evolved by World Customs Organisation previously
known as Customs Cooperation Council, Brussels. Due to changes in trade classification
of the commodities, as indicated above, time series data on exports and imports
relating to certain commodity groups may not be strictly comparable. Moreover,
some country and/ or group definitions have also changed over time. Some of these
are stated below: Data for Russia prior to 1993-94 relate
to erstwhile USSR with the exception of 1992-93, wherein the data relate to the
Commonwealth of Independent States (C.I.S.) representing a group of following
fifteen countries, viz., Armenia, Azerbaijan, Belarus, Estonia, Georgia,
Kazakhstan, Kyrgyz Republic, Latvia, Lithuania, Moldova, Russia, Tajikistan, Turkmenistan,
Ukraine and Uzbekistan. From the year 1995-96, data in
respect of European Union (E.U.) group consist of fifteen countries, viz.,
Austria, Belgium, Denmark, Finland, France, Germany, Greece, Ireland, Italy, Luxembourg,
Netherlands, Portugal, Spain, Sweden and U. K. Prior to 1995-96, data reported
under E.U. relate to twelve countries, i.e., excluding Austria, Finland
and Sweden from the above list.
Current 11 members of the OPEC are Algeria,
Indonesia, Iran, Iraq, Kuwait, Libya, Nigeria, Qatar, Saudi Arabia, the United
Arab Emirates and Venezuela. Ecuador and Gabon withdrew from OPEC membership at
the end of 1992 and 1994, respectively. Data on OPEC totals, therefore, relate
to the 13 countries for the period from 1987-88 to 1992-93, 12 countries for the
period 1993-94 to 1994-95 and the 11 countries for the subsequent period.
Data on India's trade with Germany relate to Federal Republic of Germany up till
1989-90 and to unified Germany from 1990-91 onwards. Trade balance and its
components have been defined as:
(i) Trade balance = Total exports
- Total imports.
(ii) Oil trade balance = Oil exports - Oil imports.
(iii) Non-oil trade balance = Non-oil exports - Non-oil
imports. Tables 136 & 137
Compositions of some of the important commodity/groups used in the tables (131,
132 from 1987-88 onwards) are as follows:
(i) Leather & manufactures include
finished leather, leather goods, leather garments, footwear of leather & components
and saddlery & harness.
(ii) Engineering goods include ferro-alloys, aluminium
other than products, non-ferrous metals, manufactures of metals, machine tools,
machinery & instruments, transport equipment, residual engineering items,
iron & steel bar/rod, etc., primary & semi-finished iron and
steel, electronic goods, computer software in physical form and project goods.
(iii) Chemicals and related products consists of (a) basic chemicals, pharmaceuticals
& cosmetics ('drugs, pharmaceuticals and fine chemicals', ‘dyes, intermediates
& coal tar chemicals’, ‘organic/inorganic/agro-chemicals', 'cosmetics/toilet
preparations', etc. (b) plastic and linoleum products (c) rubber, glass,
paints and enamels, etc. (rubber manufactured products except footwear,
footwear of rubber/canvas, etc., paints/enamels/varnishes, etc.,
glass/glassware/ceramics/ refractories, etc.), and (d) residual
chemicals and allied products.
(iv) 'Textile and textiles products' includes
: (a) cotton yarn, fabrics, made-ups, etc., (b) natural silk yarn, fabrics
made-ups, etc. including silk waste, (c) man-made yarn, fabrics, made-ups,
etc., (d) man-made staple fibre, (e) woolen yarn, fabrics, made-ups,
etc., (f) readymade garments (RMG) consists of RMG cotton including accessories,
RMG silk, RMG man-made fibres, RMG wool, RMG other than textile material (g) jute
and jute manufactures consists of jute yarn, jute hessian, floor covering of jute
and other jute manufactures (h) coir and coir manufactures, and (i) carpets consist
of hand made, mill made and silk carpets.
Tables 142 & 143
In the tables pertaining to direction of trade, country-wise data on exports
from the year 2002-03 onwards include exports of petroleum (crude and products).
Country-wise breakup of this item is not available for the earlier years and it
is included in the others/unspecified group. In the case of imports, country-wise
data from 2000-01 onwards do not include imports of petroleum (crude and products);
these are included in the others/unspecified group.
Table 144
to 146
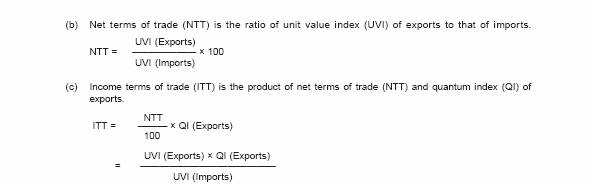
The index number of foreign trade of a country serves
as an instrument to indicate the temporal fluctuations in the export/ import of
the country in terms of volume and unit price. An index number, in general,
may be defined as a measure of average change in a group of related variables
over two different situations. The index number of foreign trade have been computed
as: 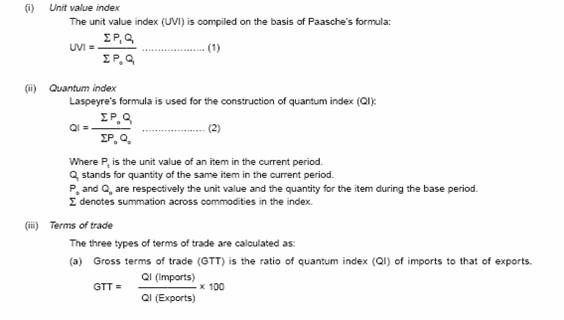
Tables
147 to 152, 164, 211, 212 & 252
(i) PR denotes data being
partially revised on availability of additional information, change in compilation
procedure, etc. while P denotes preliminary.
(ii) Interest accrued
during the year and credited to NRI deposits has been treated as notional outflow
under invisible payments and added as reinvestment in NRI deposits under Banking
Capital - NRD. This treatment has been effected from 1988-89 onwards.
(iii)
The item ';Non-monetary Gold Movement'; has been deleted from invisibles
in conformity with the IMF Manual on BoP
(5th edition) from May 1993 onwards;
these entries have been included under merchandise or other capital payments depending
upon the nature of transaction.
(iv) Since 1990-91, BoP data are presented
in a format, in which in the year of imports, the value of defence related imports
are recorded under imports (merchandise debit) with credits financing such imports
shown under ';Loans (External Commercial Borrowings to India)'; in the
capital account. Interest payments on defence debt owed to the General Currency
Area (GCA) are recorded under 'Investment Income' debit and principal repayments
under debit to ';Loans (External Commercial Borrowings to India)';. In
the case of Rupee Payment Area (RPA), interest payment on and principal repayment
of debt is clubbed together and shown separately under the item ';Rupee Debt
Service'; in the capital account. This is in line with the recommendations
of the High Level Committee on Balance of Payments (Chairman: Dr. C. Rangarajan).
(v) In accordance with the provisions of IMF's Balance of Payments Manual (5th
edition), gold purchased from the Government of India by the RBI has been excluded
from the BoP statistics. Data for the earlier years have, therefore, been amended
by making suitable adjustments in ';Other Capital Receipts'; and ';Foreign
Exchange Reserves';. Similarly, the item ';SDR Allocation'; has been
deleted from the table.
(vi) In accordance with the recommendations of the
Report of the Technical Group on Reconciling Balance of Payments and DGCI&S
Data on Merchandise Trade, data on gold and silver brought in by the Indians returning
from abroad have been included under import payments with contra entry under Private
Transfer Receipts since 1992-93.
(vii) In accordance with the IMF's Balance
of Payments Manual (5th edition), 'compensation of employees' has been shown under
the head, ';Income'; with effect from 1997-98; earlier, 'compensation
of employees' was recorded under the head ';Services - miscellaneous';.
(viii) Since April 1998, the sale and purchase of foreign currency by the Full
Fledged Money Changers (FFMC) are included under ';travel'; in services.
(ix) In the table on BoP indicators, the GDP denotes GDP at current market prices.
(x) Exchange Rates : Foreign currency transactions have been converted
into rupees at the par/central rates up to June 1972 and on the basis of average
of the Bank's spot buying and selling rates for sterling and the monthly averages
of cross rates of non-sterling currencies based on London market thereafter. Effective
March 1993, conversion is made by crossing average spot buying and selling rate
for US Dollar in the forex market and the monthly averages of cross rates of non-dollar
currencies based on the London market.
(xi) Foreign direct investment
: FDI to and by India up to 1999-2000 comprise mainly equity capital. In line
with the international best practices, the coverage of FDI has been expanded since
2000-01 to include, besides equity capital, reinvested earnings (retained earnings
of FDI companies) and 'other capital' (inter-corporate debt transactions between
related entities). Data on equity capital include equity of unincorporated entities
(mainly foreign bank branches in India and Indian bank branches operating abroad)
besides equity of incorporated bodies. Table 155,
156, 157, 158 & 215
With the revision of REER & NEER,
the Reserve Bank has been compiling revised 36 - currency REER & NEER series
effective 1993. Hence, the old 36 - country REER & NEER cannot be compared
with the revised 36 - currency REER & NEER series given in the tables.
Tables 165, 218 & 222
(i) With effect from
April 1, 1999, the conversion of foreign currency assets into US dollar is done
at week-end (for weekend figures) and month-end (for month-end figures) New York
closing exchange rates. Prior to April 1, 1999, conversion of foreign currency
assets into US dollar was done at representative exchange rates released by the
IMF.
(ii) Since March 1993, foreign exchange holdings are converted into Rupees
at Rupee-US dollar RBI holding rates. (iii) Reserve tranche position (RTP) in
IMF has been included in total foreign exchange reserves from April 2, 2004 to
match the international best practices. Foreign exchange reserve figures (monthly)
have accordingly been revised for 2002-03 and 2003-04 to include RTP position
in the IMF. Table 169
The Reserve
Bank maintains currency chests and small coin depots, not only with the State
Bank of India (SBI), its Associates and nationalised banks but also with treasuries
and sub-treasuries. Currency chests/small coin depots have also been established
with scheduled private sector banks, one foreign bank and a state cooperative
bank.
Table 172
Definition : Currently, a minimum
consumption expenditure, anchored in an average (food) energy adequacy norm of
2400 and 2100 calories per capita per day is used to define State specific poverty
lines, separately for rural and urban areas. These poverty lines are then applied
on the NSSO’s household consumer expenditure distributions to estimate the
proportion and number of poor at the State level. For details please refer to
National Human Development Report, 2001, Planning Commission, Government of India.
1. The State-wise poverty lines are based on the methodology
of the Expert Group as adopted by the Planning Commission.
2.
The poverty lines at All India are implicitly derived from All India poverty ratio
and NSS consumption expenditure distribution of the year.
3.
For the years 1983-84, 1993-94 and 1999-00: i. Poverty ratio of Assam is used
for Sikkim, Arunachal Pradesh, Meghalaya, Mizoram, Manipur, Nagaland and Tripura;
ii. Poverty ratio of Tamil Nadu is used for Pondicherry and Andaman & Nicobar
Islands; iii. Poverty ratio of Kerala is used for Lakshadweep; poverty ratio of
Goa is used for Daman & Diu; iv. Poverty line of Maharashtra and expenditure
distribution of Goa is used to estimate poverty ratio of Goa; and v. Urban poverty
ratio of Punjab is used for both rural and urban poverty of Chandigarh.
4.
Poverty ratio of Goa is used for Dadra & Nagar Haveli (1983-84).
5.
Poverty line of Maharashtra and expenditure distribution of Dadra & Nagar
Haveli is used to estimate poverty ratio of Dadra & Nagar Haveli (1993-94
and 1999-00).
6. Poverty ratio and poverty line of Himachal
Pradesh is used for Jammu & Kashmir for 1993-94 and 1999-00, respectively.
7. Urban poverty ratio of Rajasthan may be treated as tentative
(1999-00).
8. Poverty line is in Rupees per capita per month;
1 Lakh is equivalent to 1,00,000.
Table 197
(i) New capital issues exclude bonus shares. Data on private placement and offer
for sale are also excluded. (ii) Preference shares include cumulative convertible
shares.
(iii) Debentures also include bonds issued by certain financial
institutions. Partly convertible debentures are included in convertible debentures. |