|
Global financial markets, after remaining relatively benign during 2005-06, exhibited large volatility during May-June 2006. With inflation rising sharply during May 2006, expectations that central banks might tighten further than earlier anticipated unnerved financial markets, especially commodity and equity markets. Risk spreads, which had declined to record lows in 2005-06 on the back of search for yield, widened as investors re-priced risk. Foreign investors pulled out from emerging market economies (EMEs), reflecting increase in risk aversion even as fundamentals remain largely strong.
Short-term interest rates increased further in a number of economies during the first quarter of 2006-07 in consonance with continuous monetary tightening as central banks raised their policy rates further to ward off inflationary pressures stemming from higher international crude oil and other commodity prices in an environment of strong domestic demand (Table 31). The US increased its fed funds rate target by 50 basis points (bps) during the quarter while the European Central Bank raised its policy rate by 25 basis points during the quarter. Other advanced economies such as Australia, Canada, Norway and Sweden and EMEs such as Korea, Israel, South Africa, Thailand and Turkey also increased their policy rates during the quarter. After maintaining zero interest rates for an extended period, the Bank of Japan on July 14, 2006 decided to increase the
|
Table 31: Short-term Interest Rates |
| |
|
|
|
|
|
(Per cent) |
|
Region/Country |
At end of |
| |
|
|
|
|
|
|
| |
|
March 2004 |
March |
2005 |
March 2006 |
June 2006 |
|
1 |
|
2 |
|
3 |
4 |
5 |
|
Advanced Economies |
|
|
|
|
|
|
Euro Area |
1.96 |
|
2.15 |
2.80 |
3.06 |
|
Japan |
|
0.03 |
|
0.02 |
0.04 |
0.24 |
|
Sweden |
|
2.12 |
|
1.97 |
1.99 |
2.23 |
|
UK |
|
4.31 |
|
4.95 |
4.58 |
4.70 |
|
US |
|
1.04 |
|
2.90 |
4.77 |
5.48 |
|
Emerging Market Economies |
|
|
|
|
|
|
Argentina |
|
2.88 |
|
4.56 |
9.63 |
10.00 |
|
Brazil |
|
16.02 |
|
19.25 |
16.54 |
15.18 |
|
China |
|
N.A. |
|
2.25 |
2.40 |
3.00 |
|
Hong Kong |
0.17 |
|
2.79 |
4.47 |
4.67 |
|
India |
|
4.24 |
|
5.37 |
6.11 |
6.36 |
|
Malaysia |
|
3.00 |
|
2.82 |
3.51 |
3.93 |
|
Philippines |
9.19 |
|
7.25 |
7.38 |
8.00 |
|
Singapore |
0.69 |
|
2.06 |
3.44 |
3.50 |
|
South Korea |
3.90 |
|
3.54 |
4.26 |
4.57 |
|
Thailand |
|
1.31 |
|
2.64 |
5.10 |
5.40 |
| |
|
|
|
|
|
|
|
N.A. : Not Available.
Note : Data for India refer to 91-day Treasury Bills rate and for other countries 3-month money market rates.
Source : The Economist. |
uncollateralised overnight call rate (adopted as the operating target for monetary
policy since March 2006) by 25 basis points.
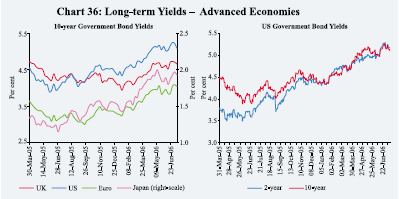
Long-term Government bond yields which had started rising in
January 2006 rose further during April 2006 reflecting concerns about growing
inflationary pressures (Chart 36). In the US, yields increased on the expectations
that the US Federal Reserve may push the federal funds rate target higher than
anticipated. Following the turmoil in global financial markets in mid-May 2006
over concerns of higher than anticipated inflation, there was a flight to safety
and investors preferred to invest in risk-free Government bonds. Accordingly,
long-term yields fell in the second half of May 2006. Yields, however, again
edged up in the second half of June 2006 on renewed concerns over rise in the
US core inflation. Between end-March 2006 and end-June 2006, 10-year yields
increased by 29 basis points in the US, 34 basis points in the euro area and
14 basis points in Japan. In the euro area and Japan, the increase in yields
also reflected strengthening outlook for economic activity.
Equity markets registered losses in a number of economies during
the quarter ended June 2006, reversing a part of the large gains recorded during
2005. Equity markets in EMEs initially rallied during April 2006 continuing
the trend of the previous year reflecting continuing search for yield amidst
strong macroeconomic fundamentals and announcement of better than expected corporate
profits for the first quarter of 2006. As on May 10, 2006, the world Morgan
Stanley Capital International (MSCI) index was 11.5 per cent higher than end-2005,
while the EMEs MSCI index increased by 24.5 per cent. The turmoil in global
financial markets following higher than anticipated US inflation and the concomitant
increase in risk aversion also impacted global equity markets. As a result,
equity markets around the world fell. Equity markets in many EMEs were
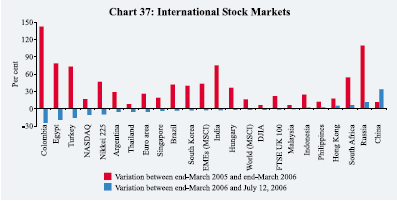
the hardest hit (Chart 37). Equity markets, however, staged some recovery during
June 2006.
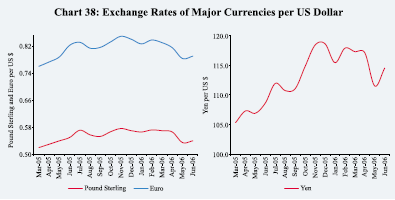
In the foreign exchange market, the US dollar depreciated during
April-May 2006 (Chart 38). Growing macroeconomic imbalances and inflation concerns
in the US contributed to the dollar’s decline. The US dollar, however, appreciated
during June 2006 reflecting demand for US assets as investors pulled out of
EMEs on the back of increase in risk aversion following higher than anticipated
inflation in the US. During the quarter, the US dollar depreciated by 5.3 per
cent against the Pound sterling, 2.4 per cent against the Yen and 4.8 per cent
against the Euro.
Indian financial markets remained largely orderly during the
first quarter of 2006-07. Call money rates eased during the quarter and remained
generally close to the reverse repo rate. Interest rates in the collateralised
segment of the overnight money market – which now dominates the turnover in
the money market – remained below the reverse repo rate and the call rate during
the quarter. The foreign exchange market remained orderly even as the Indian
rupee depreciated during May-June 2006. Yields in the Government securities
market hardened during the quarter. The yield curve steepened as the increase
at the longer end was higher than at the short-end. In the credit market, deposit
and lending rates edged up during the quarter as credit demand remained strong.
The stock markets, after reaching an all time high level on May 10, 2006, witnessed
correction in line with the trends in major international markets. The stock
markets recovered some of these losses during June 2006. The primary market
segment of the equity market witnessed a sharp increase in resources raised
during April-May 2006 on the back of a buoyant secondary market and strong macroeconomic
fundamentals (Table 32).
|
Table 32: Domestic Financial Markets at a Glance |
|
Month |
|
Call Money |
Government |
Foreign Exchange |
Liquidity |
Equity |
| |
|
|
|
Securities |
|
|
|
|
Management |
|
|
|
| |
|
|
|
|
|
|
|
|
|
|
|
|
|
|
|
| |
|
Average |
Average |
Average |
Average |
Average |
Average |
RBI’s net |
Average |
Average |
Average |
Average |
Average |
Average |
Average |
| |
|
Daily |
Call |
10-Year |
Turnover |
Daily |
Exchange |
Foreign |
Forward |
MSS |
Daily |
Daily |
Daily |
BSE |
S&P |
| |
|
Turnover |
Rates* |
Yield@ |
in Govt. |
Inter- |
Rate |
Currency |
Premia |
Out- |
LAF |
BSE |
NSE |
Sensex** |
CNX |
| |
|
(Rs. |
(Per |
(Per |
Securities |
bank |
(Rs. per |
Sales(-)/ |
3-month |
standing# |
Out- |
Turnover Turnover |
|
Nifty** |
| |
|
crore) |
cent) |
cent) |
(Rs. |
Turnover |
US $) |
Purchases |
(Per |
(Rs. |
standing |
(Rs. |
(Rs. |
|
|
| |
|
|
|
|
crore)+ |
(US $ |
|
(+) |
cent) |
crore) |
(Rs. |
crore) |
crore) |
|
|
| |
|
|
|
|
|
million) |
|
(US $ |
|
|
crore) |
|
|
|
|
| |
|
|
|
|
|
|
|
million) |
|
|
|
|
|
|
|
|
1 |
|
2 |
3 |
4 |
5 |
6 |
7 |
8 |
9 |
10 |
11 |
12 |
13 |
14 |
15 |
| |
|
|
|
|
|
|
|
|
|
|
|
|
|
|
|
|
2004-05 |
14,170 |
4.65 |
6.22 |
4,826 |
8,894 |
44.93 |
20,847 |
1.66 |
46.445 |
35,592 |
2,054 |
4,513 |
5,751 |
1,808 |
| |
|
|
|
|
|
|
|
|
|
|
|
|
|
|
|
|
2005-06 |
16,622 |
5.60 |
7.12 |
3,643 |
12,655 |
44.27 |
8,143 |
1.60 |
58,792 |
11,075 |
3,248 |
6,256 |
8295 |
2520 |
|
April |
|
17,213 |
4.77 |
7.02 |
3,001 |
9,880 |
43.74 |
0 |
1.96 |
65,638 |
30,675 |
1,890 |
4,136 |
6379 |
1987 |
|
May |
|
15,269 |
4.99 |
7.11 |
3,805 |
10,083 |
43.49 |
0 |
1.57 |
68,539 |
22,754 |
1,971 |
3,946 |
6483 |
2002 |
|
June |
|
20,134 |
5.10 |
6.88 |
6,807 |
10,871 |
43.58 |
-104 |
1.40 |
70,651 |
13,916 |
2,543 |
4,843 |
6926 |
2134 |
|
July |
|
20,046 |
5.02 |
7.13 |
3,698 |
11,003 |
43.54 |
2,473 |
1.56 |
70,758 |
10,754 |
3,095 |
6,150 |
7337 |
2237 |
|
August |
16,158 |
5.02 |
7.04 |
4,239 |
11,749 |
43.62 |
1,552 |
0.69 |
71,346 |
34,832 |
3,452 |
6,624 |
7726 |
2358 |
|
September |
16.292 |
5.05 |
7.04 |
5,207 |
11,040 |
43.92 |
0 |
0.62 |
67,617 |
30,815 |
3,871 |
6,923 |
8272 |
2512 |
|
October |
17,164 |
5.12 |
7.14 |
2,815 |
13,087 |
44.82 |
0 |
0.69 |
68,602 |
18,608 |
2,955 |
6,040 |
8220 |
2487 |
|
November |
22,620 |
5.79 |
7.10 |
3,314 |
11,228 |
45.73 |
0 |
0.67 |
67,041 |
3,268 |
2,635 |
5,480 |
8552 |
2575 |
|
December |
21,149 |
6.00 |
7.13 |
2,948 |
13,808 |
45.64 |
-6,541 |
1.51 |
52,040 |
1,452 |
3,516 |
6,814 |
9162 |
2773 |
|
January |
17,911 |
6.83 |
7.15 |
3,094 |
16,713 |
44.40 |
0 |
2.60 |
40,219 |
-15,386 |
3,966 |
7,472 |
9540 |
2893 |
|
February |
13,497 |
6.93 |
7.32 |
2,584 |
15,798 |
44.33 |
2,614 |
2.85 |
33,405 |
-13,532 |
3,688 |
7,125 |
10090 |
3019 |
|
March |
|
18,290 |
6.58 |
7.40 |
2,203 |
17,600 |
44.48 |
8,149 |
3.11 |
29,652 |
-6,319 |
5,398 |
9,518 |
10857 |
3236 |
| |
|
|
|
|
|
|
|
|
|
|
|
|
|
|
|
|
2006-07 |
|
|
|
|
|
|
|
|
|
|
|
|
|
|
|
April |
|
16,909 |
5.62 |
7.45 |
3,685 |
17,574 P |
44.95 |
4,305 |
1.31 |
25,709 |
46,088 |
4,860 |
9,854 |
11742 |
3494 |
|
May |
|
18,074 |
5.54 |
7.58 |
3,550 |
17,908 P |
45.41 |
504 |
0.87 |
26,457 |
59,505 |
4,355 |
9,155 |
11599 |
3437 |
|
June |
|
17,425 |
5.73 |
7.89 |
2,258 |
14,512 P |
46.06 |
n.a. |
0.73 |
31,845 |
48,611 |
3,251 |
6,828 |
9935 |
2915 |
| |
|
|
|
|
|
|
|
|
|
|
|
|
|
|
|
|
* : Average of daily weighted call money borrowing rates. + : Average of daily outright turnover in Central Government dated securities.
@ : Average of daily closing rates. ** : Average of daily closing indices. LAF : Liquidity Adjustment Facility.
MSS : Market Stabilisation Scheme. BSE : The Stock Exchange, Mumbai. NSE : National Stock Exchange of India Ltd.
# : Average of weekly outstanding MSS. P : Provisional n.a. : Not available.
Note : In column 11, (+) indicates absorption and (-) indicates injection of liquidity. |
Money Market
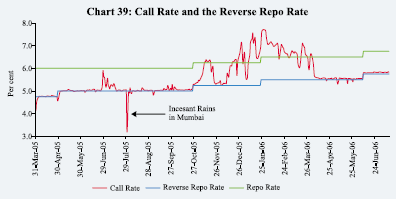
Money market conditions remained
largely comfortable during the first quarter of 2006-07. Call money rates which
had edged up during the second half of 2005-06 eased during April-May 2006 and
remained close to the reverse repo rate, the lower band of the liquidity adjustment
facility (LAF) corridor, reflecting easing of liquidity conditions. With the
increase in the fixed reverse repo rate by 25 basis points effective June 9,
2006, call rates also edged up by a similar magnitude (Chart 39). Call rate
was 5.83 per cent as on July 19, 2006, 81 basis points lower than that at end-March
2006.
The interest rates in the collateralised
segments of the money market –the market repo (outside the LAF) and the Collateralised
Borrowing and Lending Obligation (CBLO) segments – also eased during April-June
2006 and continued to remain below the call rate. For instance, the rates in
the CBLO segment averaged 5.21 per cent during April-June 2006, 42 basis points
lower than that in the call money market over the same period. The collateralised
market has now emerged as the predominant segment in the money market, with
a share of more than 75 per cent in the total turnover (Chart 40 and Table 33).
The supply of funds in the CBLO as well as the market repo segments has been
augmented by participation of mutual funds (MFs) and insurance companies reflecting
large surpluses with them in view of higher resource mobilisation. Commercial
banks are the major borrowers of funds in the CBLO market. By June 2006, 155
members with 81 active members have been admitted in the CBLO segment of the
Clearing Corporation of India Limited.
Certificates of Deposit
Demand for certificates of deposit (CDs) remained
strong during the first quarter of 2006-07 as banks continued to supplement
their sources of funds to
|
Table 33: Activity in Money Market Segments |
| |
|
|
|
|
|
|
(Rupees crore) |
| |
Average Daily Turnover # |
Commercial Paper |
Certificates of Deposit |
|
Month |
Call Money |
Repo Market |
Collateralised |
Term Money |
Outstanding |
Amount |
Outstanding |
| |
Market |
(Outside the |
Borrowing and |
Market |
|
Issued |
|
| |
|
LAF) |
Lending |
|
|
|
|
| |
|
|
Obligation |
|
|
|
|
| |
|
|
(CBLO) |
|
|
|
|
|
1 |
2 |
3 |
4 |
5 |
6 |
7 |
8 |
| |
|
|
|
|
|
|
|
|
2004-05 ^ |
14,170 |
17,135 |
6,697 |
526 |
11,723 |
1,090 |
6,052 |
|
2005-06 ^ |
17,979 |
21,183 |
20,039 |
833 |
17,285 |
3,073 |
27,298 |
|
April |
17,213 |
12,174 |
10,370 |
661 |
15,598 |
3,549 |
16,602 |
|
May |
15,269 |
13,688 |
12,233 |
545 |
17,182 |
3,824 |
17,689 |
|
June |
20,134 |
17,163 |
11,792 |
534 |
17,797 |
2,925 |
19,270 |
|
July |
20,046 |
18,103 |
15,292 |
717 |
18,607 |
3,360 |
20,768 |
|
August |
16,158 |
21,325 |
14,544 |
754 |
19,508 |
4,110 |
23,568 |
|
September |
16,292 |
18,872 |
17,143 |
1,116 |
19,725 |
2,519 |
27,641 |
|
October |
17,164 |
20,980 |
21,763 |
734 |
18,726 |
2,892 |
29,193 |
|
November |
22,620 |
25,660 |
20,496 |
917 |
18,013 |
2,483 |
27,457 |
|
December |
21,149 |
25,574 |
21,265 |
775 |
17,234 |
3,304 |
32,806 |
|
January |
17,911 |
24,596 |
25,634 |
1,089 |
16,431 |
1,937 |
34,521 |
|
February |
13,497 |
24,096 |
34,162 |
813 |
15,876 |
3,160 |
34,487 |
|
March |
18,290 |
31,964 |
35,775 |
1,338 |
12,718 |
2,813 |
43,568 |
|
2006-07 |
|
|
|
|
|
|
|
|
April |
16,909 |
21,914 |
32,657 |
894 |
16,525 |
6,065 |
44,059 |
|
May |
18,072 |
36,107 |
34,293 |
945 |
16,922 |
4,701 |
50,228 |
|
June |
17,425 |
42,250 |
27,617 |
1,256 |
19,490 |
4,981 |
53,863* |
| |
|
|
|
|
|
|
|
|
# : Turnover is twice the single leg volumes in case of call money and CBLO to capture borrowing and lending both,
and four times in case of market repo (outside LAF) to capture borrowing and lending in the two legs for a repo.
* : As on June 9, 2006.
^ : Data are monthly averages. |
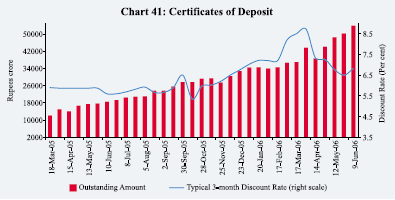
support credit demand. The amount of CDs outstanding increased
from Rs.43,568 crore at end-March 2006 to Rs.53,863 crore by June 9, 2006 (Chart
41). Outstanding CDs constituted 4.2 per cent of aggregate deposits of issuing
banks as on June 9, 2006 (4.8 per cent at end-March 2006). The typical discount
rate for 3-month maturity on CDs, which had edged higher during February-March
2006 in view of tight liquidity conditions, eased during the quarter from 8.72
per cent at end-March 2006 to 6.82 per cent by June 9, 2006.
Commercial Paper
Issuances of commercial paper (CP), which had exhibited some
moderation in the second half of 2005-06, picked up again during April-June
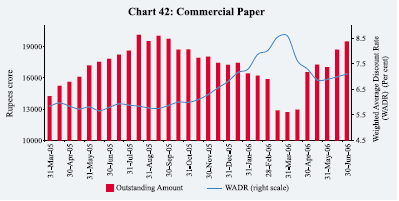
2006 following easing of liquidity conditions. Outstanding CPs increased from
Rs.12,718 crore at end-March 2006 to Rs.19,490 crore at end-June 2006 (Chart
42). The sharp increase in the weighted average discount rate (WADR) on CPs
in the second half of 2005-06 was reversed during April-June 2006: the WADR
fell from 8.59 per cent on March 31, 2006 to 7.10 per cent on June 30, 2006.
Leasing and finance companies remained the predominant issuers
of CPs, partly reflecting the policy of phasing out the access of these companies
to public deposits (Table 34). Issuances by manufacturing companies also recorded
an increase during the quarter, benefiting from fall in the discount rate.
Treasury Bills
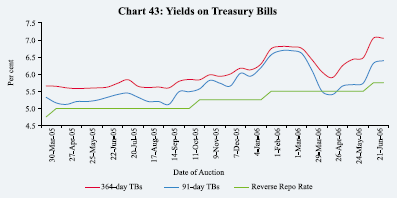
The primary market yields on Treasury Bills witnessed mixed trends. The yields
which had increased substantially between November 2005 and
February 2006, declined sharply till the third week of April
2006 with easing of liquidity conditions. The yields, however, firmed up from
the first auction of May 2006 on concerns of higher inflation, hike in the fed
funds rate target and larger issuances on account of reintroduction of auctions
under the Market Stabilisation Scheme (MSS). The cut-off yields increased further
during the second half of June 2006 reflecting hike in the reverse repo and
repo rates by 25 basis points each effective June 9, 2006 (Table 35 and Chart
43). The yield spread between 91-day and 364-day Treasury Bills at end-June
2006 was 62 basis points as compared with 32 basis points at end-March 2006.
|
Table 34: Commercial Paper – Major Issuers |
| |
|
|
|
| |
|
|
(Rupees crore) |
| |
|
|
|
|
Category of Issuer |
End of |
| |
|
|
|
| |
March 2005 |
March 2006 |
June 2006 |
| |
|
|
|
|
1 |
2 |
3 |
4 |
| |
|
|
|
|
Leasing and Finance |
8,479 |
9,400 |
13,400 |
| |
(59.6) |
(73.9) |
(68.8) |
|
Manufacturing |
2,881 |
1,982 |
4,054 |
| |
(20.2) |
(15.6) |
(20.8) |
|
Financial Institutions |
2,875 |
1,336 |
2,035 |
| |
(20.2) |
(10.5) |
(10.4) |
|
Total |
14,235 |
12,718 |
19,490 |
| |
(100.0) |
(100.0) |
(100.0) |
| |
|
|
|
|
Note: Figures in parentheses are percentage share to the total. |
|
Table 35: Treasury Bills in the Primary Market |
|
Month |
Notified Amount |
Average Implicit Yield at Minimum |
Average Bid-Cover Ratio |
| |
(Rupees crore) |
Cut-off Price (Per cent) |
|
|
|
| |
|
91-day |
182-day |
364-day |
91-day |
182-day |
364-day |
| |
|
|
|
|
|
|
|
|
1 |
2 |
3 |
4 |
5 |
6 |
7 |
8 |
| |
|
|
|
|
|
|
|
|
2004-05 |
1,38,500 |
4.91 |
– |
5.16 |
2.43 |
– |
2.52 |
| |
|
|
|
|
|
|
|
|
2005-06 |
1,55,500 |
5.68 |
5.82 |
5.96 |
2.64 |
2.65 |
2.45 |
|
April |
19,000 |
5.17 |
5.36 |
5.62 |
4.03 |
4.48 |
2.54 |
|
May |
15,000 |
5.19 |
5.35 |
5.58 |
3.30 |
3.37 |
2.29 |
|
June |
18,500 |
5.29 |
5.37 |
5.61 |
1.54 |
2.42 |
1.81 |
|
July |
11,500 |
5.46 |
5.67 |
5.81 |
1.21 |
1.79 |
1.68 |
|
August |
21,000 |
5.23 |
5.42 |
5.63 |
3.07 |
2.68 |
2.54 |
|
September |
23,000 |
5.24 |
5.37 |
5.70 |
1.52 |
1.45 |
1.61 |
|
October |
15,000 |
5.50 |
5.71 |
5.84 |
1.69 |
1.53 |
3.44 |
|
November |
11,000 |
5.76 |
5.85 |
5.96 |
2.12 |
1.92 |
2.30 |
|
December |
5,000 |
5.89 |
6.00 |
6.09 |
3.07 |
2.97 |
2.36 |
|
January |
5,000 |
6.25 |
6.22 |
6.21 |
2.86 |
2.83 |
2.72 |
|
February |
5,000 |
6.63 |
6.74 |
6.78 |
3.04 |
2.07 |
2.71 |
|
March |
6,500 |
6.51 |
6.66 |
6.66 |
4.17 |
3.43 |
3.36 |
| |
|
|
|
|
|
|
|
|
2006-07 |
|
|
|
|
|
|
|
|
April |
5,000 |
5.52 |
5.87 |
5.98 |
5.57 |
4.96 |
2.02 |
|
May |
18,500 |
5.70 |
6.02 |
6.34 |
1.88 |
1.36 |
1.69 |
|
June |
15,000 |
6.15 |
6.49 |
6.77 |
1.63 |
1.83 |
2.11 |
| |
|
|
|
|
|
|
|
|
Note : 182-day TBs were reintroduced with effect from April 2005. |
Foreign Exchange Market
In the foreign exchange market, the Indian rupee depreciated
vis-à-vis the US dollar during the first quarter of 2006-07. The
rupee’s weakness could be attributed partly to selling by the foreign institutional
investors (FIIs) in equity
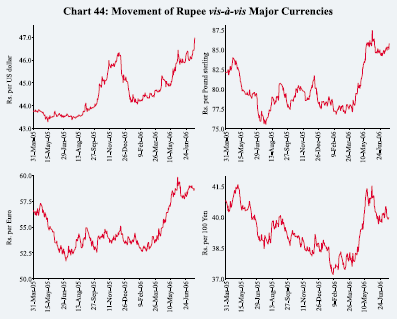
market, continued monetary policy tightening by the US and
higher crude oil prices. FIIs have registered outflows of about US $ 1.8 billion
during April-June 2006. The rupee has moved in a range of Rs.44.61– 46.97 per
US dollar during 2006-07 so far (up to July 19, 2006) (Chart 44). The exchange
rate was Rs.46.97 per US dollar as on July 19, 2006 – a depreciation of 5.0
per cent over its level on March 31, 2006. Over the same period, the rupee also
depreciated by 9.3 per cent against the Pound sterling, 7.7 per cent against
the Euro and 4.9 per cent against the Japanese yen.
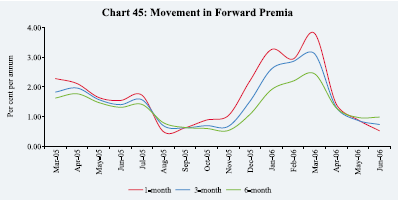
Forward premia declined during the first quarter of 2006-07
in tandem with the narrowing of interest rate differential following easing
of domestic money market interest rates coupled with further monetary tightening
in the US (Chart 45).
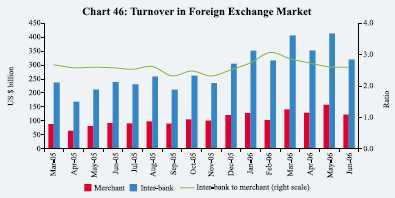
The turnover in the inter-bank as well as merchant segments
of the foreign exchange market fell during the first quarter of 2006-07. While
inter-bank turnover declined from US $ 405 billion during March 2006 to US $
319 billion in June
2006, the merchant turnover fell from US $ 141 billion to US
$ 122 billion over the same period (Chart 46). The ratio of inter-bank to merchant
turnover was 2.6 during June 2006 (2.9 during March 2006).
Credit Market
Deposit as well as lending rates of banks increased during
the first quarter of 2006-07 as banks intensified efforts to mobilise deposits
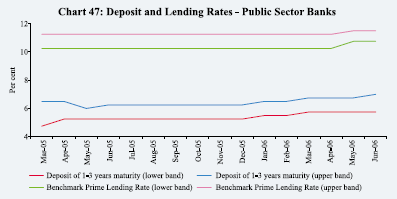
to meet the higher credit demand. Banks increased their deposit rates by about
25-100 basis points across various maturities between March 2006 and June 2006
(Table 36 and
|
Table 36: Movements in Deposit and Lending Rates |
| |
|
|
|
|
|
|
(Per cent) |
|
Interest Rate |
March 2005 |
March 2006 |
April 2006 |
May 2006 |
June 2006 |
|
1 |
|
|
2 |
3 |
4 |
5 |
6 |
|
1. |
|
Domestic Deposit Rate |
|
|
|
|
|
| |
|
Public Sector Banks |
|
|
|
|
|
| |
|
Up to 1 year |
2.75-6.00 |
2.25-6.50 |
2.25-6.50 |
2.75-6.50 |
2.75-6.50 |
| |
|
More than 1 year and up to 3 years |
4.75-6.50 |
5.75-6.75 |
5.75-6.75 |
5.75-7.00 |
5.75-7.00 |
| |
|
More than 3 years |
5.25-7.00 |
6.00-7.25 |
6.00-7.25 |
6.00-7.25 |
6.00-7.25 |
| |
|
Private Sector Banks |
|
|
|
|
|
| |
|
Up to 1 year |
3.00-6.25 |
3.50-7.25 |
3.50-7.25 |
3.50-6.75 |
3.50-6.75 |
| |
|
More than 1 year and up to 3 years |
5.25-7.25 |
5.50-7.75 |
6.50-7.75 |
6.50-7.75 |
6.50-7.75 |
| |
|
More than 3 years |
5.75-7.00 |
6.00-7.75 |
6.00-7.75 |
6.50-8.25 |
6.50-8.25 |
| |
|
Foreign Banks |
|
|
|
|
|
| |
|
Up to 1 year |
3.00-6.25 |
3.00-5.75 |
3.00-5.75 |
3.25-6.50 |
3.25-6.50 |
| |
|
More than 1 year and up to 3 years |
3.50-6.50 |
4.00-6.50 |
4.00-6.50 |
5.00-6.50 |
5.00-6.50 |
| |
|
More than 3 years |
3.50-7.00 |
5.50-6.50 |
5.50-6.50 |
5.50-6.75 |
5.50-6.75 |
| |
|
|
|
|
|
|
|
|
2. |
|
Benchmark Prime Lending Rate |
|
|
|
|
|
| |
|
Public Sector Banks |
10.25-11.25 |
10.25-11.25 |
10.25-11.25 |
10.75-11.50 |
10.75-11.50 |
| |
|
Private Sector Banks |
11.00-13.50 |
11.00-14.00 |
11.00-14.00 |
11.00-14.50 |
11.00-14.50 |
| |
|
Foreign Banks |
10.00-14.50 |
10.00-14.50 |
10.00-14.50 |
10.00-14.50 |
10.00-14.50 |
| |
|
|
|
|
|
|
|
|
3. |
|
Actual Lending Rate* |
|
|
|
|
|
| |
|
Public Sector Banks |
2.75-16.00 |
4.00-16.50 |
– |
– |
– |
| |
|
Private Sector Banks |
3.15-22.00 |
3.15-20.50 |
– |
– |
– |
| |
|
Foreign Banks |
3.55-23.50 |
4.75-26.00 |
– |
– |
– |
|
* : Interest rate on non-export demand and term loans above Rs.2 lakh excluding lending rates at the
extreme five per cent on both sides.
– : Not available. |
Chart 47). On the lending side, banks revised upwards their
Benchmark Prime Lending Rates (BPLRs) by 25-50 basis points. Public sector banks
raised their BPLRs by 25-50 basis points between March 2006 and June 2006; these
banks had kept their BPLRs unchanged during 2005-06 while revising upwards their
sub-BPLRs. The band of BPLRs for private sector banks and foreign banks
remained wider than that of public sector banks, although for
a majority of banks, the BPLRs lie in a relatively narrow range. For instance,
more than half of private sector banks (16 out of 30 for which comparative data
are available) had BPLRs in a range of 11-12 per cent at end-June 2006, while
seven banks had BPLRs in a range of 12-13 per cent and six banks had BPLRs in
a range of 10-11 per cent. As regards foreign banks, nine of them had BPLRs
in a range of 12-13 per cent, while eight had BPLRs in a range of 13-15 per
cent and five each in a range of 10-11 per cent and 11-12 per cent.
Government Securities Market
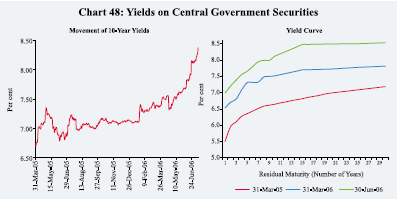
The yields in the Government securities market hardened further
during the first quarter of 2006-07 (Chart 48). After recording some decline
around mid-April 2006, yields moved upwards thereafter reflecting a variety
of factors such as sustained credit demand, further monetary policy tightening
in the US and in other economies, high and volatile crude oil prices, apprehensions
over domestic fuel price hike, hike in the reverse repo and repo rates effective
June 9, 2006, expectations of further rate hike and volatility in stock markets.
Expected issuances of oil bonds, conversion of recapitalisation bonds into tradable,
SLR-Government dated securities and higher Government expenditure in the first
two months of 2006-07 also led to hardening of yields. The 10-year yield has
increased by 84 basis points during 2006-07 so far: from 7.52 per cent as on
March 31, 2006 to 8.36 per cent as on July 19, 2006.
The spread between 1-year and 10-year yields which had narrowed
during January-March 2006 (reflecting largely higher rise in yields at short
end on account of tightening of liquidity conditions) increased during April-June
2006. The spread
|
Table 37: Yield Spread |
| |
|
|
|
(Basis points) |
| |
|
|
|
|
|
Month-end |
10 Year-Reverse Repo Rate |
10 Year-1 Year |
20 Year-10 Year |
30 Year-10 Year |
| |
|
|
|
|
|
1 |
2 |
3 |
4 |
5 |
| |
|
|
|
|
|
2004-05 ^ |
164 |
101 |
55 |
77 |
| |
|
|
|
|
|
2005-06 ^ |
196 |
106 |
36 |
45 |
|
April |
231 |
141 |
46 |
60 |
|
May |
197 |
120 |
42 |
75 |
|
June |
189 |
111 |
26 |
56 |
|
July |
201 |
120 |
48 |
45 |
|
August |
209 |
129 |
42 |
44 |
|
September |
211 |
124 |
35 |
38 |
|
October |
185 |
121 |
40 |
42 |
|
November |
183 |
111 |
37 |
48 |
|
December |
186 |
91 |
37 |
34 |
|
January |
178 |
51 |
30 |
35 |
|
February |
186 |
53 |
25 |
30 |
|
March |
202 |
98 |
21 |
30 |
| |
|
|
|
|
|
2006-07 |
|
|
|
|
|
April |
190 |
118 |
40 |
56 |
|
May |
218 |
120 |
36 |
52 |
|
June |
237 |
113 |
38 |
41 |
| |
|
|
|
|
|
^ : Data are monthly averages. |
between 1-10 year yields increased to 113 basis points at end-June
2006 (from 98 basis points at end-March 2006) but was comparable to that during
the first half of 2005-06. The spread between 10-year and 30-year yields also
increased to 41 basis points (from 30 basis points at end-March 2006) (Table
37).
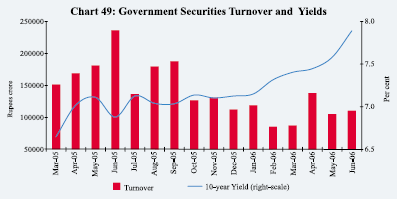
The turnover in Government securities has largely remained
subdued since the second half of 2005-06 as banks preferred to hold securities,
rather than trade, in an environment of hardening of yields (Chart 49).
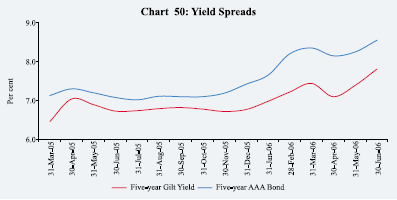
The yields on 5-year AAA-rated corporate bonds increased during
April-June 2006 in tandem with higher yields on Government securities. The yield
spread over 5-year Government securities was 74 basis points at end-June 2006,
lower than that of 91 basis points at end-March 2006 (Chart 50).
Equity Market
Primary Market
Resources raised through the public issues segment jumped by
247 per cent during April-May 2006 over the corresponding period of 2005 (Table
38). The average size of public issues increased from Rs.185 crore during April-May
2005 to Rs.686 crore during April-May 2006. All public issues during April-May
2006 were by non-Government public limited companies (private sector) in the
form of equity. Out of 15 issues during April-May 2006, nine issues were initial
public offerings (IPOs), constituting 93.0 per cent of resource mobilisation,
while during the corresponding period of 2005, eight out of 16 issues were IPOs
(constituting 13.4 per cent of resource mobilisation).
Mobilisation of resources through private placement increased
by 15.5 per cent during 2005-06 as compared with an increase of 30.5 per cent
during 2004-05 (Table 38). Resources mobilised by public sector entities (both
financial and non-financial) increased by 15.9 per cent during 2005-06 as compared
with an increase of 5.2 per cent during 2004-05. Public sector entities accounted
for 57.2 per cent of total mobilisation through private placement during 2005-06
(almost the same ratio as a year ago). Resources raised by financial intermediaries
(both from public sector and private sector) accounted for 68.4 per cent of
the total mobilisation through private placement during 2005-06 (55.8 per cent
during 2004-05).
|
Table 38: Mobilisation of Resources from the Primary Market |
| |
|
|
|
|
(Amount in Rupees crore) |
| |
|
|
|
|
|
|
|
Item |
|
No. of Issues |
Amount |
No. of Issues |
Amount |
| |
|
|
|
|
|
|
|
1 |
|
|
2 |
3 |
4 |
5 |
| |
|
|
|
|
|
|
| |
|
|
2005-06 (April-May) |
2006-07 (April-May) P |
|
A. |
Prospectus and Rights Issues* |
|
|
|
|
| |
1. |
Private Sector (a+b) |
14 |
692 |
15 |
10,290 |
| |
|
a) Financial |
1 |
45 |
1 |
15 |
| |
|
b) Non-financial |
13 |
647 |
14 |
10,275 |
| |
2. |
Public Sector (a+b+c) |
2 |
2,270 |
– |
– |
| |
|
a) Public Sector Undertakings |
– |
– |
– |
– |
| |
|
b) Government Companies |
– |
– |
– |
– |
| |
|
c) Banks/Financial Institutions |
2 |
2,270 |
– |
– |
| |
3. |
Total (1+2) |
16 |
2,962 |
15 |
10,290 |
| |
|
Of which: |
|
|
|
|
| |
|
(i) Equity |
15 |
2,844 |
15 |
10,290 |
| |
|
(ii) Debt |
1 |
118 |
– |
– |
| |
|
|
|
|
|
|
| |
|
|
|
2004-05 |
|
2005-06 P |
|
B. |
Private Placement |
|
|
|
|
| |
1. |
Private Sector |
717 |
35,794 |
944 |
41,205 |
| |
|
a) Financial |
255 |
20,974 |
374 |
26,533 |
| |
|
b) Non-financial |
462 |
14,820 |
570 |
14,652 |
| |
2. |
Public Sector |
193 |
47,611 |
168 |
55,164 |
| |
|
a) Financial |
124 |
25,531 |
138 |
39,395 |
| |
|
b) Non-financial |
69 |
22,080 |
30 |
15,769 |
| |
3. |
Total (1+2) |
910 |
83,405 |
1,112 |
96,368 |
| |
|
Of which: |
|
|
|
|
| |
|
(i) Equity |
908 |
82,822 |
1,111 |
96,218 |
| |
|
(ii) Debt |
2 |
583 |
1 |
150 |
|
Memo: |
|
|
|
|
|
|
Euro Issues |
5 |
1,573 |
15 |
4,614 |
| |
|
|
|
|
|
|
|
P : Provisional. * : Excluding offers for sale. – : Nil/Negligible. |
During April-May 2006, the resources raised through Euro issues –American Depository Receipts (ADRs), Global Depository Receipts (GDRs) and Foreign Currency Convertible Bonds (FCCBs) – by Indian corporates almost trebled to Rs.4,614 crore as corporates took advantage of buoyant secondary markets to raise funds for their investment activities (Table 38).
During the first quarter of 2006-07, net mobilisation of funds by mutual funds increased substantially by 264.7 per cent to Rs.52,053 crore reflecting investor interest due to attractive returns in the secondary market (Table 39). Net mobilisation of funds during the first quarter of 2006-07 was almost at the same level as during the full year 2005-06. Net inflows were witnessed in case of both income/debt-oriented schemes and growth/equity-oriented schemes.
Secondary Market
The domestic stock markets witnessed a mixed trend during the first quarter of 2006-07. Stock markets remained buoyant till May 10, 2006, but
|
Table 39: Resource Mobilisation by Mutual Funds |
| |
|
|
|
|
|
(Rupees crore) |
| |
April-March |
April-June |
| |
2005-06 |
2005-06 |
2006-07 |
|
Mutual Fund |
Net |
Net Assets # |
Net |
Net Assets * |
Net |
Net Assets * |
| |
Mobilisation @ |
|
Mobilisation @ |
|
Mobilisation @ |
|
| |
|
|
|
|
|
|
|
|
1 |
2 |
3 |
4 |
5 |
|
6 |
7 |
| |
|
|
|
|
|
|
|
|
Private Sector |
42,977 |
1,81,515 |
13,288 |
1,30,585 |
43,039 |
2,11,225 |
|
Public Sector |
6,379 |
20,829 |
481 |
11,986 |
4,825 |
24,194 |
|
UTI |
3,424 |
29,519 |
504 |
21,976 |
4,189 |
30,115 |
|
Total |
52,780 |
2,31,862 |
14,273 |
1,64,547 |
52,053 |
2,65,534 |
| |
|
|
|
|
|
|
|
|
@ : Net of redemptions. # : As at end of March. * : As at end of June.
Source : Securities and Exchange Board of India. |
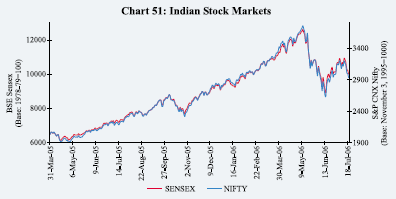
witnessed large correction in the rest of May 2006 (Chart 51).
Both the BSE Sensex and the S&P CNX Nifty closed at all time high levels
of 12612 and 3754, respectively, on May 10, 2006, reflecting continuing support
from FIIs on the back of strong fundamentals, corporate results, upgradation
of India’s sovereign credit rating from stable to positive by Standard &
Poor and upward trend in major international equity markets. Profits after tax
of sample non-financial non-Government companies recorded a growth of more than
40 per cent for 11 successive quarters from October-December 2002 to April-June
2005. Subsequently, growth in profitability has, however, decelerated (Table
40). The stock market witnessed correction beginning from May 11, 2006 mainly
due to net sales by FIIs, fears of rising global interest rates, sharp fall
in metal prices and fears of higher domestic inflation amidst weak trends in
major international equity markets. The BSE Sensex reached 8929 as on June 14,
2006, a decline of 20.8 per cent over end-March 2006. Stock markets, however,
recovered some of
|
Table 40: Corporate Financial Performance |
| |
|
|
|
|
|
|
|
(Growth rate in per cent) |
| |
|
|
|
|
|
|
|
|
|
|
|
|
Item |
2003-04 |
2004-05 |
2005-06* |
2004-05 |
2005-06 |
| |
|
|
|
|
|
|
|
|
|
|
|
| |
|
|
|
Q1 |
Q2 |
Q3 |
Q4 |
Q1 |
Q2 |
Q3 |
Q4* |
| |
|
|
|
|
|
|
|
|
|
|
|
|
1 |
2 |
3 |
4 |
5 |
6 |
7 |
8 |
9 |
10 |
11 |
12 |
| |
|
|
|
|
|
|
|
|
|
|
|
|
Sales |
16.0 |
24.1 |
17.5 |
24.8 |
23.7 |
24.1 |
21.0 |
18.5 |
16.4 |
13.2 |
20.6 |
|
Expenditure |
13.2 |
21.9 |
17.1 |
23.4 |
22.4 |
24.3 |
19.8 |
18.0 |
16.3 |
12.7 |
20.3 |
|
Gross Profit |
25.0 |
32.5 |
20.6 |
36.0 |
35.8 |
30.5 |
35.3 |
32.0 |
19.1 |
21.2 |
18.1 |
|
Interest |
-11.9 |
-5.8 |
2.9 |
-3.2 |
2.1 |
-13.0 |
-5.4 |
-13.5 |
-8.0 |
4.6 |
5.3 |
|
Profit After Tax |
59.8 |
51.2 |
24.1 |
51.2 |
45.3 |
45.5 |
51.4 |
54.2 |
27.5 |
27.0 |
15.6 |
| |
|
|
|
|
|
|
|
|
|
|
|
|
Select Ratios (Per cent) |
| |
|
|
|
|
|
|
|
|
|
|
|
|
Gross Profit to Sales |
11.1 |
11.9 |
13.4 |
12.8 |
13.4 |
12.3 |
13.2 |
13.1 |
13.0 |
12.8 |
13.1 |
|
Profit After Tax to Sales |
5.9 |
7.2 |
9.2 |
7.7 |
8.5 |
8.1 |
9.4 |
8.6 |
8.5 |
8.6 |
9.0 |
|
Interest Coverage Ratio (number) |
3.3 |
4.6 |
6.9 |
4.8 |
5.7 |
6.1 |
7.5 |
6.0 |
6.2 |
6.2 |
7.8 |
|
Interest to Sales |
3.4 |
2.6 |
1.9 |
2.7 |
2.3 |
2.0 |
1.8 |
2.2 |
2.1 |
2.1 |
1.7 |
|
Interest to Gross Profits |
30.7 |
21.8 |
14.5 |
20.9 |
17.5 |
16.4 |
13.4 |
16.6 |
16.2 |
16.2 |
12.9 |
| |
|
|
|
|
|
|
|
|
|
|
|
|
Memo items |
|
|
|
|
|
|
|
(Amount in Rupees crore) |
| |
|
|
|
|
|
|
|
|
|
|
|
|
No. of Companies |
2214 |
2214 |
1410 |
1255 |
1353 |
1464 |
1301 |
2355 |
2361 |
2366 |
1624 |
|
Sales |
4,42,743 |
5,49,449 |
6,63,656 |
1,35,156 |
1,53,040 |
1,62,193 |
1,79,632 |
1,94,608 |
2,12,693 |
2,19,098 |
2,17,731 |
|
Expenditure |
4,22,110 |
5,14,574 |
5,67,263 |
1,15,656 |
1,31,227 |
1,40,574 |
1,56,647 |
1,66,972 |
1,83,717 |
1,88,934 |
1,88,961 |
|
Depreciation Provision |
20,406 |
22,697 |
25,014 |
5,504 |
5,836 |
5,731 |
6,106 |
7,137 |
7,617 |
7,748 |
7,265 |
|
Gross Profit |
49,278 |
65,301 |
89,142 |
17,234 |
20,448 |
20,017 |
23,736 |
25,577 |
27,620 |
28,135 |
28,545 |
|
Interest |
15,143 |
14,268 |
12,894 |
3,597 |
3,584 |
3,273 |
3,177 |
4,241 |
4,467 |
4,555 |
3,669 |
|
Profit After Tax |
26,182 |
39,599 |
60,747 |
10,396 |
13,004 |
13,196 |
16,798 |
16,726 |
18,169 |
18,790 |
19,686 |
| |
|
|
|
|
|
|
|
|
|
|
|
|
* : Data in column (4) and column (12) are provisional.
Note : 1. Growth rates are percentage change in the level for the
period under reference over the corresponding period of the previous year.
2. Data are based on the audited / unaudited abridged results of the non-financial
non-Government companies except column (2)
and column (3) which are based on audited balance sheets for 2003-04 and
2004-05, respectively.
|
the losses during June 2006 reflecting fresh buying by FIIs,
onset of the monsoon and recovery in major international stock markets. The
BSE Sensex was 10007 as on July 19, 2006, around 11 per cent below its end-March
2006 level.
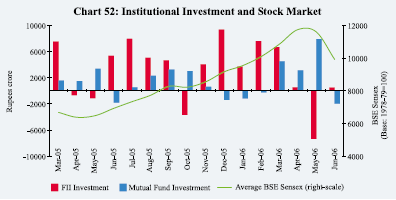
According to the Securities and Exchange Board of India (SEBI)
data, FIIs invested Rs.522 crore in the Indian stock markets during April 2006
but turned net sellers in May to the extent of Rs.7,354 crore. Reflecting the
buying interest, FIIs again invested Rs.480 crore during June 2006. During 2006-07
so far (up to July 14, 2006), FIIs have made net sales of Rs.6,127 crore (US
$ 1.4 billion) as against net purchases of Rs.7,366 crore (US $ 1.7 billion)
during the corresponding period of previous year (Chart 52). On the other hand,
mutual funds have made net investments of Rs.8,311 crore in the current financial
year so far (up to July 14, 2006), substantially higher than that of Rs.2,231
crore during the corresponding period of last year.
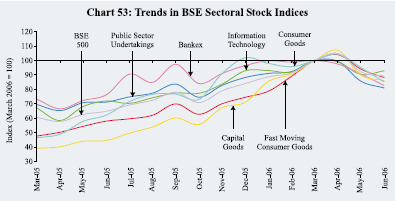
The correction in the stock markets during the first quarter
of 2006-07 was across major indices and sectors (Chart 53). On a point-to-point
basis (up to July 14, 2006), BSE 500 declined by 10.8 per cent, while BSE Small-cap
and BSE Mid-cap registered losses of 19.7 per cent and 18.6 per cent, respectively.
Amongst major sectors, public sector undertakings (PSUs) registered loss of
19.6 per cent over end-March 2006 followed by banking (19.0 per cent), capital
goods
(15.0 per cent), consumer durables (14.2 per cent), fast moving consumer goods
(11.1 per cent) and IT sector (2.3 per cent).
Reflecting the correction in stock prices, the price-earnings
(P/E) ratios declined during the quarter; for instance, the P/E ratio for the
30 scrips included in the BSE Sensex fell from 20.9 at end-March 2006 to 19.4
as on June 30, 2006 (Table 41). The market capitalisation of the BSE declined
by 9.9 per cent between end-March 2006 and end-June 2006. Although volatility
in the stock market increased, domestic stock markets functioned smoothly without
causing any disruption in the financial markets.
|
Table 41: Stock Market Indicators |
|
Indicators |
BSE |
NSE |
| |
|
|
|
|
|
|
|
|
| |
April-March |
April-June |
April-March |
April-June |
| |
2004-05 |
2005-06 |
2005-06 |
2006-07 |
2004-05 |
2005-06 |
2005-06 |
2006-07 |
|
1 |
2 |
3 |
4 |
5 |
6 |
7 |
8 |
9 |
|
BSE Sensex / S&P CNX Nifty |
|
|
|
|
|
|
|
|
|
End-period |
6493 |
11280 |
7194 |
10609 |
2036 |
3403 |
2221 |
3128 |
|
Average |
5741 |
8279 |
6608 |
11032 |
1805 |
2513 |
2044 |
3263 |
|
Volatility |
11.16 |
16.72 |
4.28 |
9.12 |
11.28 |
15.60 |
4.04 |
9.62 |
|
P/E Ratio (end-period)* |
15.61 |
20.92 |
16.03 |
19.40 |
14.60 |
20.26 |
14.31 |
18.44 |
|
Turnover (Rupees crore) |
5,18,716 |
8,16,074 |
1,39,648 |
2,55,320 |
11,40,071 |
15,69,556 |
2,80,917 |
5,29,831 |
|
Market Capitalisation |
|
|
|
|
|
|
|
|
|
(Rupees crore) (end-period) |
16,98,429 |
30,22,191 |
18,50,377 |
27,21,677 |
15,85,585 |
28,13,210 |
17,27,502 |
25,24,659 |
| |
|
|
|
|
|
|
|
|
|
* : For 30 scrips included in the BSE Sensex and 50 scrips included in the S&P CNX Nifty.
Source: The Stock Exchange, Mumbai (BSE) and National Stock Exchange of India Ltd. (NSE). |
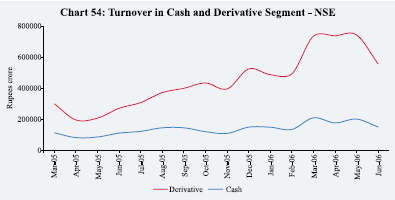
At the NSE, the total turnover in the cash segment during April-June
2006 at Rs.5,29,831 crore was more than double over the corresponding period
of 2005 (Chart 54). The total turnover in the derivative segment during April-June
2006 increased sharply by 202 per cent over the corresponding period of the
previous year to Rs.20,37,019 crore.
|