|
Monetary Survey
Monetary and liquidity conditions, after some tightening during
the last four months of 2005-06, remained comfortable during the first quarter
of 2006-07 despite sustained growth of bank credit. Liquidity conditions eased
following reduction in the Centre’s surplus balances with the Reserve Bank and
injection of liquidity arising from the Reserve Bank’s foreign exchange interventions.
The Reserve Bank, accordingly, reverted back to absorption of liquidity through
operations under the liquidity adjustment facility (LAF) and issuance of securities
under the market stabilisation scheme (MSS). Reserve money growth during the
fiscal year 2006-07 so far has been driven by accretion to the Reserve Bank’s
net foreign assets (NFA) as against an accumulation in domestic assets during
2005-06. Bank deposits recorded strong growth during the first quarter of 2006-07
and were able to finance the continued demand for bank credit1 .
Banks’ investments in Government securities recorded an increase during April-June
2006 after declining in the previous two quarters. Concomitantly, broad money
(M3) growth – at 18.8 per cent as on July 7, 2006 – was above
the indicative trajectory of 15.0 per cent projected in the Annual Policy Statement
in the beginning of the year (April 2006). Expansion in the residency-based
new monetary aggregate (NM3) was higher than M3 on account of continued
raising of resources from the call/term
market and redemption of India Millennium Deposits (IMDs) –
non-resident repatriable foreign currency deposits such as IMDs are included
in M3 but not directly reckoned in NM3 (Table 14).
Increase in demand for currency during the first quarter of
2006-07 was higher than that during the corresponding period of the previous
year (Table 15). On a year-on-year (y-o-y) basis, growth in currency with the
public increased from 13.7 per cent as on July 8, 2005 to 16.3 per cent as on
July 7, 2006 in consonance with acceleration in economic activity.
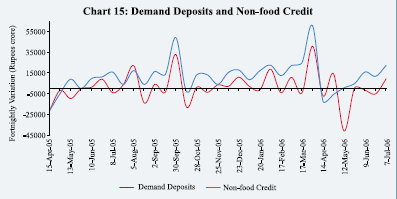
While demand deposits declined
during the first quarter of 2006-07, increase in time deposits was sharply higher
than the position a year ago. The decline in demand deposits during the quarter
ended June 2006 could be partly attributed to unwinding of the large accretion
during the previous quarter ended March 2006
1 Data on financial year variation
during 2006-07 are not comparable with those of 2005-06 as the financial year
variation for scheduled commercial banks’ (SCBs) data for 2006-07 is worked
out from March 31, 2006 whereas the corresponding variation during 2005-06
is worked out from March 18, 2005 (which are the last reporting Fridays for
the respective years). For the purpose of comparability, the analysis of key
banking and monetary aggregates for the financial year 2005-06 in this Chapter
is based on variations over April 1, 2005.
|
Table 14: Monetary Indicators |
| |
|
|
|
|
|
|
|
|
|
| |
|
|
|
|
|
|
|
(Amount in Rupees crore) |
| |
|
|
|
|
|
|
|
|
|
|
Item |
|
|
|
Outstanding |
Variation (Year-on-Year) |
| |
|
|
|
|
as on |
|
|
|
|
| |
|
|
|
|
|
July 8, 2005 |
July 7, 2006 |
| |
|
|
|
|
July 7, |
|
|
|
|
| |
|
|
|
|
2006 |
Amount |
Per cent |
Amount |
Per cent |
|
1 |
|
|
|
|
2 |
3 |
4 |
5 |
6 |
| |
|
|
|
|
|
|
|
|
|
|
I. |
Reserve Money* |
5,88,231 |
77,488 |
18.0 |
81,290 |
16.0 |
|
II. |
|
|
|
|
28,20,649 |
2,90,207 |
13.9 |
4,47,252 |
18.8 |
| |
Broad Money (M3) |
|
|
|
|
|
| |
|
|
|
|
|
(2,86,694) |
(13.8) |
|
|
| |
a) |
|
Currency with the Public |
4,38,188 |
45,381 |
13.7 |
61,548 |
16.3 |
| |
b) |
Aggregate Deposits |
23,75,782 |
2,44,575 |
14.0 |
3,83,919 |
19.3 |
| |
|
|
i) |
Demand Deposits |
3,73,084 |
56,148 |
23.5 |
77,532 |
26.2 |
| |
|
|
ii) |
Time Deposits |
20,02,698 |
1,88,427 |
12.5 |
3,06,387 |
18.1 |
| |
|
|
|
|
|
(1,84,914) |
(12.3) |
|
|
| |
|
|
of which: Non-Resident |
|
|
|
|
|
| |
|
|
Foreign Currency Deposits |
62,797 |
-580 |
-0.7 |
-14,068 |
-18.3 |
|
III. |
|
|
|
|
28,34,282 |
3,29,007 |
16.2 |
4,69,501 |
19.9 |
| |
NM |
3 |
|
|
|
|
|
|
| |
|
|
|
|
|
(2,90,319) |
(14.3) |
|
|
| |
of which: Call Term Funding |
83,642 |
41,280 |
139.0 |
12,660 |
17.8 |
| |
from Financial Institutions |
|
(6,105) |
(20.6) |
|
|
|
IV. |
a) |
|
|
|
29,09,178 |
3,00,821 |
14.3 |
4,64,514 |
19.0 |
| |
|
|
L1 |
|
|
|
|
|
|
| |
of which: Postal Deposits |
1,03,789 |
17,424 |
23.1 |
10,919 |
11.8 |
| |
b) |
|
|
29,12,110 |
2,97,585 |
14.1 |
4,64,220 |
19.0 |
| |
|
|
L2 |
|
|
|
|
|
|
| |
of which: FI Deposits |
2,932 |
-3,236 |
-50.1 |
-294 |
-9.1 |
| |
c) |
|
|
|
29,33,804 |
2,99,158 |
14.0 |
4,65,117 |
18.8 |
| |
|
|
L3 |
|
|
|
|
|
|
| |
of which: NBFC Deposits |
21,694 |
1,573 |
8.2 |
897 |
4.3 |
| |
|
|
|
|
|
|
|
|
|
|
V. |
Major Sources of Broad Money |
|
|
|
|
|
| |
a) |
|
Net Bank Credit to the Government (i+ii) |
8,02,655 |
11,790 |
1.6 |
31,687 |
4.1 |
| |
|
|
|
|
|
(-403) |
(-0.1) |
|
|
| |
|
|
i) |
Net Reserve Bank Credit |
-2,191 |
-6,529 |
– |
3,068 |
– |
| |
|
|
|
to Government |
|
|
|
|
|
| |
|
|
|
of which: to the Centre |
-2,344 |
-3,686 |
– |
3,265 |
– |
| |
|
|
ii) |
Other Banks’ Credit to Government |
8,04,846 |
18,318 |
2.4 |
28,619 |
3.7 |
| |
|
|
|
|
|
(6,126) |
(0.8) |
|
|
| |
b) |
Bank Credit to Commercial Sector |
17,31,749 |
2,99,955 |
28.4 |
3,74,438 |
27.6 |
| |
|
|
|
|
|
(2,67,073) |
(25.3) |
|
|
| |
c) |
|
Net Foreign Exchange Assets of |
8,02,596 |
47,558 |
8.2 |
1,74,453 |
27.8 |
| |
|
|
Banking Sector |
|
|
|
|
|
| |
|
|
|
|
|
|
|
|
|
|
Memo: |
|
|
|
|
|
|
|
| |
|
|
|
|
|
|
|
|
|
|
Scheduled Commercial Bank’s Aggregate Deposits |
21,77,547 |
2,37,533 |
15.2 |
3,72,977 |
20.7 |
| |
|
|
|
|
|
(2,34,020) |
(14.9) |
|
|
|
Scheduled Commercial Bank’s Non-food Credit |
15,04,135 |
2,93,046 |
34.9 |
3,71,993 |
32.9 |
| |
|
|
|
|
|
(2,60,164) |
(31.0) |
|
|
| |
|
|
|
|
|
|
|
|
|
|
FIs: Financial Institutions. NBFCs: Non-Banking Financial Companies.
*: Data pertain to July 14, 2006.
NM3 is the residency-based broad money aggregate and L1,L2
and L3 are liquidity aggregates compiled on the
recommendations of the Working Group on Money Supply (Chairman: Dr. Y.V.
Reddy, 1998). Liquidity aggregates are defined as follows:
L1 = NM3 + Select deposits with the post office
saving banks.
L2 = L1 +Term deposits with term lending institutions
and refinancing institutions (FIs) + Term borrowing by Fis
+ Certificates of deposits issued by FIs.
L3 = L2 + Public deposits of non-banking financial
companies.
Note :
1. Data are provisional.
2. Figures in parentheses are adjusted for the effect of conversion of
a non banking entity into a
banking entity on October 11, 2004.
3. Liquidity aggregates pertain to end-June and are adjusted for conversion
effect.
4. Data on non-resident foreign currency deposits reflect redemption of
India Millennium Deposits (IMDs) on December 29, 2005.
|
|
Table 15: Monetary Aggregates – Variations |
| |
|
|
|
|
|
|
|
|
(Rupees crore) |
| |
|
|
Variation during |
| |
|
|
|
|
|
|
|
|
|
|
| |
|
|
2005-06 |
2005-06 |
2006-07 |
2005-06 |
2006-07 |
| |
|
|
(April- |
(upto |
(up to |
|
|
|
|
|
| |
|
|
|
|
|
Q1 |
Q2 |
Q3 |
Q4 |
Q1 |
| |
|
|
March)* |
July 8) |
July 7) |
|
|
|
|
|
|
1 |
|
|
2 |
3 |
4 |
5 |
6 |
7 |
8 |
9 |
| |
|
|
|
|
|
|
|
|
|
|
| |
(=1+2+3=4+5+6+7-8) |
4,78,086 |
40,730 |
91,114 |
27,448 |
1,22,457 |
45,106 |
2,01,857 |
58,060 |
|
M3 |
|
|
|
|
|
|
|
|
|
|
| |
|
|
|
[1,21,948] |
|
[1,08,666] |
|
|
|
|
|
Components |
|
|
|
|
|
|
|
|
|
1. |
Currency with the Public |
57,280 |
21,770 |
25,046 |
20,492 |
-10,835 |
30,124 |
18,491 |
25,795 |
| |
|
|
|
[20,778] |
|
[19,500] |
|
|
|
|
|
2. |
Aggregates Deposits with Banks |
4,20,406 |
20,386 |
66,268 |
8,819 |
1,32,531 |
15,729 |
1,80,958 |
33,115 |
| |
|
|
|
[1,02,754] |
|
[91,188] |
|
|
|
|
| |
2.1 |
Demand Deposits with Banks |
1,20,069 |
-25,812 |
-32,140 |
-21,953 |
41,566 |
-2,357 |
66,604 |
-41,704 |
| |
|
|
|
[10,397] |
|
[14,256] |
|
|
|
|
| |
2.2 |
Time Deposits with Banks |
3,00,336 |
46,197 |
98,408 |
30,772 |
90,965 |
18,086 |
1,14,354 |
74,818 |
| |
|
|
|
[92,357] |
|
[76,932] |
|
|
|
|
|
3. |
‘Other’ Deposits with Banks |
401 |
-1,426 |
-200 |
-1,862 |
761 |
-747 |
2,408 |
-849 |
|
Sources |
|
|
|
|
|
|
|
|
|
4. |
Net Bank Credit to Government |
12,326 |
22,261 |
33,562 |
17,398 |
-5,017 |
-5,722 |
13,726 |
20,090 |
| |
|
|
|
[14,201] |
|
[9,339] |
|
|
|
|
| |
4.1 |
RBI’s net credit to Government |
26,111 |
22,403 |
-10,328 |
18,963 |
-25,251 |
19,879 |
22,208 |
53 |
| |
|
|
|
[12,716] |
|
[9,275] |
|
|
|
|
| |
4.2 |
Other Bank’s Credit to Government |
-13,785 |
-142 |
43,890 |
-1,565 |
20,234 |
-25,601 |
-8,481 |
20,037 |
| |
|
|
|
[1,485] |
|
[63] |
|
|
|
|
|
5. |
Bank Credit to Commercial Sector |
4,10,712 |
26,053 |
40,789 |
10,235 |
1,18,712 |
61,731 |
1,69,025 |
21,879 |
| |
|
|
|
[77,062] |
|
[61,245] |
|
|
|
|
|
6. |
Net Foreign Exchange Assets of |
76,939 |
-19,760 |
76,402 |
-12,026 |
24,062 |
27,701 |
38,554 |
71,845 |
| |
Banking Sector |
|
[-21,112] |
|
[-13,378] |
|
|
|
|
| |
6.1 |
Net Foreign Exchange Assets of RBI |
60,193 |
-20,977 |
76,402 |
-13,243 |
24,823 |
23,741 |
26,224 |
71,845 |
|
7. |
Government’s Currency Liabilities to Public |
1,306 |
384 |
64 |
384 |
910 |
-100 |
112 |
64 |
|
8. |
Net Non-Monetary liabilities of |
23,197 |
-11,792 |
59,702 |
-11,456 |
16,210 |
38,504 |
19,560 |
55,818 |
| |
Banking Sector |
|
[-51,412] |
|
[-51,077] |
|
|
|
|
|
Memo: |
|
|
|
|
|
|
|
|
|
| |
|
|
|
|
|
|
|
|
|
|
|
1. |
Non-resident Foreign Currency |
-17,130 |
713 |
3,521 |
804 |
187 |
1,856 |
-19,723 |
2,992 |
| |
Deposits with SCBs |
|
[460] |
|
[550] |
|
|
|
|
|
2. |
SCBs’ Call-term Borrowing from |
13,621 |
-939 |
498 |
-1,002 |
7,359 |
1,836 |
3,031 |
2,990 |
| |
Financial Institutions |
|
[1,459] |
|
[1,395] |
|
|
|
|
|
3. |
Overseas Borrowing by SCBs |
4,169 |
-630 |
732 |
-925 |
3,618 |
-622 |
-775 |
3,425 |
| |
|
|
|
[2,244] |
|
[1,948] |
|
|
|
|
|
4. |
SCBs’ Non-food Credit |
4,07,078 |
19,948 |
37,749 |
4,205 |
1,20,290 |
61,394 |
1,68,303 |
15,484 |
| |
|
|
|
[72,834] |
|
[57,091] |
|
|
|
|
| |
|
|
|
|
|
|
|
|
|
|
|
* Variation during March 31, 2005 and March 31, 2006.
Note:
1. Data on fiscal year variation for 2005-06 are not comparable with those of the previous years as the data for 2005-06
include 27 fortnights while usually the data for a year include 26 fortnights. Moreover, the last reporting Friday of 2005-06
coincided with March 31, the closing day for banks’ accounts.
2. Variation during 2006-07 is worked out from March 31, 2006 whereas the corresponding variation during 2005-06
is worked out from April 1, 2005. Figures in [ ] are variations for 2005-06 worked out over March 31, 2005
(which incorporate scheduled commer- cial banks’ data as on March 18, 2005). |
(Rs.66,604 crore), redemption pressures
on mutual funds and decline in the number of public issues during June 2006.
On a y-o-y basis, growth in demand deposits at 26.2 per cent as on July 7, 2006
was, however, higher than that a year ago (23.5 per cent). The strong growth
in y-o-y demand deposits could be attributed to a variety of factors such as
sharp rise in non-food credit, higher resource mobilisation through the primary
capital market, and large mobilisation by domestic mutual funds, with funds
getting temporarily parked in demand deposits pending utilisation (Chart 15).
Scheduled commercial banks’ time
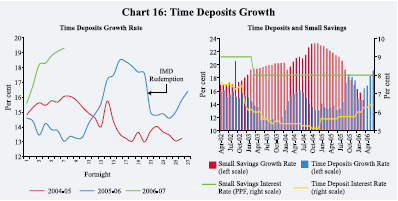
deposits growth at 19.3 per cent (y-o-y) as on July 7, 2006 was higher than
that recorded a year ago (13.4 per cent; net of the conversion effect) reflecting
the higher interest rates as well as the base effect. Interest rates on time
deposits of 1-3 year maturity offered by public sector banks have increased
from 5.75-6.75 per cent in March 2006 to 5.75-7.00 per cent by June 2006. Rates
offered by private sector banks on similar maturity deposits moved from a range
of 5.50-7.75 per cent to 6.50-7.75 per cent over the same period. Concomitantly,
growth in postal deposits, which was on a upward trajectory between April 2003
and December 2004, moderated to 14.6 per cent (y-o-y) as at end-March 2006 from
its recent peak of 23.3 per cent in December 2004 (Chart 16).
Demand for bank credit from the
commercial sector remained strong during the first quarter of 2006-07. Bank
credit to commercial sector expanded by Rs.40,789 crore during the financial
year 2006-07 (up to July 7, 2006), higher than that of Rs.26,053 crore during
the corresponding period of the previous year (see Table 15). Scheduled commercial
banks’ (SCBs) non-food credit, on a year-on-year basis, registered a growth
of 32.9 per cent as on July 7, 2006 on top of a base as high as 31.0 per cent
a year ago. Reflecting the acceleration in deposits growth, incremental credit-deposit
ratio of SCBs has shown some moderation in recent months but still remains high,
hovering around 100 per cent (Chart 17). Scheduled commercial banks’ food credit,
however, witnessed a decline of Rs.2,837 crore during the financial year 2006-07
(up to July 7, 2006) – reflecting lower order of procurement of foodgrains –
as compared with an increase of Rs.4,801 crore during the corresponding period
of the previous year.
Disaggregated available data for
2005-06 show that almost 30 per cent of incremental non-food credit went to
the industrial sector, while over 14 per cent of incremental non-food credit
was on account of housing loans and another 12 per cent of incremental non-food
credit was absorbed by the agricultural sector and allied activities (Table
16). The increase in industrial credit in consonance with sustained growth in
domestic industrial production was mainly on account of infrastructure (viz.,
power, roads, ports and telecommunications), construction, textiles, iron and
steel, chemicals, petroleum, vehicles and food processing industries. Infrastructure
sector alone accounted for about one fourth of incremental credit to the industry,
while textiles and iron and steel industries absorbed another one-fourth of
the incremental credit to the industry. Credit to agriculture recorded a robust
growth, reflecting the impact of various policy initiatives to improve the flow
|
Table 16: Sectoral Deployment of Non-food Bank Credit |
| |
|
|
|
|
|
|
| |
|
|
|
(Amount in Rupees crore) |
| |
|
|
|
|
|
|
| |
|
Outstanding |
Variation |
| |
|
as on |
|
|
|
|
|
Sector / Industry |
|
2004-05 |
2005-06 |
| |
|
March 31, |
|
|
|
|
| |
|
2006 |
|
|
|
|
| |
|
|
Absolute |
Per cent |
Absolute |
Per cent |
| |
|
|
|
|
|
|
|
1 |
|
2 |
3 |
4 |
5 |
6 |
| |
|
|
|
|
|
|
|
Non-food Gross Bank Credit (1 to 6) |
14,05,146 |
1,88,069 |
25.8 |
4,05,358 |
40.5 |
|
1. |
Agriculture and Allied Activities |
1,72,292 |
31,774 |
35.1 |
47,042 |
37.6 |
|
2. |
Industry (Small, Medium and Large) |
5,49,057 |
62,014 |
19.8 |
1,22,165 |
28.6 |
| |
Of which, Small Scale Industries |
90,239 |
8,051 |
12.2 |
15,651 |
21.0 |
|
3. |
Services |
48,137 |
n.a. |
n.a. |
17,553 |
57.4 |
| |
Transport Operators |
16,101 |
n.a. |
n.a. |
6,502 |
67.7 |
| |
Professional and Other Services |
16,070 |
n.a. |
n.a. |
2,809 |
21.2 |
|
4. |
Personal Loans |
3,53,777 |
n.a. |
n.a. |
1,08,697 |
44.4 |
| |
Consumer Durables |
8,783 |
108 |
1.3 |
-300 |
-3.3 |
| |
Housing |
1,86,429 |
n.a. |
n.a. |
57,701 |
44.8 |
| |
|
|
(23,192) |
(44.6) |
|
|
| |
Advances against Fixed Deposits |
34,897 |
3,259 |
12.4 |
5,047 |
16.9 |
| |
Advances to Individuals against Shares, Bonds |
5,089 |
366 |
18.1 |
972 |
23.6 |
| |
Credit Card Outstandings |
9,177 |
n.a. |
n.a. |
3,417 |
59.3 |
| |
Education |
10,057 |
n.a. |
n.a. |
4,938 |
96.5 |
|
5. Trade |
81,402 |
31,262 |
125.7 |
23,454 |
40.5 |
|
6. Others |
2,00,481 |
n.a. |
n.a. |
86,447 |
75.8 |
| |
Real Estate Loans |
26,682 |
7,622 |
136.7 |
13,380 |
100.6 |
| |
Non-Banking Financial Companies |
30,942 |
2,501 |
14.9 |
8,458 |
37.6 |
| |
|
|
|
|
|
|
|
Memo: |
|
|
|
|
|
| |
|
|
|
|
|
|
|
Priority Sector |
5,09,910 |
1,06,235 |
40.3 |
1,28,434 |
33.7 |
|
Industry (Small, Medium and Large) |
5,49,057 |
62,014 |
19.8 |
1,22,165 |
28.6 |
| |
Food Processing |
30,843 |
1,109 |
5.4 |
6,410 |
26.2 |
| |
Textiles |
57,716 |
4,648 |
13.6 |
13,739 |
31.2 |
| |
Paper and Paper Products |
9,216 |
-228 |
-3.8 |
2,336 |
33.9 |
| |
Petroleum, Coal Products and Nuclear Fuels |
24,103 |
1,426 |
10.6 |
8,534 |
54.8 |
| |
Chemicals and Chemical Products |
48,935 |
1,661 |
5.4 |
9,443 |
23.9 |
| |
Rubber, Plastic and their Products |
6,989 |
717 |
27.7 |
3,323 |
90.6 |
| |
Iron and Steel |
50,385 |
3,120 |
11.9 |
14,384 |
40.0 |
| |
Other Metal and Metal Products |
14,436 |
1,938 |
23.7 |
2,800 |
24.1 |
| |
All Engineering |
34,666 |
273 |
1.0 |
5,270 |
17.9 |
| |
Vehicles, Vehicle Parts and Transport Equipments |
18,667 |
2,900 |
54.7 |
6,805 |
57.4 |
| |
Gems and Jewellery |
19,866 |
3,013 |
32.8 |
5,560 |
38.9 |
| |
Construction |
13,867 |
1,708 |
28.6 |
5,745 |
70.7 |
| |
Infrastructure |
1,08,787 |
21,829 |
42.5 |
29,778 |
37.7 |
| |
|
|
|
|
|
|
|
n.a. : Not available.
Note :
1. Data are provisional and relate to select scheduled commercial
banks which account for over 90 per cent of bank credit of all scheduled
commercial banks.
2. Owing to change in classification of sectors/industries and coverage
of banks, data for 2005 06 are not
comparable with earlier data. Figures in parentheses for 2004-05 pertain
only to housing loans of above Rs.15 lakh.
Data on housing loans for 2005-06, on the other hand, are also inclusive
of loans less than Rs.15 lakh.
|
of credit to the sector. Credit to the housing sector continued to be strong, benefiting from low interest rates and tax incentives. Apart from housing, strong credit demand emanated from education and other personal loans as well as from credit card holders. Credit to the commercial real estate continued to increase sharply, constituting around three per cent of incremental non-food credit.
|
Table 17: Select Sources of Funds to Industry |
| |
|
|
|
|
|
|
|
|
|
|
| |
|
|
|
|
|
|
|
|
(Rupees crore) |
| |
|
|
|
|
|
|
|
|
|
|
| |
Item |
|
2005-06 |
2005-06 |
2006-07 |
| |
|
|
|
(April-March) |
|
|
|
|
|
| |
|
|
|
|
|
Q1 |
Q2 |
Q3 |
Q4 |
Q1 |
| |
|
|
|
|
|
|
|
|
|
|
|
1 |
|
|
|
|
2 |
3 |
4 |
5 |
6 |
7 |
| |
|
|
|
|
|
|
|
|
|
|
|
A. |
Bank Credit to Industry |
1,22,165 |
11,148 |
28,061 |
24,484 |
58,472 |
– |
| |
|
|
|
|
|
|
|
|
|
|
|
B. |
Flow from Non-banks to Corporates |
|
|
|
|
|
|
| |
1 |
|
Capital Issues (i+ii) |
12,661 |
1,264 |
2,758 |
5,549 |
3,090 |
10,275 * |
| |
|
|
i) |
Non-Government Public Ltd. Companies (a+b) |
12,288 |
1,264 |
2,758 |
5,549 |
2,717 |
10,275 * |
| |
|
|
|
a) Bonds/Debentures |
118 |
118 |
0 |
0 |
0 |
0 * |
| |
|
|
|
b) Shares |
12,170 |
1,146 |
2,758 |
5,549 |
2,717 |
0 * |
| |
|
|
ii) |
PSUs and Government Companies |
373 |
0 |
0 |
0 |
373 |
0 * |
| |
|
2 |
ADR/GDR Issues |
6,445 |
789 |
739 |
3,643 |
1,274 |
3,793 * |
| |
|
3 |
External Commercial Borrowings (ECBs) |
40,496 |
4,326 |
12,989 |
9,132 |
14,049 |
– |
| |
|
4 |
Issue of CPs |
-1,517 |
3,562 |
1,928 |
-2,491 |
-4,516 |
4,203 |
| |
|
|
|
|
|
|
|
|
|
|
|
C. |
Depreciation Provision ++ |
25,014 |
7,137 |
7,617 |
7,748 |
7,265 |
– |
| |
|
|
|
|
|
|
|
|
|
|
|
D. |
Profit after Tax ++ |
60,747 |
16,726 |
18,169 |
18,790 |
19,686 |
– |
| |
|
|
|
|
|
|
|
|
|
|
|
* : Pertain to April-May, 2006.
++ : Data are based on audited/ unaudited abridged results of select sample of non-financial non-Government companies.
Quarterly variations may not add up to annual variation due to difference in coverage of companies.
Note :
1. Data are provisional.
2. Data on capital issues pertain to gross issuances excluding issues by banks and financial institutions.
Figures are not adjusted for banks’ investments in capital issues, which are not expected to be significant.
Data on ADR/GDR issues exclude issuances by banks and financial institutions.
3. Data on external commercial borrowings include short-term credit. Data for 2005-06 are exclusive of the IMD redemption. |
The corporate sector continued to augment its recourse to bank credit with a variety of other sources. Equity issuances in the domestic market during April-May 2006 were substantially higher as corporates took advantage of buoyancy in the secondary market. Mobilisation through external commercial borrowings (ECBs) remained strong during 2005-06. Mobilisation through issuances of commercial papers, after remaining subdued during the second half of 2005-06, staged a turnaround during the first quarter of 2006-07. Internal sources – backed by strong corporate sector profitability – continued to constitute a significant source of funds for the corporate sector (Table 17).
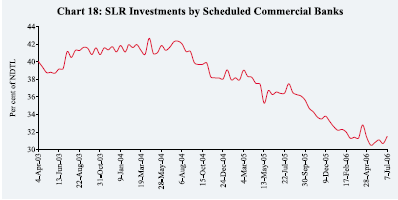
In view of strong credit demand, apart from increasing their deposit mobilisation efforts, banks continued with recourse to funding from financial institutions as well as borrowings from abroad. Raising funds through equity issuances in the primary market as well as large internal reserves also helped banks to fund credit demand. Furthermore, banks continued to restrict their incremental investments in Government papers to fund demand for credit (Table 18). On a year-on-year basis, commercial banks’ holding of Government and other approved securities increased by 3.8 per cent as on July 7, 2006 as against a decline of 0.4 per cent a year ago. In the current fiscal year so far (up to July 7, 2006), commercial banks’ investment in such securities registered an increase of Rs.49,697 crore, reflecting acceleration in deposit growth. Commercial banks’ holding of Government securities fell from over 36 per cent
|
Table 18: Scheduled Commercial Bank’s Survey |
| |
|
(Amount in Rupees crore) |
| |
|
|
|
|
|
Item |
Variation (year-on-year) |
| |
As on July 08, 2005 |
As on July 07, 2006 |
| |
Amount |
Per cent |
Amount |
Per cent |
|
1 |
2 |
3 |
4 |
5 |
|
Sources of Funds |
|
|
|
|
|
Aggregate Deposits |
2,34,020 |
14.9 |
3,72,977 |
20.7 |
|
Call/Term Funding from Financial Institutions |
6,105 |
20.6 |
12,660 |
17.8 |
|
Overseas Foreign Currency Borrowings |
7,326 |
35.6 |
2,657 |
9.5 |
|
Capital and Reserves |
37,255 |
30.8 |
30,248 |
19.1 |
| |
|
|
|
|
|
Uses of Funds |
|
|
|
|
|
Bank Credit |
2,61,524 |
29.6 |
3,65,031 |
31.0 |
|
Investments in Government Securities |
-69 |
– |
25,079 |
3.5 |
|
Investments in Other Approved Securities |
-2,806 |
-12.5 |
2,942 |
15.0 |
|
Investments in Non-SLR Securities |
2,527 |
1.8 |
10,668 |
7.6 |
|
Foreign Currency Assets |
-2,731 |
-8.8 |
3,458 |
12.2 |
|
Balances with the RBI |
26,060 |
37.2 |
19,542 |
20.3 |
| |
|
|
|
|
|
Note: 1. Data are provisional.
2. Variations of select aggregates are adjusted for the effect of conversion of a
non-banking entity into a banking entity on October 11, 2004. |
of their net demand and time liabilities (NDTL) as on July 8, 2005 to 31.5
per cent as on July 7, 2006 (Chart 18).
Reserve Money Survey
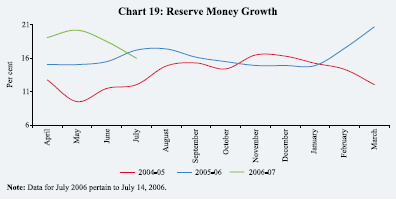
Reserve money growth at 16.0 per cent, y-o-y, as on July 14, 2006 was lower
than that a year ago (18.0 per cent) (Chart 19)
Growth of reserve money during the financial year 2006-07 (up to July 14, 2006)
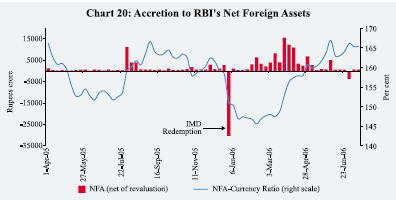
was driven largely by expansion in the Reserve Bank’s net foreign assets
(NFA) in contrast to being driven by accretion to its domestic
assets during the corresponding period of 2005-06. The Reserve Bank’s foreign
currency assets (net of revaluation) have increased by Rs.29,894 crore during
the fiscal year 2006-07 so far as compared with an increase of Rs.6,094 crore
during the corresponding period of the previous year (Table 19 and Chart 20).
|
Table 19: Major Components and Sources of Reserve Money |
| |
|
|
|
|
|
|
(Rupees crore) |
| |
Variation during |
| |
|
|
|
|
|
|
|
|
| |
2005-06 |
2005-06 |
2006-07 |
2005-06 |
2006-07 |
| |
(April- |
(up to |
(up to |
|
|
|
|
|
| |
|
|
|
Q1 |
Q2 |
Q3 |
Q4 |
Q1 |
| |
March) |
July 15) |
July 14) |
|
|
|
|
|
| |
|
|
|
|
|
|
|
|
|
1 |
2 |
3 |
4 |
5 |
6 |
7 |
8 |
9 |
| |
|
|
|
|
|
|
|
|
|
Reserve Money |
83,930 |
17,806 |
15,165 |
7,177 |
1,062 |
25,440 |
50,251 |
15,215 |
|
Components |
|
|
|
|
|
|
|
|
|
Currency in Circulation |
62,015 |
19,536 |
23,646 |
19,877 |
-9,479 |
29,154 |
22,462 |
23,268 |
|
Bankers’ Deposits with RBI |
21,515 |
-171 |
-8,214 |
-10,680 |
9,780 |
-2,967 |
25,382 |
-7,204 |
|
Other Deposits with RBI |
401 |
-1,559 |
-266 |
-2,021 |
761 |
-747 |
2,408 |
-849 |
|
Sources |
|
|
|
|
|
|
|
|
|
RBI’s net credit to Government Sector |
26,111 |
20,407 |
-4,754 |
9,275 |
-25,251 |
19,879 |
22,208 |
53 |
|
of which: to Centre |
28,417 |
25,530 |
-1,736 |
14,600 |
-25,251 |
19,812 |
19,256 |
3,071 |
|
RBI’s Credit to Banks and Commercial Sector |
535 |
-1,663 |
-3,082 |
1,155 |
-1,869 |
101 |
1,148 |
-3,135 |
|
NFEA of RBI |
60,193 |
-20,941 |
78,467 |
-14,595 |
24,823 |
23,741 |
26,224 |
71,845 |
|
Govt’s Currency Liabilities to the Public |
1,306 |
384 |
64 |
384 |
910 |
-100 |
112 |
64 |
|
Net Non-Monetary liabilities of RBI |
4,215 |
-19,619 |
55,530 |
-10,957 |
-2,450 |
18,180 |
-559 |
53,612 |
|
Memo: |
|
|
|
|
|
|
|
|
| |
|
|
|
|
|
|
|
|
|
Net Domestic Assets |
23,737 |
38,747 |
-63,302 |
21,771 |
-23,760 |
1,700 |
24,027 |
-56,631 |
|
FCA, adjusted for revaluation |
68,834 |
6,094 |
29,894 |
5,034 |
23,665 |
11,998 |
28,137 |
28,107 |
|
Net Purchases from Authorised Dealers |
32,884 |
-467 |
21,545* |
0 |
17,027 |
0 |
15,857 |
21,545* |
|
NFEA/RM (per cent) (end-period) |
117.4 |
116.7 |
127.7 |
120.5 |
125.3 |
123.7 |
117.4 |
126.6 |
|
NFEA/Currency (per cent) (end-period) |
156.3 |
152.5 |
165.4 |
154.0 |
164.4 |
158.4 |
156.3 |
164.1 |
| |
|
|
|
|
|
|
|
|
|
NFEA : Net Foreign Exchange Assets. FCA : Foreign Currency Assets. RM : Reserve Money.
* : Up to May 26, 2006.
Note: Data are based on March 31 for Q4 and last reporting Friday for all other quarters. |
Mirroring the liquidity absorption operations through LAF,
the Reserve Bank’s holdings of Government securities declined by Rs.30,766 crore
during the financial year 2006-07 (up to July 14) as against an increase of
Rs.15,993 crore in the corresponding period of 2005-06. Over the same period,
there was a decline
|
Table 20: Net Reserve Bank Credit to the Centre |
| |
|
|
|
|
|
|
|
|
(Rupees crore) |
| |
|
|
Variation during |
| |
|
|
|
|
|
|
|
|
|
|
|
Item |
|
2005-06 |
2005-06 |
2006-07 |
2005-06 |
2006-07 |
| |
|
|
(April- |
(up to |
(up to |
|
|
|
|
|
| |
|
|
|
|
|
Q1 |
Q2 |
Q3 |
Q4 |
Q1 |
| |
|
|
March) |
July 15) |
July 14) |
|
|
|
|
|
| |
|
|
|
|
|
|
|
|
|
|
|
1 |
|
|
2 |
3 |
4 |
5 |
6 |
7 |
8 |
9 |
| |
|
|
|
|
|
|
|
|
|
|
|
Net Reserve Bank Credit to the Centre |
28,417 |
25,530 |
-1,736 |
14,600 |
-25,251 |
19,812 |
19,256 |
3,071 |
|
(1+2+3+4-5) |
|
|
|
|
|
|
|
|
| |
1. |
Loans and Advances |
0 |
0 |
0 |
0 |
0 |
0 |
0 |
0 |
| |
2. |
Treasury Bills held by the Reserve Bank 0 |
0 |
0 |
0 |
0 |
0 |
0 |
0 |
| |
3. |
Reserve Bank’s Holdings of |
13,869 |
15,993 |
-30,766 |
8,221 |
-17,243 |
19,378 |
3,513 |
-27,610 |
| |
|
Dated Securities |
|
|
|
|
|
|
|
|
| |
4. |
Reserve Bank’s Holdings of Rupee Coins 7 |
-48 |
-13 |
-40 |
-33 |
157 |
-77 |
9 |
| |
5. |
Central Government Deposits |
-14,541 |
-9,586 |
-29,043 |
-6,419 |
7,974 |
-277 |
-15,820 |
-30,672 |
|
Memo* |
|
|
|
|
|
|
|
|
| |
1. |
Market Borrowings of Dated |
1,31,000 |
52,000 |
59,000 |
42,000 |
39,000 |
24,000 |
26,000 |
52,000 |
| |
|
Securities by the Centre # |
|
|
|
|
|
|
|
|
| |
2. Reserve Bank’s Primary |
10,000 |
0 |
0 |
0 |
0 |
0 |
10,000 |
0 |
| |
|
Subscription to Dated Securities |
|
|
|
|
|
|
|
|
| |
3. |
Repos (+) / Reverse Repos (-) |
12,080 |
11,965 |
-32,435 |
9,660 |
-14,835 |
18,635 |
-1,380 |
-23,060 |
| |
|
(LAF), net position |
|
|
|
|
|
|
|
|
| |
4. |
Net Open Market Sales @ |
3,913 |
2,069 |
2,503 |
1,543 |
941 |
261 |
1,168 |
1,536 |
| |
5. |
Mobilisation under MSS |
-35,149 |
6,047 |
7,198 |
7,469 |
-4,353 |
-19,713 |
-18,552 |
4,062 |
| |
6. |
Primary Operations $ |
-33,328 |
27,313 |
75,386 |
18,205 |
-24,689 |
-38,715 |
11,871 |
62,063 |
| |
|
|
|
|
|
|
|
|
|
|
|
* :At face value. #: Excluding Treasury Bills.
@:Excluding Treasury Bills but including Consolidated Sinking Funds (CSF) and other investments.
$ :Adjusted for MSS and Centre’s surplus investment.
Note: Quarterly variations are based on March 31 for Q4 and last reporting Fridays for other quarters. |
of Rs.29,043 crore in Central Government deposits with the Reserve Bank. The Reserve Bank’s net credit to the Centre, therefore, declined by Rs.1,736 crore during the fiscal year 2006-07 (up to July 14) as against an increase of Rs.25,530 crore during the corresponding period of 2005-06 (Table 20).
Liquidity Management
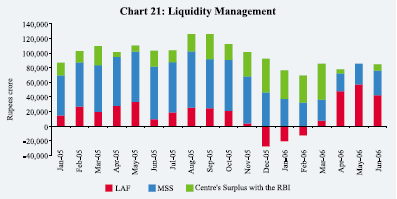
After a spell of some tightness in market liquidity during December 2005-March 2006, liquidity conditions have eased significantly during 2006-07 so far. The turnaround in the liquidity conditions could be attributed to unwinding of the Centre’s surplus balances with the Reserve Bank and the Reserve Bank’s purchase of foreign exchange from authorised dealers (Table 21). Accordingly, the Reserve Bank reverted back to liquidity absorption mode during 2006-07. On an average, the Reserve Bank absorbed liquidity through reverse repos to the extent of Rs.51,490 crore during April-June 2006 as against a net injection of liquidity through repos to the extent of Rs.11,686 crore during the previous quarter (January - March 2006). Average daily liquidity absorption during April-June 2006 was more than double of that during the corresponding quarter of the previous year (Rs.22,481 crore during April-June 2005).
On a review of liquidity conditions, issuances under the MSS were re-introduced effective May 3, 2006. The balances under the MSS, which had
|
Table 21: Phases of Reserve Bank's Liquidity Management Operations |
| |
|
|
|
|
|
|
(Rupees crore) |
| |
|
|
Variation during |
| |
|
|
|
|
|
|
|
|
|
Item |
|
April 1- |
July 23- |
August 13- |
October 29- |
Dec 30, 2005- |
April 1- |
| |
|
|
July 22, |
August 12, |
October 28, |
Dec 30, |
Mar 31, |
July 14, |
| |
|
|
2005 |
2005 |
2005 |
2005 |
2006 |
2006 |
| |
|
|
|
|
|
|
|
|
|
1 |
|
|
2 |
3 |
4 |
5 |
6 |
7 |
| |
|
|
|
|
|
|
|
|
|
A. Drivers of Liquidity (1+2+3+4) |
-6,587 |
27,406 |
-14,621 |
-60,555 |
22,638 |
28,928 |
| |
1. |
RBI's Foreign Currency Assets |
|
|
|
|
|
|
| |
|
(adjusted for revaluation) |
6,412 |
19,348 |
5,193 |
-21,696 |
59,577 |
29,894 |
| |
2. |
Currency with the Public |
-15,125 |
-1,914 |
-7,434 |
-12,734 |
-20,073 |
-25,990 |
| |
3. |
Surplus Cash Balances of the |
|
|
|
|
|
|
| |
|
Centre with the Reserve Bank |
6,053 |
5,972 |
-7,421 |
-24,357 |
-2,973 |
39,158 |
| |
4. |
Others (residual) |
-3,927 |
4,000 |
-4,959 |
-1,768 |
-13,893 |
-14,134 |
| |
|
|
|
|
|
|
|
|
|
B. Management of Liquidity (5+6+7+8) |
1,329 |
-24,567 |
16,187 |
72,235 |
-7,215 |
-39,486 |
| |
5. |
Liquidity Impact of LAF Repos |
8,845 |
-26,565 |
16,210 |
48,595 |
-35,005 |
-32,435 |
| |
6. |
Liquidity Impact of OMO (net) |
0 |
0 |
0 |
0 |
10,740 |
147 |
| |
7. |
Liquidity Impact of MSS |
-7,516 |
1,998 |
-23 |
23,640 |
17,050 |
-7,198 |
| |
8. |
First Round Liquidity Impact |
|
|
|
|
|
|
| |
|
due to CRR change |
0 |
0 |
0 |
0 |
0 |
0 |
| |
|
|
|
|
|
|
|
|
|
C. |
Bank Reserves # (A+B) |
-5,258 |
2,839 |
1,566 |
11,680 |
15,423 |
-10,558 |
| |
|
|
|
|
|
|
|
|
|
+: Indicates injection of liquidity into the banking system.
– : Indicates absorption of liquidity from the banking system.
#: Includes vault cash with banks and adjusted for first round liquidity impact due to CRR change.
* : Adjusted for Consolidated Sinking Funds (CSF). |
|
Table 22: Liquidity Management |
| |
|
|
|
(Rupees crore) |
| |
|
|
|
|
|
Outstanding as on last Friday of |
LAF |
MSS |
Centre's Surplus with the RBI @ |
Total (2 to 4) |
| |
|
|
|
|
|
1 |
2 |
3 |
4 |
5 |
| |
|
|
|
|
|
2005 |
|
|
|
|
|
January |
14,760 |
54,499 |
17,274 |
86,533 |
|
February |
26,575 |
60,835 |
15,357 |
102,767 |
|
March * |
19,330 |
64,211 |
26,102 |
109,643 |
|
April |
27,650 |
67,087 |
6,449 |
101,186 |
|
May |
33,120 |
69,016 |
7,974 |
110,110 |
|
June |
9,670 |
71,681 |
21,745 |
103,096 |
|
July |
18,895 |
68,765 |
16,093 |
103,753 |
|
August |
25,435 |
76,936 |
23,562 |
125,933 |
|
September |
24,505 |
67,328 |
34,073 |
125,906 |
|
October |
20,840 |
69,752 |
21,498 |
112,090 |
|
November |
3,685 |
64,332 |
33,302 |
101,319 |
|
December |
-27,755 |
46,112 |
45,855 |
64,212 |
| |
|
|
|
|
|
2006 |
|
|
|
|
|
January |
-20,555 |
37,280 |
39,080 |
55,805 |
|
February |
-12,715 |
31,958 |
37,013 |
56,256 |
|
March |
-7,250 |
29,062 |
48,828 |
85,140 |
|
April |
47,805 |
24,276 |
5,611 |
77,692 |
|
May |
57,245 |
27,817 |
0 |
85,062 |
|
June |
42,565 |
33,295 |
8,621 |
84,481 |
|
July (as on July 14) |
39,685 |
36,260 |
9,670 |
85,615 |
| |
|
|
|
|
|
@ : Excludes minimum cash balances with the Reserve Bank.
Note : Negative sign in column 2 indicates injection of liquidity through LAF repo.
* : Data pertain to March 31, 2005. |
been falling since November 2005, thus, increased during May-June 2006 (Table
22 and Chart 21).
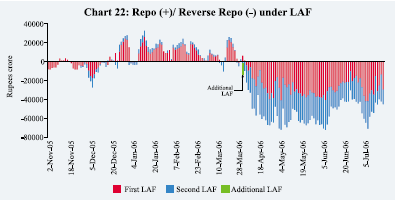
In order to fine-tune the management of liquidity and in response to suggestions
from the market participants, the Reserve Bank had introduced a
Second Liquidity Adjustment Facility with effect from November
28, 2005. The recourse by market participants to the second LAF vis-a-vis
the first LAF was relatively small during the phase of liquidity injection between
November 2005 and March 2006. However, with the easing of liquidity conditions,
there has been a significant increase in the recourse to the second LAF since
April 2006 onwards (Chart 22). The daily average absorption under the second
LAF during April-May 2006 at Rs.28,776 crore exceeded that of Rs.24,131 crore
in the first LAF. The daily average absorption under the second LAF declined
during June 2006 and was also somewhat lower than that in the first LAF (Table
23).
Liquidity absorption through LAF fell during June 2006 reflecting
increase in the Centre’s surplus balances with the Reserve Bank and fresh issuances
under the MSS. Liquidity absorption, however, increased again during the first
week of
|
Table 23: Dynamics of First and Second LAF |
| |
|
|
|
|
(Amount in Rupees crore) |
| |
|
Average daily |
Average daily |
Average daily |
Share of First |
Share of Second |
| |
|
LAF |
First LAF |
Second LAF |
LAF in Total LAF |
LAF in Total LAF |
| |
|
Operations (net) |
Operations (net) |
Operations (net) |
(per cent) |
(per cent) |
| |
|
|
|
|
|
|
|
1 |
|
2 |
3 |
4 |
5 |
6 |
| |
|
|
|
|
|
|
|
December 2005 |
-1,452 |
654 |
-2,106 |
64.6 |
35.4 |
|
January 2006 |
15,386 |
12,938 |
2,447 |
72.9 |
27.1 |
|
February 2006 |
13,532 |
10,850 |
2,682 |
75.0 |
25.0 |
|
March 2006 @ |
6,319 |
5,520 |
799 |
54.1 |
45.9 |
|
April 2006 |
-46,088 |
-18,480 |
-27,608 |
41.1 |
58.9 |
|
May 2006 |
-59,505 |
-29,600 |
-29,905 |
49.7 |
50.3 |
|
June 2006 |
-48,611 |
-25,647 |
-22,964 |
52.8 |
47.2 |
| |
|
|
|
|
|
|
|
Note : (+) indicates injection of liquidity through LAF repo while (-) indicates absorption of liquidity through LAF reverse repos.
@ : LAF amounts for Additional LAF conducted on March 31, 2006 have been shown under second LAF. |
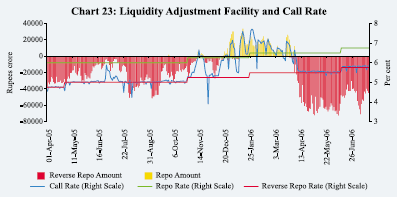
July 2006 mirroring the decline in the Centre’s surplus balances.
Reflecting the easing of liquidity conditions, call rates have remained close
to the reverse repo rate during 2006-07 so far. The call rates edged higher
from June 9, 2006 onwards in consonance with the increase of 25 basis points
each in the reverse repo rate and the repo rate (Chart 23).
|