|
The Indian
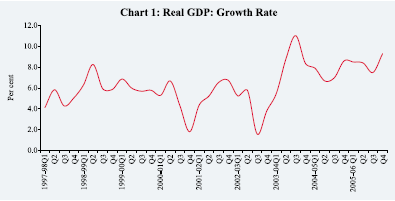
economy recorded robust growth for the third successive year during 2005-06,
backed by sustained manufacturing activity and impressive performance of the
services sector with reasonable support from the recovery in agricultural activity.
After recording some slowdown in the third quarter (October-December) of 2005-06,
real gross domestic product (GDP) registered a sharp increase in the fourth
quarter (January-March) of 2005-06 benefiting from a pick-up in almost all sub-sectors
(Table 1 and Chart 1). According to the revised estimates released by the Central
Statistical Organisation (CSO) in May 2006, real GDP accelerated from 7.5 per
cent in 2004-05 to 8.4 per cent during 2005-06. The Indian economy has, thus,
recorded an average growth of over eight per cent in the latest three years
(2003-04 to 2005-06).
|
Table
1: Growth Rates of Real GDP
|
|
(Base
Year : 1999-2000)
|
| |
|
|
|
|
|
|
|
|
|
|
|
|
|
(Per
cent)
|
| |
|
|
|
|
|
|
|
|
|
|
|
|
|
|
|
| |
Sector
|
2000-01
|
2003-
|
2004-
|
2005-
|
2004-05
|
2005-06
|
| |
|
|
|
to
|
04
|
05*
|
06#
|
|
|
|
|
|
|
|
|
| |
|
|
|
|
|
|
|
Q1
|
Q2
|
Q3
|
Q4
|
Q1
|
Q2
|
Q3
|
Q4
|
| |
|
|
2002-03
|
|
|
|
|
|
|
|
|
|
|
|
| |
|
|
(Average)
|
|
|
|
|
|
|
|
|
|
|
|
| |
|
|
|
|
|
|
|
|
|
|
|
|
|
|
|
| |
1
|
|
|
2
|
3
|
4
|
5
|
6
|
7
|
8
|
9
|
10
|
11
|
12
|
13
|
|
1.
|
Agriculture and
|
|
-0.2
|
10.0
|
0.7
|
3.9
|
3.5
|
-0.2
|
-1.2
|
1.5
|
3.4
|
4.0
|
2.9
|
5.5
|
| |
Allied Activities
|
|
(23.5)
|
(22.2)
|
(20.8)
|
(19.9)
|
|
|
|
|
|
|
|
|
| |
1.1 Agriculture
|
|
-0.5
|
10.7
|
0.7
|
..
|
|
|
|
|
|
|
|
|
|
2.
|
Industry
|
|
5.2
|
6.6
|
7.4
|
7.6
|
6.6
|
8.0
|
8.1
|
6.8
|
9.5
|
6.3
|
7.0
|
7.9
|
| |
|
|
|
(19.7)
|
(19.5)
|
(19.5)
|
(19.3)
|
|
|
|
|
|
|
|
|
| |
2.1
|
Mining and Quarrying
|
4.4
|
5.3
|
5.8
|
0.9
|
8.2
|
6.0
|
5.7
|
3.7
|
3.1
|
-2.6
|
0.0
|
3.0
|
| |
2.2
|
Manufacturing
|
|
5.7
|
7.1
|
8.1
|
9.0
|
6.6
|
8.3
|
9.2
|
8.1
|
10.7
|
8.1
|
8.3
|
8.9
|
| |
2.3
|
Electricity, Gas and
|
|
|
|
|
|
|
|
|
|
|
|
|
|
| |
|
Water Supply
|
|
2.8
|
4.8
|
4.3
|
5.3
|
4.9
|
7.9
|
3.1
|
1.4
|
7.4
|
2.6
|
5.0
|
6.1
|
|
3. Services
|
|
6.6
|
8.5
|
10.2
|
10.3
|
10.0
|
8.2
|
10.6
|
11.6
|
10.1
|
10.3
|
9.7
|
11.0
|
| |
|
|
|
(56.8)
|
(58.3)
|
(59.7)
|
(60.7)
|
|
|
|
|
|
|
|
|
| |
3.1
|
Trade, Hotels, Restaurants,
|
|
|
|
|
|
|
|
|
|
|
|
| |
|
Transport, Storage
|
|
|
|
|
|
|
|
|
|
|
|
|
|
| |
|
and Communication
|
8.5
|
12.0
|
9.7
|
11.0
|
10.2
|
12.9
|
10.6
|
11.5
|
10.6
|
11.2
|
11.7
|
11.0
|
| |
3.2
|
Financing, Insurance,
|
|
|
|
|
|
|
|
|
|
|
|
|
| |
|
Real Estate and
|
|
|
|
|
|
|
|
|
|
|
|
|
|
| |
|
Business Services
|
|
6.5
|
4.5
|
9.2
|
9.7
|
8.8
|
7.5
|
9.7
|
10.7
|
8.8
|
10.5
|
8.9
|
10.5
|
| |
3.3
|
Community, Social
and
|
|
|
|
|
|
|
|
|
|
|
|
|
| |
|
Personal Services
|
|
4.1
|
5.4
|
9.2
|
7.8
|
10.7
|
4.8
|
8.5
|
12.7
|
7.3
|
8.0
|
8.4
|
7.6
|
| |
3.4
|
Construction
|
|
5.9
|
10.9
|
12.5
|
12.1
|
8.9
|
6.8
|
20.8
|
13.5
|
12.4
|
12.3
|
11.5
|
12.0
|
|
4.
|
Real GDP at Factor
Cost
|
4.6
|
8.5
|
7.5
|
8.4
|
7.9
|
6.7
|
7.0
|
8.6
|
8.5
|
8.4
|
7.5
|
9.3
|
| |
|
|
|
|
|
|
|
|
|
|
|
|
|
|
|
|
* : Quick Estimates.
#: Revised Estimates. .. : Not available separately.
Note :
1. Figures in parentheses denote percentage shares in real GDP.
2. Q1 : First Quarter (April-June); Q2: Second Quarter (July-September);
Q3: Third Quarter (October- December);
Q4 : Fourth Quarter (January-March).
Source : Central Statistical Organisation.
|
Developments during 2006-07
Against
this backdrop of robust economic activity during 2005-06, developments in the
various sectors of the Indian economy during 2006-07 so far are covered in this
Chapter. These include the progress of the South-West monsoon and kharif
sowing, industrial production, lead information on drivers of service sector
activity and indicators of business and investment expectations.
Agricultural Situation
The India
Meteorological Department (IMD) in its forecast on April 24, 2006 indicated
that the rainfall during the South-West monsoon season (June-September) 2006
for the country as a whole is likely to be 93 per cent of the Long Period Average
(LPA) with a model error of +/- 5 per cent. In its update on June 30, 2006,
the IMD revised its forecast for the 2006 season marginally to 92 per cent of
the LPA with a model error of +/- 4 per cent. It also forecast rainfall for
the month of July 2006 at 97 per cent of the LPA with a model error of +/-9
per cent.
The monsoon
arrived six days in advance - it reached Kerala on May 26, 2006 and covered
rapidly the west coast by May 31, 2006 and up to Gujarat by June 2, 2006. Subsequently,
the monsoon entered a weak phase and there was a prolonged hiatus in advancement
of monsoon for about 17 days. The monsoon revived in the last week of June 2006,
and advanced further into other regions. The cumulative rainfall during the
South-West monsoon season 2006 so far (June 1 to July 12, 2006) has been 10
per cent below normal as compared with 1 per cent above normal during the comparable
period of 2005. Of the 36 meteorological sub-divisions, cumulative rainfall
was deficient/scanty/no rain in 9 sub-divisions (8 sub divisions during last
year) (Chart 1). At the district level,
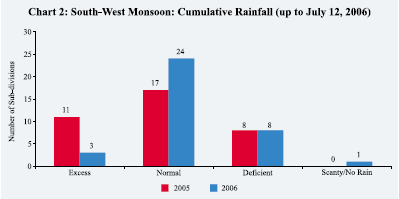
59 per cent
of the total number of districts (533) reported excess/normal rainfall, while
the rest received deficient/scanty/no rain. The total live water storage in
the 76 major reservoirs1 as on July 14, 2006 was 37 per cent of the
Full Reservoir Level (FRL), higher than that of 29 per cent a year ago.
The area
coverage under kharif crops up to July 10, 2006 was around 11.9 per cent
higher than a year ago. For all crops taken together, around 27 per cent of
the normal area has been sown so far (Table 2).
|
Table
2: Progress of Area under Kharif Crops – 2006-07
|
| |
|
|
|
|
(Million
Hectares)
|
| |
|
|
|
|
|
|
Crop
|
|
Normal
Area
|
Area
Coverage (As on July 10)
|
| |
|
|
|
|
|
| |
|
|
2005
|
2006
|
Variation
2006 over 2005
|
|
1
|
|
2
|
3
|
4
|
5
|
|
Rice
|
|
39.9
|
5.4
|
6.1
|
0.7
|
|
Coarse Cereals
|
|
22.9
|
6.8
|
7.3
|
0.5
|
|
Of which
|
|
|
|
|
|
|
Bajra
|
|
9.3
|
2.4
|
2.1
|
-0.3
|
|
Jowar
|
|
4.6
|
1.1
|
1.2
|
0.1
|
|
Maize
|
|
6.0
|
2.7
|
3.5
|
0.8
|
|
Total Pulses
|
|
10.6
|
2.0
|
2.7
|
0.7
|
|
Total Kharif
|
Oilseeds
|
15.1
|
3.3
|
3.4
|
0.1
|
|
Of which
|
|
|
|
|
|
|
Groundnut
|
|
5.5
|
1.2
|
1.6
|
0.4
|
|
Soyabean
|
|
6.3
|
1.3
|
1.1
|
-0.2
|
|
Sesamum
|
|
1.6
|
0.3
|
0.3
|
0.0
|
|
Sunflower
|
|
0.5
|
0.2
|
0.4
|
0.2
|
|
Sugarcane
|
|
4.3
|
4.3
|
4.5
|
0.2
|
|
Cotton
|
|
8.3
|
2.5
|
3.3
|
0.8
|
|
All Crops
|
|
101.1
|
24.3
|
27.2
|
2.9
|
| |
|
|
|
|
|
|
Source : Ministry
of Agriculture, Government of India.
|
1 These reservoirs account
for 63 per cent of the total reservoir capacity of the country.
|
Table
3: Agricultural Production
|
| |
|
|
|
|
|
|
(Million
Tonnes)
|
| |
|
|
|
|
|
|
|
|
Crop
|
|
2003-04
|
2004-05
|
2005-06
|
| |
|
|
|
|
|
|
|
| |
|
T
|
A
|
T
|
A
|
T
|
A $
|
| |
|
|
|
|
|
|
|
|
1
|
|
2
|
3
|
4
|
5
|
6
|
7
|
| |
|
|
|
|
|
|
|
|
Rice
|
|
87.0
|
88.5
|
93.5
|
83.1
|
87.8
|
91.0
|
|
Wheat
|
|
72.1
|
72.2
|
79.5
|
68.6
|
75.5
|
69.5
|
|
Coarse Cereals
|
|
37.8
|
37.6
|
36.8
|
33.5
|
36.5
|
34.7
|
|
Pulses
|
|
15.2
|
14.9
|
15.3
|
13.1
|
15.2
|
13.1
|
|
Total Foodgrains
|
|
212.1
|
213.2
|
225.1
|
198.4
|
215.0
|
208.3
|
|
Kharif
|
|
112.0
|
117.0
|
113.8
|
103.3
|
109.9
|
109.7
|
|
Rabi
|
|
100.0
|
96.2
|
111.3
|
95.1
|
105.1
|
98.6
|
|
Total Oilseeds
|
|
25.1
|
25.2
|
26.2
|
24.4
|
26.6
|
27.7
|
|
Kharif
|
|
17.0
|
16.7
|
16.3
|
14.2
|
16.2
|
16.8
|
|
Rabi
|
|
8.1
|
8.5
|
9.9
|
10.2
|
10.4
|
10.9
|
|
Sugarcane
|
|
236.2
|
233.9
|
270.0
|
237.1
|
237.5
|
278.4
|
|
Cotton #
|
|
13.8
|
13.7
|
15.0
|
16.4
|
16.5
|
19.6
|
|
Jute and Mesta ##
|
|
11.2
|
11.2
|
11.8
|
10.3
|
11.3
|
10.7
|
| |
|
|
|
|
|
|
|
|
T : Target. A : Achievement.
$ : Fourth Advance Estimates (July 15, 2006).
# : Million bales of 170 kgs each; ## : Million bales of 180 kgs each.
Source: Ministry of Agriculture, Government of India.
|
Total foodgrains
production during 2005-06 was placed at around 208 million tonnes, an increase
of 5.0 per cent over the previous year, mainly on the back of higher output
of rice. The increase in the production of non-foodgrains crops was led mainly
by sugarcane and cotton (Table 3).
Food Management
Total procurement
of rice and wheat during 2006-07 (up to July 4, 2006) at 14.0 million tonnes
was 22.1 per cent lower than a year ago. The total offtake of foodgrains (up
to April 2006) at 2.8 million tonnes was 18.5 per cent lower than a year ago.
While the off-take under the Targeted Public Distribution System (TPDS) was
marginally higher, that under Other Welfare Schemes (OWS) was lower than the
previous year’s level. The total stock of foodgrains with the Food Corporation
of India (FCI) and the State Government agencies was around 22.8 million tonnes
as on May 1, 2006, down by 19.9 per cent from a year ago. The stocks were, however,
higher than the buffer stock norms (16.2 million tonnes) (Table 4). Both rice
and wheat stocks were above the buffer stock norms of 12.2 million tonnes and
4.0 million tonnes, respectively.
Industrial Performance
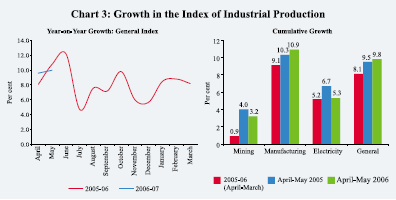
Industrial
production continued with its momentum during April-May 2006 registering growth
of 9.8 per cent. The manufacturing sector with double digit growth (10.9 per
cent) continued to be the key driver of industrial activity,
|
Table
4: Management of Food Stocks
|
| |
|
|
|
|
|
|
|
|
|
|
|
|
|
|
| |
|
|
|
|
|
|
|
|
|
|
|
|
(Million Tonnes)
|
| |
|
|
|
|
|
|
|
|
|
|
|
|
|
|
|
Month
|
|
Opening
Stock of
|
Procurement
of
|
Foodgrains
Offtake
|
|
Closing
|
Norms
|
| |
|
Foodgrains
|
Foodgrains
|
|
|
|
|
|
Stock
|
|
| |
|
|
|
|
|
|
|
|
|
|
|
|
|
|
| |
|
Rice
|
Wheat
|
Total
|
Rice
|
Wheat
|
Total
|
PDS
|
OWS
|
OMS
–
|
Exports
|
Total
|
|
|
| |
|
|
|
|
|
|
|
|
|
Domestic
|
|
|
|
|
|
1
|
|
2
|
3
|
4
|
5
|
6
|
7
|
8
|
9
|
10
|
11
|
12
|
13
|
14
|
| |
|
|
|
|
|
|
|
|
|
|
|
|
|
|
|
2005
|
|
|
|
|
|
|
|
|
|
|
|
|
|
|
|
January
|
12.8
|
8.9
|
21.7
|
3.3
|
0.0
|
3.3
|
2.7
|
0.8
|
0.0
|
0.0
|
3.6
|
21.5
|
16.8
|
|
February
|
14.2
|
7.3
|
21.5
|
2.2
|
0.0
|
2.2
|
2.7
|
0.9
|
0.0
|
0.0
|
3.7
|
20.0
|
|
|
March
|
|
13.7
|
5.8
|
20.0
|
1.7
|
0.0
|
1.7
|
2.7
|
1.7
|
0.0
|
0.0
|
4.4
|
18.0
|
|
|
April
|
|
13.3
|
4.1
|
18.0
|
1.2
|
12.8
|
14.1
|
2.4
|
1.0
|
0.0
|
0.0
|
3.4
|
28.5
|
16.2
|
|
May
|
|
13.0
|
15.1
|
28.5
|
1.3
|
1.9
|
3.1
|
2.5
|
0.8
|
0.0
|
0.0
|
3.3
|
27.9
|
|
|
June
|
|
11.6
|
15.7
|
27.9
|
0.8
|
0.1
|
0.8
|
2.5
|
1.7
|
0.0
|
0.0
|
4.2
|
25.1
|
|
|
July
|
|
10.1
|
14.5
|
25.1
|
0.4
|
0.0
|
0.4
|
2.8
|
0.8
|
0.1
|
0.0
|
3.6
|
21.4
|
26.9
|
|
August
|
|
8.0
|
13.0
|
21.4
|
0.9
|
0.0
|
0.9
|
2.6
|
0.8
|
0.1
|
0.0
|
3.4
|
18.4
|
|
|
September
|
6.4
|
11.6
|
18.4
|
0.4
|
0.0
|
0.4
|
2.7
|
0.7
|
0.1
|
0.0
|
3.5
|
15.5
|
|
|
October
|
4.8
|
10.3
|
15.5
|
7.6
|
0.0
|
7.6
|
2.7
|
0.5
|
0.0
|
0.0
|
3.2
|
19.8
|
16.2
|
|
November
|
10.3
|
9.1
|
19.8
|
2.7
|
0.0
|
2.7
|
2.3
|
0.5
|
0.1
|
0.0
|
2.8
|
19.0
|
|
|
December
|
11.1
|
7.6
|
19.0
|
3.4
|
0.0
|
3.4
|
2.7
|
0.7
|
0.2
|
0.0
|
3.6
|
19.3
|
|
| |
|
|
|
|
|
|
|
|
|
|
|
|
|
|
|
2006
|
|
|
|
|
|
|
|
|
|
|
|
|
|
|
|
January
|
12.6
|
6.2
|
19.3
|
3.8
|
0.0
|
3.8
|
2.7
|
0.8
|
0.1
|
0.0
|
3.6
|
19.5
|
20.0
|
|
February
|
14.0
|
4.9
|
19.5
|
2.5
|
0.0
|
2.5
|
2.7
|
0.6
|
0.3
|
0.0
|
3.6
|
18.3
|
|
|
March
|
|
14.1
|
3.4
|
18.3
|
1.9
|
0.0
|
1.9
|
2.6
|
0.9
|
0.2
|
0.0
|
3.6
|
16.6
|
|
|
April
|
|
13.7
|
2.0
|
16.6
|
1.7
|
8.7
|
10.3
|
2.5
|
0.3
|
0.0
|
0.0
|
2.8
|
22.8
|
16.2
|
|
May
|
|
12.8
|
9.0
|
22.8
|
1.6
|
0.6
|
2.2
|
N.A.
|
N.A.
|
N.A.
|
N.A.
|
N.A.
|
N.A.
|
|
|
June
|
|
N.A.
|
N.A.
|
N.A.
|
1.5
|
0.0
|
1.5
|
N.A.
|
N.A.
|
N.A.
|
N.A.
|
N.A.
|
N.A.
|
|
|
July *
|
|
N.A.
|
N.A.
|
N.A.
|
0.1
|
0.0
|
0.1
|
N.A.
|
N.A.
|
N.A.
|
N.A.
|
N.A.
|
N.A.
|
|
| |
|
|
|
|
|
|
|
|
|
|
|
|
|
|
|
PDS : Public Distribution
System. OWS : Other Welfare Schemes. OMS : Open Market Sales.
N.A. : Not Available. * : Procurement up to July 4, 2006.
Notes :
Closing stock figures may differ from those arrived at by adding the
opening stocks and procurement and deducting offtake,
as stocks include coarse grains also.
Source : Ministry of Consumer Affairs, Food and Public Distribution,
Government of India.
|
contributing almost 92.5
per cent of the growth in industry (Chart 3). Electricity and mining sectors,
however, continued to exhibit subdued growth.
The robust
performance of the manufacturing sector was largely led by ‘chemical and chemical
products’, ‘machinery and equipments’, ‘basic metal and alloy industries’, ‘transport
equipment and parts’, and ‘non-metallic mineral products’ (Table 5). The manufacturing
sector growth at 10.9 per cent during April-May 2006 was the highest for this
period in the last ten years.
According
to the use-based classification, the capital goods sector registered an impressive
growth of 21.1 per cent during April-May 2006 even on a high base, reflecting
strong investment demand. This is the highest growth for April-May period under
the new base (1993-94=100). Higher production of laboratory and scientific instruments,
broad gauge passenger carriage, boilers, complete tractors, industrial machinery
and textile machinery boosted capital goods production. Basic goods sector was
buoyed up by growth in cement sector, carbon steel and other minerals. Intermediate
goods sector, after recording subdued growth during most of 2005-06, witnessed
moderate improvement, facilitated by higher production of viscose staple fibre,
filament yarn, cotton
|
Table
5: Growth Rate of Manufacturing Groups
|
| |
|
|
|
|
|
(Per cent)
|
| |
|
|
|
|
|
|
| |
Industry Group
|
Weight
in the
|
Growth
Rate
|
Weighted
Contribution
|
| |
|
Index
of
|
|
|
|
|
| |
|
|
April-May
|
April-May
|
| |
Industrial
Production
|
|
|
|
|
| |
|
|
2005
|
2006
(P)
|
2005
|
2006
|
| |
|
|
|
|
|
|
|
1
|
|
2
|
3
|
4
|
5
|
6
|
| |
|
|
|
|
|
|
|
1.
|
Chemicals and chemical
products
|
14.0
|
13.3
|
12.5
|
25.7
|
23.4
|
| |
except products of
petroleum & coal
|
|
|
|
|
|
|
2.
|
Machinery and equipment
other
|
9.6
|
11.3
|
13.4
|
16.6
|
18.7
|
| |
than transport equipment
|
|
|
|
|
|
|
3.
|
Basic metal and alloy
industries
|
7.5
|
16.2
|
21.0
|
13.1
|
16.9
|
|
4.
|
Transport equipment
and parts
|
4.0
|
13.6
|
21.4
|
8.4
|
12.8
|
|
5.
|
Other manufacturing
industries
|
2.6
|
9.4
|
31.6
|
3.0
|
9.3
|
|
6.
|
Non-metallic mineral
products
|
4.4
|
7.7
|
12.2
|
5.1
|
7.4
|
|
7.
|
Beverages, tobacco
and related products
|
2.4
|
10.4
|
11.4
|
5.4
|
5.6
|
|
8.
|
Rubber, plastic, petroleum
and coal products
|
5.7
|
2.5
|
8.0
|
1.7
|
4.8
|
|
9.
|
Paper and paper products
and printing,
|
2.7
|
12.5
|
12.1
|
3.9
|
3.7
|
| |
publishing and allied
activities
|
|
|
|
|
|
|
10.
|
Wool, silk and man-made
fibre textiles
|
2.3
|
-8.4
|
11.9
|
-3.0
|
3.3
|
|
11.
|
Textile products (including
wearing apparel)
|
2.5
|
25.3
|
9.6
|
7.8
|
3.2
|
|
12.
|
Cotton textiles
|
5.5
|
9.2
|
2.9
|
3.9
|
1.2
|
|
13.
|
Jute and other vegetable
fibre textiles (except cotton)
|
0.6
|
-3.6
|
-2.8
|
-0.1
|
-0.1
|
|
14.
|
Metal products and
parts
|
2.8
|
6.7
|
-4.1
|
1.7
|
-0.9
|
| |
(except machinery
and equipment)
|
|
|
|
|
|
|
15.
|
Leather and leather
& fur products
|
1.1
|
11.4
|
-12.1
|
1.2
|
-1.2
|
|
16.
|
Wood and wood products,
furniture & fixtures
|
2.7
|
-1.3
|
-21.3
|
-0.2
|
-2.4
|
|
17.
|
Food products
|
9.1
|
7.4
|
-7.6
|
5.8
|
-5.5
|
| |
Manufacturing – Total
|
79.4
|
10.3
|
10.9
|
100.0
|
100.0
|
| |
|
|
|
|
|
|
|
Source : Central
Statistical Organisation.
|
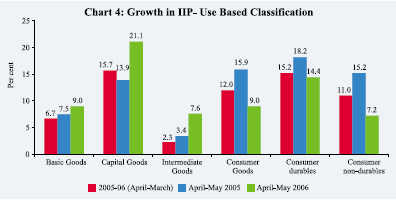
yarn, paints,
enamels and varnishes, and PVC pipes and tubes. Consumer goods, both durable
and non-durable segments, on the other hand, recorded some deceleration, partly
on account of base effect (Chart 4).
Infrastructure
The infrastructure
sector recorded growth of 5.9 per cent in April-May 2006 as compared with 7.1
per cent in April-May 2005 on account of deceleration in all industries except
petroleum refinery products (Chart 5). Double-digit growth in the petroleum
refinery products and moderation in growth of the
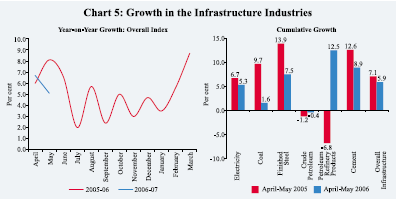
cement and
steel sectors could be attributed largely to base effect. The decline in crude
oil production resulted from fall in production in plants of ONGC at Mumbai
High.
Services Sector
Services
sector with double-digit growth during the past two years (2004-05 to 2005-06)
has further strengthened its place as the leading sector of the Indian economy.
Services sector now accounts for more than 60 per cent of overall GDP. Lead
indicators of services sector performance for April-May 2006 suggest continued
buoyancy. Revenue earning freight of the railways continued to record strong
growth. Substantial activity was witnessed in cargo handled by civil aviation
and passengers handled at domestic and international airports. There was a sharp
rise in new cell phone connections (Table 6). Healthy growth in bank deposits
and non-food credit, and, increased business process outsourcing-information
technology enabled services exports are expected to buoy up the sub-sector ‘financing,
insurance, real estate and business services’.
Business Expectations Surveys
Various
business confidence surveys suggest that economic activity is likely to remain
buoyant in the near term (Table 7). The National Council of Applied Economic
Research (NCAER) business confidence index (BCI) increased by
|
Table
6: Indicators of Service Sector Activity
|
| |
|
|
|
|
|
|
| |
|
|
(Growth
rates in per cent)
|
| |
|
|
|
|
|
|
|
Sub-sector
|
2004-05
|
2005-06
|
April
|
| |
|
|
|
|
|
|
| |
|
|
2005
|
|
2006
|
|
| |
|
|
|
|
|
|
|
1
|
2
|
3
|
4
|
|
5
|
|
| |
|
|
|
|
|
|
|
Tourist arrivals
|
23.7
|
11.7
|
19.7
$
|
20.0
$
|
|
Commercial vehicles
production
|
28.6
|
10.6
|
-5.3
|
|
49.7
|
|
|
Railway revenue earning
freight traffic
|
8.1
|
10.7
|
14.9
|
|
11.0
|
|
|
New cell phone connections
|
10.4
|
89.4
|
7.6
|
|
167.0
|
|
|
Cargo handled at major
ports
|
11.3
|
10.3
|
15.8
|
|
-2.0
|
|
|
Civil aviation
|
|
|
|
|
|
|
|
a) Export cargo handled
|
12.4
|
7.3
|
12.0
|
|
10.1
|
|
|
b) Import cargo handled
|
24.2
|
15.8
|
14.6
|
|
19.9
|
|
|
c) Passengers handled
at international terminals
|
14.0
|
12.8
|
9.9
|
|
16.2
|
|
|
d) Passengers handled
at domestic terminals
|
23.6
|
27.1
|
19.2
|
|
54.0
|
|
|
Roads: Upgradation
of Highways
|
16.1
|
-23.4
|
–
|
|
–
|
|
|
Cement
|
8.2
|
10.7
|
12.6
$
|
8.9
$
|
|
Steel
|
7.6
|
6.0
|
13.9
$
|
7.5
$
|
|
Aggregate deposits
|
11.9
|
22.3
|
14.9
@
|
20.7
@
|
|
Non-food credit
|
31.6
|
38.4
|
31.0
@
|
32.9
@
|
|
Central Government
expenditure
|
5.6
|
2.2
|
-1.0
$
|
53.9
|
$
|
| |
|
|
|
|
|
|
|
$ : April-May.
@ : Year-on-year as on July 7.
|
|
Table
7: Business Expectations Surveys
|
|
Agency
|
Business
Expectations
|
Growth
over
|
Growth
over
|
| |
|
|
a year
ago
|
previous
round
|
| |
Period
|
Index
|
(per
cent)
|
(per
cent)
|
| |
|
|
|
|
|
Dun & Bradstreet
|
2006 (April-June)
|
Business Optimism
Index
|
7.5
|
5.8
|
|
NCAER
|
2006 (April-September)
|
Business Confidence
Index
|
7.6
|
1.7
|
|
FICCI
|
2006 (April-September)
|
Business Confidence
Index
|
5.4
|
-1.4
|
|
CII
|
2006 (April-September)
|
Business Confidence
Index
|
..
|
2.1
|
|
RBI
|
2006 (July-September)
|
Business Expectation
Index
|
5.8
|
5.0
|
1.7 per
cent during April-September 2006 to 154 - the highest level since November 1994.
According to the NCAER survey, overall economic conditions and investment climate
increased by 2.5 percentage points and 2.2 percentage points, respectively.
The CII’s business confidence index for April-September 2006 increased by 2.1
per cent. The BCI was significantly higher for non-manufacturing firms compared
to the manufacturing firms. The survey revealed that 88 per cent of the respondents
planned to increase investments while 75 per cent of the respondents expected
capacity utilisation will be up to 100 per cent. The FICCI’s quarterly Business
Confidence Survey conducted during January-March 2006 indicated that the industrial
sector was optimistic about sales, selling price, profits, investments, employment
and exports. Although the BCI registered a marginal fall from the preceding
round partly reflecting the base effect - the BCI had reached an all time high
in the previous round - almost 80 per cent of the respondents expected overall
economic conditions to be ‘moderately to substantially better’ in the April-September
2006 period. The corporates appear to be comfortably placed in terms of availability
and cost of credit. For 89 per cent of the companies, availability of credit
was not a constraining factor, while 78 per cent found cost of credit within
their affordable limits. The services sector continued to be the most upbeat
among the three industry sectors covered in the survey. At the same time, the
survey showed that companies are finding rising cost of raw materials as the
key challenge to maintain and improve their growth performance.
According
to the Reserve Bank’s latest Industrial Outlook Survey, the Business Expectations
Index for July-September 2006 quarter increased by 5.0 per cent over the previous
quarter’s level (Chart 6). The assessment about the overall business situation
for April-June 2006 showed an improvement in the level of confidence over the
previous quarter. Responses to the survey suggest an improvement in expectations
for the overall business situation, production, capacity utilisation, order
books, employment, exports, imports, selling prices and profit margins during
the quarter July-September 2006 vis-à-vis April-June 2006. The
financial situation is expected to show an improvement during
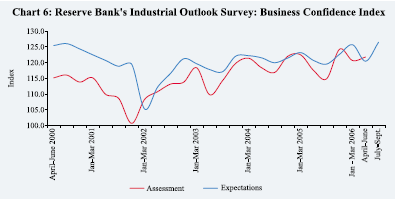
July-September 2006. While
working capital finance requirement is expected to increase, the availability
of finance is also expected to improve (Table 8).
|
Table
8: Net Response on ‘A Quarter Ahead’ Expectations
|
|
About
the Industrial Performance
|
| |
|
|
|
|
|
|
|
| |
|
|
|
|
|
(Per
cent)
|
| |
|
|
|
|
|
|
|
|
Parameter
|
Response
|
July-
|
Oct-
|
Jan-
|
Apr-
|
June
|
| |
|
|
Sept
|
Dec
|
March
|
June
|
Sept
|
| |
|
|
2005
|
2005
|
2006
|
2006
|
2006
|
| |
|
|
(816)
|
(961)
|
(934)
|
(1086)
|
(1073)
|
|
1
|
|
2
|
3
|
4
|
5
|
6
|
7
|
| |
|
|
|
|
|
|
|
|
1.
|
Overall business situation
|
Better
|
45.5
|
51.3
|
49.8
|
46.3
|
53.1
|
|
2.
|
Financial situation
|
Better
|
36.7
|
42.3
|
40.7
|
40.4
|
43.4
|
|
3.
|
Working capital finance
requirement
|
Increase
|
28.8
|
32.7
|
31.9
|
30.6
|
32.7
|
|
4.
|
Availability of finance
|
Improve
|
30.7
|
34.1
|
34.1
|
33.8
|
35.0
|
|
5.
|
Production
|
Increase
|
40.7
|
46.9
|
46.3
|
42.5
|
49.4
|
|
6.
|
Order books
|
Increase
|
39.6
|
43.7
|
41.0
|
39.1
|
45.2
|
|
7.
|
Cost of raw material
|
Decrease
|
-43.6
|
-30.0
|
-35.9
|
-37.3
|
-45.8
|
|
8.
|
Inventory of raw material
|
Below average
|
-4.2
|
-6.9
|
-6.8
|
-5.0
|
-6.3
|
|
9.
|
Inventory of finished
goods
|
Below average
|
-4.2
|
-3.3
|
-4.7
|
-4.5
|
-2.6
|
|
10.
|
Capacity utilization
|
Increase
|
25.4
|
31.1
|
29.6
|
24.8
|
32.1
|
|
11.
|
Level of capacity
utilization
|
Above normal
|
7.6
|
10.9
|
11.4
|
9.4
|
11.8
|
|
12.
|
Assessment of production
capacity
|
More than adequate
|
5.3
|
5.0
|
4.9
|
4.1
|
3.6
|
|
13.
|
Employment in company
|
Increase
|
7.8
|
12.7
|
13.3
|
14.5
|
16.4
|
|
14.
|
Exports, if applicable
|
Increase
|
32.5
|
33.3
|
31.8
|
31.0
|
38.3
|
|
15.
|
Imports, if any
|
Increase
|
23.7
|
19.2
|
20.8
|
22.7
|
23.8
|
|
16.
|
Selling prices are
expected to
|
Increase
|
13.3
|
7.8
|
10.8
|
12.4
|
16.6
|
|
17.
|
If increase expected
in selling prices
|
Increase at lower
rate
|
14.0
|
16.6
|
16.3
|
12.0
|
10.5
|
|
18.
|
Profit margin
|
Increase
|
7.1
|
9.6
|
12.6
|
9.3
|
11.1
|
| |
|
|
|
|
|
|
|
|
Note :
1. Figures in parentheses represent number of companies included in
the results.
2. ‘Net response’ is measured as the per cent share differential between
the companies reporting
‘optimistic’ (positive) and ‘pessimistic’ (negative) responses; responses
indicating status quo (no change)
are not reckoned.
Higher ‘net response’ indicates higher level of confidence and vice
versa.
|
The buoyancy
in manufacturing and services sector activities and the positive business confidence
and expectations suggest that the recent growth momentum in the Indian economy
is likely to be maintained in 2006-07, as has also been projected by different
agencies (Table 9).
|
Table
9: Projections of Real Gross Domestic Product for
|
|
India
By Various Agencies: 2006-07
|
| |
|
|
|
|
|
|
|
|
Agency
|
|
|
Growth
Projections for 2006-07 (per cent)
|
|
Month
of Projections
|
| |
|
|
|
|
|
|
|
| |
|
Overall
Growth
|
Agriculture
|
Industry
|
Services
|
|
| |
|
|
|
|
|
|
|
|
1
|
|
|
2
|
3
|
4
|
5
|
6
|
|
|
|
|
|
|
|
|
|
|
ADB
|
|
|
7.6
|
–
|
–
|
–
|
April,
2006
|
|
CDE-DSE
|
|
7.7
|
2.4
|
9.5
|
9.2
|
May,
2006
|
|
CII
|
|
Around
8.0
|
–
|
–
|
–
|
June,
2006
|
|
CMIE
|
|
|
7.9
|
2.5
|
8.5
|
9.6
|
June,
2006
|
|
ESCAP
|
|
|
7.9
|
–
|
–
|
–
|
March,
2006
|
|
ICRA
|
|
|
7.4-8.2
|
2.0
|
8.2-9.7
|
9.1-9.7
|
January,
2006
|
|
IMF
|
|
|
7.3
|
–
|
–
|
–
|
April,
2006
|
|
Planning Commission*
|
7.7
|
3.2
|
8.9
|
8.8
|
December,
2005
|
|
Reserve Bank of India
|
7.5-8.0
|
–
|
–
|
–
|
April,
2006
|
| |
|
|
|
|
|
|
|
|
– : Not Available.
* : Base year 2001-02, Mid-Year Review of the Tenth Five-Year Plan.
ADB : Asian Development Bank; CDE-DSE : Centre for Development Economics
- Delhi School of Economics;
CII : Confederation of Indian Industry; CMIE : Centre for Monitoring Indian
Economy;
ESCAP : Economic and Social Commission for Asia and the Pacific;
ICRA : Investment Information and Credit Rating Agency of India;
IMF : International Monetary Fund.
|
|