|
International financial markets in Q1 of 2005-06 were characterised by an
environment of uncertainty emanating from high and volatile international crude
oil prices, the upturn in the global interest rate cycle and political uncertainty
in the Euro area. Short-term interest rates moved up further in a number of
economies, notably the US. In other countries/areas such as the UK and the Euro
area, short-term interest rates reversed their rising trend in the face of a
weakening of economic activity (Table 23). Long-term interest rates also moved
down, while equity prices gained, indicating some easing of financial conditions
during the quarter.
|
Table 23: Short-term Interest Rates |
|
(Percent)
|
| |
March 2004 |
March 2005 |
June 2005 |
|
1 |
2 |
3 |
4 |
| |
|
|
|
|
Advanced Economies |
|
|
|
|
US |
1.04 |
2.90 |
3.33 |
|
UK |
4.31 |
4.95 |
4.75 |
|
Euro Area |
1.96 |
2.15 |
2.10 |
|
Japan |
0.03 |
0.02 |
0.02 |
|
Sweden |
2.12 |
1.97 |
1.48 |
|
Emerging Market Economies |
|
|
|
|
China |
– |
2.25 |
2.30 |
|
Hong Kong |
0.17 |
2.79 |
3.36 |
|
South Korea |
3.90 |
3.54 |
3.52 |
|
Argentina |
2.88 |
4.56 |
6.94 |
|
Brazil |
16.02 |
19.25 |
19.74 |
|
Malaysia |
3.00 |
2.82 |
2.87 |
|
Philippines |
9.19 |
7.25 |
5.88 |
|
Singapore |
0.69 |
2.06 |
2.06 |
|
Thailand |
1.31 |
2.64 |
2.75 |
| |
|
|
|
|
– : Not available.
Source: The Economist. |
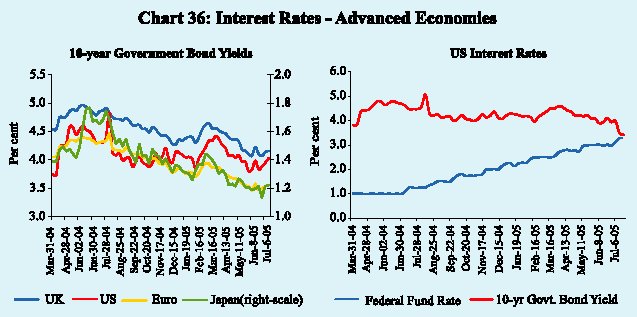
Long-term government bond yields declined during April-June 2005 on expectations that monetary authorities could slow down policy tightening due to fragility in the economic recovery. Demand for fixed income products from baby boomers approaching retirement provided some support to long-term gilts (Chart 36). In the US, the 10-year Treasury yield at 3.8 per cent was at a 14-month low on June 3, 2005. Japanese 10-year bond yields and Euro area bond yields also dropped to record lows in May and June 2005. Similarly, yield curves in Australia, New Zealand and the UK have flattened or inverted.
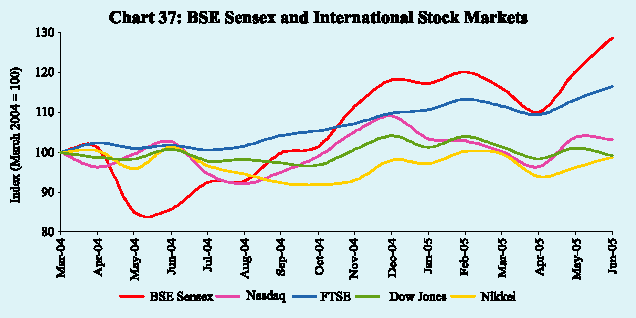
Equity markets witnessed rallies
during June 2005, reflecting buying opportunities in the wake of a dip during
April-May 2005 as a result of higher oil prices. The Indian stock markets, in
particular, outperformed the stock indices of major economies (Chart 37).
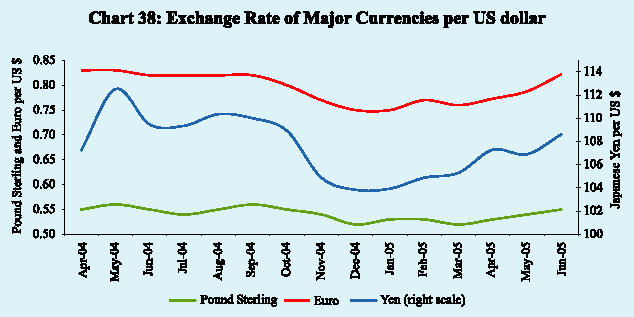
The US dollar appreciated against major currencies during Q1 of 2005-06, reflecting growing interest differentials in favour of the US and uncertainty in the Euro area (Chart 38).
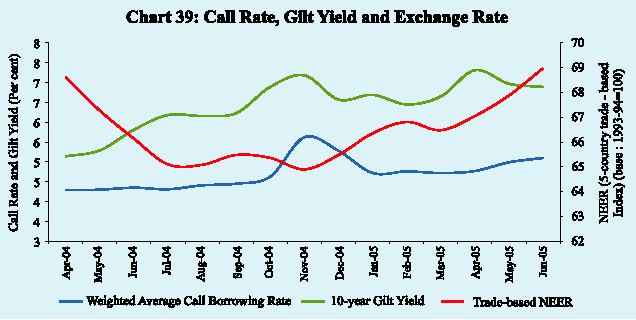
Financial markets in India remained stable during of 2005-06. Q1 Comfortable
liquidity kept money market segments aligned with the reverse repo rate during
the greater part of the quarter. The foreign exchange market remained orderly.
The possibility of the Chinese yuan revaluation exerted moderate upward pressure
on the exchange rate, in line with the experience of most Asian currencies.
Forward premia declined sharply in tandem with the movement of the rupee in
the spot segment. Yields in the Government securities market hardened in April
2005, reflecting the impact of higher crude oil prices and increase in the reverse
repo rate but eased thereafter with ebbing of inflationary pressures (Chart
39).
In the credit market, increased activity and some edging
up of select interest rates was recorded as commercial credit offtake continued
to remain strong and broad-based. The equity market staged a strong rally which
pushed the BSE Sensex to new highs beyond the 7300 level in July 2005 (Table 24).
|
Table 24: Domestic Financial Markets at a Glance |
|
Month |
Call Money |
Govt. Securities |
Foreign Exchange |
Liquidity Management |
Equity |
|
Average
Daily
Turnover(Rs. crore) |
Average
Call
Rates(Percent) |
10-
Year
Yield (Percent) |
Turnover
in Govt.
Securities (Rs. crore)+ |
Average
Daily
Inter- bank Turnover (US $ million) |
Average
Exchange
Rate(Rs. per US $) Purchases |
RBI’s net
Foregin
Currency Sales(-)/Purchases (+)(US $ million) |
Forward
Premia
3-month (Per cent) |
MSS
Out-
standing (Rs. crore) |
Average
Daily
Reverse Repo (LAF) Outstanding (Rs. crore) |
Average
Daily
BSE Turnover (Rs. crore) |
Average
Daily
NSE Turnover (Rs. crore) |
Average
BSE
Sensex |
Average
S&P
CNX Nifty |
|
|
|
1 |
2 |
3 |
4 |
5 |
6 |
7 |
8 |
9 |
10 |
11 |
12 |
13 |
14 |
15 |
|
2004-05 |
|
|
|
|
|
|
|
|
|
|
|
|
|
|
|
April |
12,916 |
4.29 |
5.14 |
3,00,864 |
10,118 |
43.93 |
7,427 |
(-) 0.36 |
22,851 |
75,006 |
2,243 |
5,048 |
5,809 |
1,848 |
|
May |
10,987 |
4.30 |
5.29 |
1,92,264 |
8,521 |
45.25 |
-220 |
(-)1.33 |
30,701 |
74,502 |
2,188 |
4,710 |
5,205 |
1,640 |
|
June |
10,973 |
4.35 |
5.81 |
1,75,802 |
7,741 |
45.51 |
-413 |
0.93 |
37,812 |
61,981 |
1,681 |
3,859 |
4,824 |
1,506 |
|
July |
8,632 |
4.31 |
6.18 |
1,30,400 |
7,684 |
46.04 |
-1,180 |
2.25 |
46,206 |
59,594 |
1,793 |
4,265 |
4,973 |
1,568 |
|
August |
11,562 |
4.41 |
6.16 |
1,29,373 |
5,753 |
46.34 |
-876 |
2.85 |
51,635 |
42,692 |
1,736 |
3,948 |
5,144 |
1,615 |
|
September |
17,088 |
4.45 |
6.23 |
1,75,635 |
7,266 |
46.10 |
19 |
2.20 |
52,255 |
31,589 |
1,800 |
4,023 |
5,423 |
1,692 |
|
October |
16,667 |
4.63 |
6.89 |
1,12,709 |
7,039 |
45.78 |
-99 |
2.87 |
55,087 |
10,805 |
1,730 |
3,785 |
5,702 |
1,795 |
|
November |
13,820 |
5.62 |
7.18 |
78,225 |
9,808 |
45.13 |
3,792 |
2.16 |
51,872 |
-5,066 |
1,786 |
4,102 |
5,961 |
1,874 |
|
December |
19,527 |
5.28 |
6.57 |
1,33,447 |
9,309 |
43.98 |
1,393 |
2.03 |
53,481 |
7,570 |
2,183 |
5,026 |
6,394 |
2,022 |
|
January |
16,534 |
4.72 |
6.69 |
1,10,535 |
8,703 |
43.75 |
0 |
2.50 |
54,499 |
18,721 |
2,310 |
5,249 |
6,307 |
1,978 |
|
February |
16,041 |
4.76 |
6.45 |
1,29,917 |
11,404 |
43.68 |
4,974 |
1.99 |
60,835 |
19,895 |
2,484 |
4,999 |
6,595 |
2,067 |
|
March |
15,293 |
4.72 |
6.65 |
87,892 |
10,645 |
43.69 |
6,030 |
1.82 |
64,211 |
29,809 |
2,706 |
5,139 |
6,679 |
2,096 |
|
2005-06 |
|
|
|
|
|
|
|
|
|
|
|
|
|
|
|
April |
17,213 |
4.77 |
7.31 |
90,040 |
9,440 |
43.74 |
0 |
1.96 |
67,087 |
30,675 |
1,890 |
4,136 |
6,379 |
1,987 |
|
May |
15,269 |
4.99 |
6.97 |
1,17,969 |
9,759 |
43.49 |
0 |
1.57 |
69,016 |
13,916 |
1,971 |
3,946 |
6,483 |
2,002 |
|
June |
20,135 |
5.10 |
6.89 |
2,04,197 |
10,837 |
43.58 |
– |
1.40 |
71,681 |
22,754 |
2,543 |
4,843 |
6,926 |
2,134 |
|
+:Outright turnover in Central Government dated securities. BSE:The Stock Exchange, Mumbai. – : Not available.
NSE:National Stock Exchange of India Ltd. LAF: Liquidity Adjustment Facility.
MSS: Market Stabilisation Scheme. |
Money Market
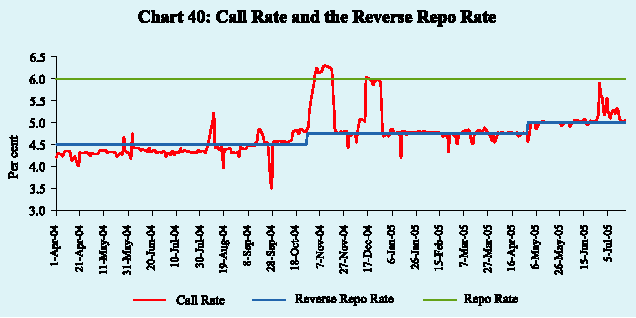
Money markets began Q1 of 2005-06 under conditions of comfortable liquidity stemming from the overhang in the system. Despite capital outflows in April, the Reserve Bank had to supplement reverse repo operations with sale of Government paper under the Market Stabilisation Scheme (MSS) to absorb liquidity and balance market conditions. Average daily call money borrowing rates ruled at sub-reverse repo rate levels on many occasions. With the increase in the fixed reverse repo rate by 25 basis points on April 29, 2005, call rates also edged up by a similar magnitude. Towards the end of June 2005, call rates rose above the reverse repo rate under demand pressures emanating from advance tax payments, scheduled Treasury Bills auctions and a higher oil import bill (Chart 40). The Reserve Bank injected Rs.210 crore and Rs.575 crore under the LAF repo on June 28, 2005 and June 30, 2005, respectively, to assuage the demand pressure. Call money rates eased by mid-July, 2005 and stood at 5.04 per cent on July 20, 2005.
On account of change over of the benchmark for calculation of prudential limits
from owned funds (sum of Schedule I and II capital) to capital funds (sum of
Tier I and II capital) for scheduled commerial banks as also some tightening
in the liquidity conditions, the call market turnover increased in June 2005
(Table 25).
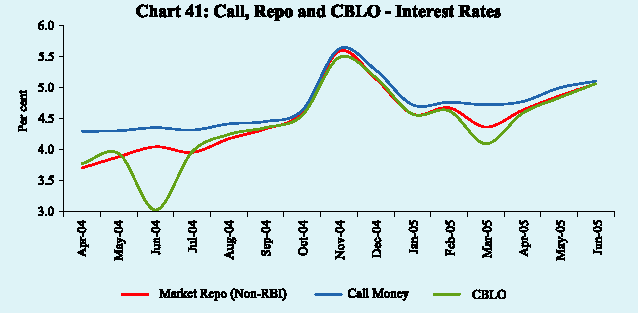
Collateralised Borrowing and Lending Obligations (CBLO) transactions continued to expand as it provides funds at lower cost (Chart 41). The supply of funds in the CBLO segment has also been augmented by the participation of mutual funds and financial institutions. Members operating in the CBLO segment of the Clearing Corporation of India Limited (CCIL) increased from 110 members in March 2005 to 115 by June 2005.
|
Table 25: Turnover in Money Markets |
| |
|
|
(Rs. crore) |
| |
|
|
|
|
Month |
Call /Notice Money |
CBLO |
Market Repo |
| |
|
|
|
|
1 |
2 |
3 |
4 |
|
2004-05 |
|
|
|
|
April |
12,916 |
2,496 |
15,195 |
|
May |
10,987 |
3,872 |
15,932 |
|
June |
10,973 |
4,015 |
17,517 |
|
July |
8,632 |
4,508 |
19,226 |
|
August |
11,562 |
4,962 |
13,561 |
|
September |
17,088 |
6,149 |
18,178 |
|
October |
16,667 |
8,466 |
15,719 |
|
November |
13,820 |
9,651 |
18,560 |
|
December |
19,527 |
9,962 |
21,922 |
|
January |
16,534 |
7,701 |
17,556 |
|
February |
16,041 |
8,952 |
17,562 |
|
March |
15,293 |
9,625 |
14,688 |
|
2005-06 |
|
|
|
|
April |
17,213 |
10,369 |
12,174 |
|
May |
15,269 |
12,233 |
13,688 |
|
June |
20,147 |
12,075 |
17,163 |
Treasury Bills
Comfortable liquidity conditions at the beginning of Q1of 2005-06 evinced a favourable market response to Treasury Bill (TB) auctions which was reflected in high bid-cover ratios (competitive bid amount received to notified amount) for 91-day TBs (Table 26). Bid-cover ratios declined in June 2005 as there was some liquidity tightening. 182-day TBs, which were reintroduced in April 2005, also attracted the interest of market participants.
|
Table 26: Treasury Bills in the Primary Market |
|
Month |
Average Implicit Yield at Minimum |
|
Bid-Cover Ratio |
| |
Cut-off Price (Per cent) |
|
|
|
| |
91-day |
182-day |
364-day |
91-day |
182-day |
364-day |
| |
|
|
|
|
|
|
|
1 |
2 |
3 |
4 |
5 |
6 |
7 |
|
2004-05 |
|
|
|
|
|
|
|
April |
4.38 |
|
4.44 |
2.15 |
|
2.47 |
|
May |
4.39 |
|
4.33 |
2.93 |
|
2.46 |
|
June |
4.44 |
|
4.55 |
2.61 |
|
1.28 |
|
July |
4.46 |
|
4.60 |
2.39 |
|
2.06 |
|
August |
4.76 |
|
5.00 |
1.81 |
|
3.36 |
|
September |
4.72 |
|
5.14 |
2.51 |
|
2.83 |
|
October |
5.15 |
|
5.46 |
1.82 |
|
2.75 |
|
November |
5.47 |
|
5.71 |
2.80 |
|
2.64 |
|
December |
5.30 |
|
5.69 |
2.69 |
|
2.81 |
|
January |
5.31 |
|
5.69 |
2.19 |
|
2.06 |
|
February |
5.25 |
|
5.65 |
2.99 |
|
2.81 |
|
March |
5.24 |
|
5.63 |
2.31 |
|
2.74 |
|
2005-06 |
|
|
|
|
|
|
|
April |
5.17 |
5.36 |
5.62 |
4.03 |
4.48 |
2.54 |
|
May |
5.19 |
5.35 |
5.58 |
3.30 |
3.37 |
2.29 |
|
June |
5.29 |
5.37 |
5.61 |
1.54 |
2.42 |
1.81 |
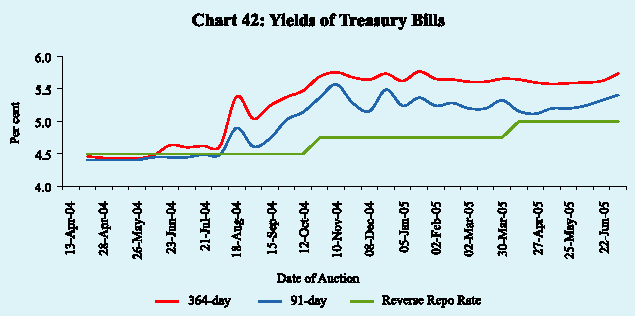
Primary yields edged down marginally during the quarter, enabled by softening of headline inflation. The yield spread between the 91-day and 364-day TBs at about 30 basis points in June 2005 was generally comparable with the second half of 2004-05 (Chart 42).
Other
Money Market Instruments
The commercial paper (CP) market
remained buoyant in line with seasonal trends.Outstanding CPs increased from
Rs.14,235 crore at end-March 2005 to Rs.17,782 crore by June 30, 2005. Leasing
and finance companies continue to be the largest issuers of CPs, partly reflecting
the policy of phasing out the access of these companies to public deposits.
These companies had a share of 59.6 per cent in the total CP outstanding at
end-June 2005. Despite a pick-up in issuances, the weighted average discount
rate (WADR) on CPs softened by five basis points during the quarter to 5.79
per cent on June 30, 2005 over its level on March 31, 2005, reflecting comfortable
liquidity conditions (Chart 43).
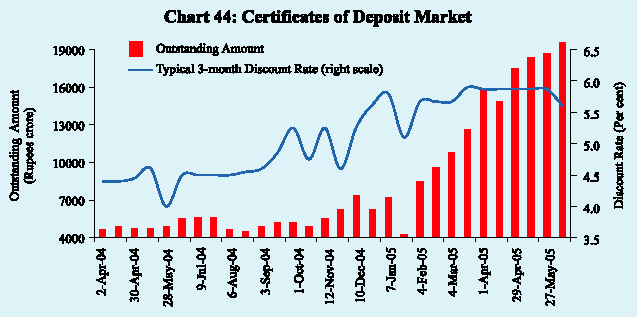
The market for certificates of deposit (CDs) also
remained buoyant during of 2005-06, reflecting banks' demand for funds in the
wake of the acceleration Q1 in demand for bank credit. The amount of
CDs outstanding increased from Rs.14,975 crore in early April 2005 to Rs.18,503
crore by mid-June 2005 mainly on account of higher issuances by some private sector
banks. The higher recourse to CDs was also driven by the reduction in the minimum
maturity period to seven days. The typical three-month discount rate on CDs remained
broadly stable during the quarter (Chart 44).
The market for forward rate agreements and interest
rate swaps (FRAs/ IRS) continued to expand with the participation of select public
sector banks, primary dealers (PDs) and foreign and private sector banks (Table
27).
|
Table 27: Forward Rate Agreements and Interest Rate Swaps |
|
Month |
No. of Contracts |
Notional Amount |
| |
|
(Rs. crore) |
|
1 |
2 |
3 |
| |
|
|
|
2004-05 |
|
|
|
April |
20,413 |
5,76,808 |
|
May |
23,331 |
6,11,595 |
|
June |
22,670 |
6,04,669 |
|
July |
23,013 |
5,90,118 |
|
August |
23,880 |
6,40,173 |
|
September |
31,252 |
8,53,195 |
|
October |
34,371 |
9,25,175 |
|
November |
32,996 |
9,50,151 |
|
December |
37,507 |
9,75,135 |
|
January |
39,083 |
10,14,442 |
|
February |
35,724 |
9,46,293 |
|
March |
37,864 |
10,62,242 |
|
2005-06 |
|
|
|
April |
38,386 |
10,76,513 |
|
May |
39,923 |
10,72,684 |
|
June |
41,174 |
10,93,367 |
Foreign Exchange Market
In the foreign exchange market,
outflows by FIIs and a higher merchandise trade deficit could not prevent the
rupee from firming up against the US dollar from Rs. 43.7550 at end-March 2005
to Rs. 43.2950 per US dollar on May 12, 2005. In subsequent weeks, the Indian
rupee depreciated to Rs. 43.7600 per US dollar on June 2, 2005 due to strengthening
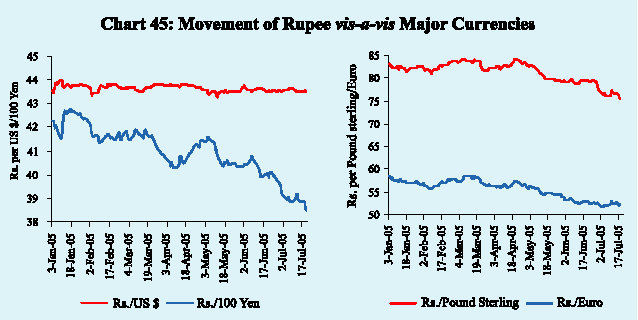
of the US dollar in the international markets. On the whole, the Indian rupee
appreciated by 0.6 per cent to Rs.43.5150 per US dollar on June 30, 2005 over
its level on March 31, 2005. Reflecting cross-currency movements, the rupee
also appreciated against the other major international currencies: the Euro
(7.5 per cent), the Pound sterling (4.3 per cent) and the Japanese yen (3.3
per cent) (Chart 45). This resulted in an appreciation of the nominal effective
exchange rate (NEER) by 3.8 per cent during the quarter. The rupee remained
broadly stable against the US dollar thereafter and stood at Rs. 43.5400 per
US dollar as on July 20, 2005.
Spot market conditions kept forward premia low
during Q1 of 2005-06. Forward premia also declined in view of the announcement
relating to phasing out the Mumbai Inter-bank Forward Offered Rate (MIFOR) from
pricing interest rate derivative deals for non-banks (Chart 46). Forward premia
recovered marginally in July 2005.
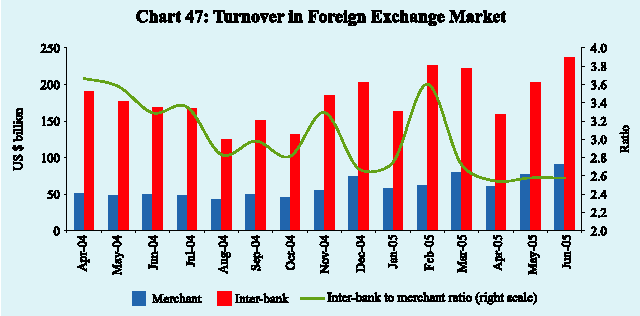
Volumes in the foreign exchange
market were subdued during the quarter. The turnover in the foreign exchange
market (both merchant and inter-bank) dropped sharply to US $ 223.6 billion
in April 2005 from US $ 305.7 billion in the previous month. Transaction volumes,
however, recovered to US $ 284.4 billion in May 2005 and further to US $ 330.9
billion in June 2005 (Chart 47).
Credit Market
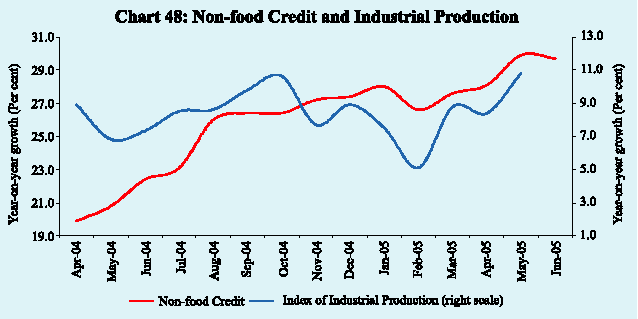
The demand for credit from the commercial sector strengthened further of 2005-06
(Chart 48). As on July 8, 2005 the year-on-year non-food during Q1 credit grew
by 30.6 per cent (net of conversion) on top of 23.0 per cent growth in the corresponding
period of the previous year. Food credit extended by the banking system in the
first quarter of 2005-06 was lower as compared with the corresponding period
of the previous year on account of lower procurement.
Incremental credit to medium and large industries more than trebled to Rs.42,976
crore during 2004-05 (Table 28). Credit to the priority sector
continued to grow at a strong pace. In particular, credit
to agriculture accelerated by 35.2 per cent during 2004-05 from 23.2 per cent
during the previous year. There was also a sustained expansion in credit to
small-scale industries, housing and personal loans.
|
Table 28: Deployment of Non-food Bank Credit –Variations |
|
(Rupees crore) |
| |
Sector/Industry |
|
2003-04 |
2004-05 |
| |
|
Absolute |
Per cent |
Absolute |
Per cent |
| |
1 |
2 |
3 |
4 |
5 |
|
1. |
Priority sector# |
52,225 |
24.7 |
81,793 |
31.0 |
| |
Agriculture |
17,023 |
23.2 |
31,829 |
35.2 |
| |
Small Scale Industries |
5,461 |
9.0 |
10,259 |
15.6 |
| |
Others |
29,741 |
38.3 |
39,705 |
37.0 |
|
2. |
Industry (Medium & Large) |
12,042 |
5.1 |
42,976 |
17.4 |
| |
Petroleum |
-2,477 |
-16.8 |
2,352 |
19.2 |
| |
Infrastructure |
10,927 |
41.6 |
19,485 |
52.3 |
| |
Other Metal & |
-388 |
-4.5 |
1,428 |
17.5 |
| |
Metal Products |
|
|
|
|
| |
Construction |
1,087 |
22.2 |
1,985 |
33.2 |
| |
Drugs & Pharmaceuticals |
775 |
9.8 |
2,007 |
23.2 |
| |
Gems & Jewellery |
1,645 |
21.8 |
2,945 |
32.1 |
| |
Rubber & Rubber Products |
-69 |
-2.6 |
568 |
21.9 |
| |
Cotton Textiles |
1,404 |
8.9 |
2,845 |
16.6 |
| |
Automobiles |
-327 |
-5.8 |
1,061 |
20.0 |
| |
Cement |
-742 |
-11.5 |
423 |
7.4 |
|
3. |
Housing |
15,394 |
42.1 |
23,192 |
44.6 |
|
4. |
Non-Banking Financial |
2,675 |
18.9 |
1,808 |
10.8 |
| |
Companies |
|
|
|
|
|
5. |
Wholesale Trade |
2,289 |
10.1 |
8,947 |
36.0 |
|
6. |
Export Credit |
8,485 |
17.2 |
8,227 |
14.3 |
|
7. |
Non-food Gross Bank Credit |
1,08,367 |
17.5 |
2,03,044 |
27.9 |
|
# : Excluding investment in eligible securities.
Note :Data are provisional and relate to select scheduled commercial banks which account for about 90 per cent of bank credit of all scheduled commercial banks. |
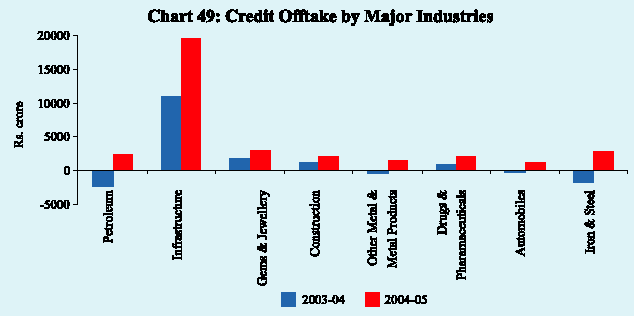
The sharp increase in industrial credit during 2004-05 was
dominated by seven sectors, viz., infrastructure, petroleum, construction,
gems and jewellery, cotton textiles, drugs and pharmaceuticals and iron and
steel which accounted for as much as 65 per cent of the incremental offtake
during the year. The higher demand for credit by infrastructure industries and
construction was in consonance with their strong performance. Growth in credit
to the roads and ports sector, in particular, accelerated to 83.2 per cent during
2004-05 from 67.3 per cent during the previous year. Petroleum credit increased
by 19.2 per cent in contrast to the decline of 16.8 per cent in the previous
year. The turnaround was due to an incomplete pass-through of the increase in
international crude oil prices to domestic petroleum products prices. The higher
credit to the gems and jewellery sector was driven by export demand. Other industries
which recorded higher credit offtake were other metal and metal products, rubber
and rubber products and other textiles (Chart 49).
During April 2005, credit to medium and large industries increased
by 5.2 per cent as compared with 2.4 per cent in the corresponding period of
pervious year, indicating the buoyancy in industrial growth. Housing and real
estate loans continued to grow at a high rate.
Public sector banks (PSBs) realigned their deposit rates in the tenor of one
year and above from a range of 4.75-7.00 per cent in March 2005 to 5.25-6.50
per cent by June 2005. Deposit rates of private banks for more than three years
maturity edged up by 25 basis points (Table 29). Benchmark prime lending rates
|
Table 29: Movements in Deposit and Lending Rates |
|
(Percent)
|
|
Interest Rate |
March |
June |
September |
December |
March |
June |
| |
|
|
2004 |
2004 |
2004 |
2004 |
2005 |
2005@ |
| |
|
|
|
|
|
|
|
|
|
1 |
|
|
2 |
3 |
4 |
5 |
6 |
7 |
| |
|
|
|
|
|
|
|
|
|
1. |
Domestic Deposit Rate |
|
|
|
|
|
|
| |
Public Sector Banks |
|
|
|
|
|
|
| |
|
Up to 1 year |
3.75-5.25 |
3.50-5.25 |
3.50-5.00 |
3.50-5.00 |
2.75-6.00 |
2.75-6.00 |
| |
|
More than 1 year and up to 3 years |
5.00-5.75 |
5.00-5.75 |
4.75-5.75 |
4.75-5.50 |
4.75-6.50 |
5.25-6.00 |
| |
|
More than 3 years |
5.25-6.00 |
5.25-5.75 |
5.25-5.75 |
5.00-5.75 |
5.25-7.00 |
5.50-6.50 |
| |
Private Sector Banks |
|
|
|
|
|
|
| |
|
Up to 1 year |
3.00-6.00 |
3.00-6.00 |
3.00-6.00 |
3.00-6.00 |
3.00-6.25 |
3.00-6.50 |
| |
|
More than 1 year and up to 3 years |
5.00-6.50 |
5.00-6.50 |
5.00-6.50 |
5.00-6.75 |
5.25-7.25 |
5.00-7.00 |
| |
|
More than 3 years |
5.25-7.00 |
5.25-7.00 |
5.25-7.00 |
5.25-6.50 |
5.75-7.00 |
5.75-7.25 |
| |
Foreign Banks |
|
|
|
|
|
|
| |
|
Up to 1 year |
2.75-7.75 |
2.75-7.50 |
2.75-7.50 |
3.00-5.75 |
3.00-6.25 |
3.00-5.50 |
| |
|
More than 1 year and up to 3 years |
3.25-8.00 |
3.25-8.00 |
3.25-8.00 |
3.50-7.00 |
3.50-6.50 |
3.50-6.50 |
| |
|
More than 3 years |
3.25.800 |
3.25-8.00 |
3.25-8.00 |
3.50-7.00 |
3.50-7.00 |
4.00-7.00 |
|
2. |
Benchmark Prime Lending Rate |
|
|
|
|
|
|
| |
|
Public Sector Banks |
10.25-11.50 |
10.25-11.50 |
10.25-11.50 |
10.25-11.25 |
10.25-11.25 |
10.25-11.25 |
| |
|
Private Sector Banks |
10.50-13.00 |
9.75-13.00 |
9.75-13.00 |
10.50-13.50 |
11.00-13.50 |
11.00-13.50 |
| |
|
Foreign Banks |
11.00-14.85 |
11.00-14.85 |
11.00-14.85 |
10.00-15.00 |
10.00-14.50 |
10.00-14.50 |
|
3. |
Actual Lending Rate* |
|
|
|
|
|
|
| |
|
Public Sector Banks |
4.00-16.00 |
4.25-16.00 |
2.75-16.00 |
3.50-19.50 |
2.75-16.00 |
– |
| |
|
Private Sector Banks |
4.50-22.00 |
4.00-22.19 |
3.15-21.48 |
2.62-22.00 |
3.55-23.50 |
– |
| |
|
Foreign Banks |
3.75-23.00 |
3.75-23.00 |
2.55-23.00 |
3.00-23.00 |
3.15-22.00 |
– |
|
@:As on June 10, 2005. – : Not Available.
*:Interest rate on non-export demand and term loans above Rs.2 lakh excluding lending rates at the extreme
5 per cent on both sides. |
(BPLR) remained unchanged, despite higher credit demand. Sub-PLR
lending of the banking system (excluding exports, the bulk of which is at sub-PLR)
constituted over 65 per cent of total outstanding advances above Rs.2 lakh.
Government Securities Market
The Government securities market was influenced by domestic liquidity of 2005-06.
Yields started to conditions and inflationary expectations during Q1 harden
from the second week of April 2005, reflecting concerns arising from the persistent
rise in international crude oil prices, higher than expected inflation and an
expected hike in the reverse repo rate. Higher credit offtake also led to a
contraction in surplus bank liquidity and reduced the market appetite for Government
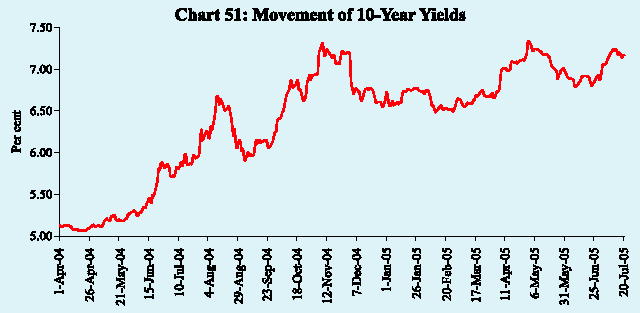
paper (Chart 50). The 10-year benchmark firmed up to 7.31 per cent on April
30, 2005 from 6.65 per cent on March 31, 2005.
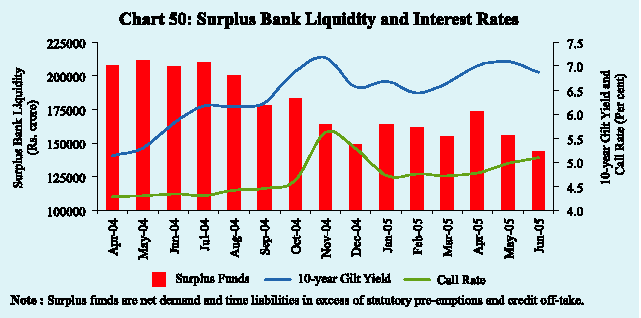
Yields softened during the first three weeks of May 2005 with
the decline in international crude oil prices and easing of inflation. As crude
oil prices renewed their upward climb, the 10-year yield hardened to 6.89 per
cent on June 30, 2005 (Chart 51). Thus, yields increased by 24 basis points
between end-March and end-June 2005. The 10-year yield stood at 7.17 per cent
as on July 20, 2005.
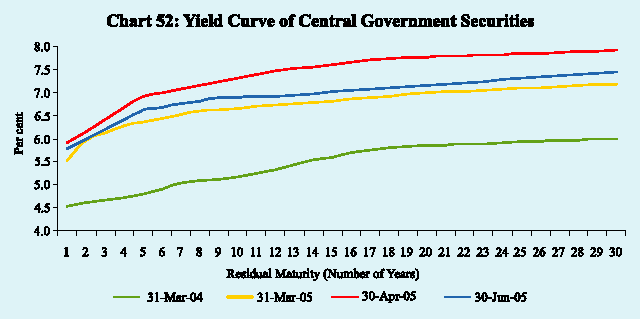
The yield curve shifted upwards with the hardening of yields
across the maturity spectrum (Chart 52). The spread between 1-year and 10-year
yields declined marginally to 111 basis points at end-June 2005 (from 114 basis
points at end-March) while that between 10-year and 30-year yields increased
marginally to 56 basis points (from 54 basis points at end-March).
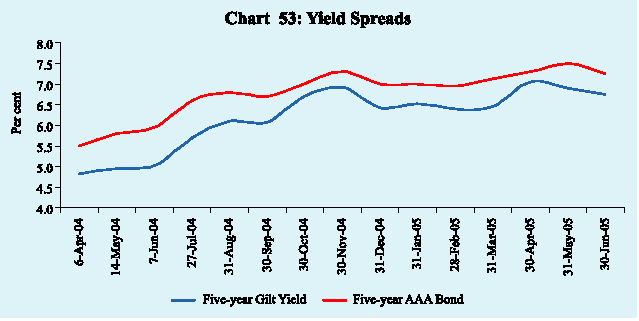
In line with the Government securities market, the yields on 5-year AAA-rated
corporate bonds edged up by 11 basis points at end-June 2005 over their
end-March level. The yield spread
between 5-year Government securities and 5-year AAA-rated corporate bonds at
50 basis points was almost the same as at end-March 2005 (Chart 53).
Equity Market
The capital market exhibited strong pick-up in activity and sentiment during
of 2005-06. The number of issuances in the primary segment rose sharply, Q1
although the amounts raised were somewhat lower. Equity issues continued to
remain the preferred choice of corporates for raising funds. The amounts mobilised
from international markets by Indian corporates increased sharply. The stock
markets recovered from the weakness observed in April 2005 and gained strength
during May-June 2005 buoyed by encouraging financial results by several corporates
as well as firm trends in international markets. The stock markets remained
impervious to the net sales by FIIs, partly due to strong support from domestic
institutional investors. In June and July 2005, the BSE Sensex reached new highs,
closing at 7,347.10 on July 18, 2005.
Primary Market
Resource mobilisation through public issues (excluding offers
for sale) during April-June, 2005 amounted to Rs.3,884 crore through 25 issues
as compared with Rs.3,251 crore through five issues during April-June, 2004
(Chart 54). The average size of public issues was substantially lower at Rs.155
crore in April-June, 2005 than Rs.650 crore in the corresponding period of the
previous year.
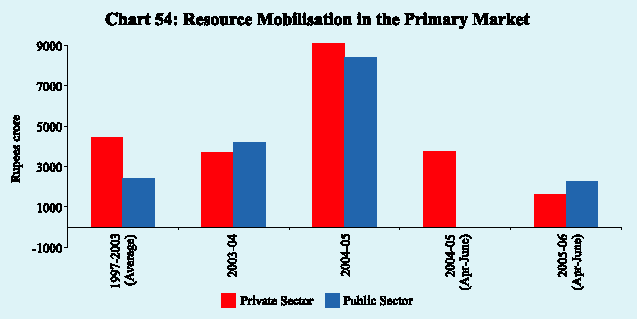
Non-Government public limited companies (private sector) accounted
for 41.6 per cent of resources mobilised by way of public issues. Two public
sector banks raised equity worth Rs.2,270 crore. Out of 25 issues, thirteen
issues were initial public offerings (IPOs) constituting 25 per cent of total
resource mobilisation. All the IPOs in the current financial year so far have
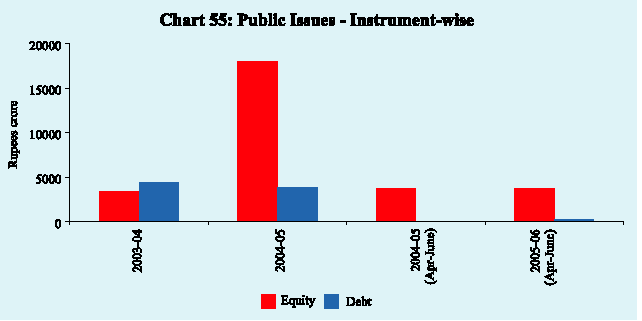
been by companies in the private sector. The bulk of resources were raised by
way of equity issues (Chart 55).
During April-June 2005, the resources raised through Euro issues
by Indian corporates increased by 138.5 per cent. There were six Euro issues
during April-June 2005 amounting to Rs.1,834 crore as compared with four issues
of Rs.769 crore during April-June 2004.
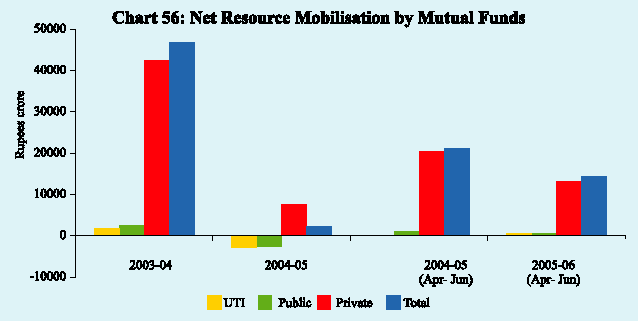
The gross mobilisation of funds by mutual funds increased marginally
during April-June 2005 by 1.7 per cent to Rs.2,08,996 crore over the corresponding
period of the previous year. As most of the mutual fund schemes witnessed large
redemptions under their various schemes, net funds mobilised declined by 32.5
per cent to Rs.14,273 crore during April-June 2005 over the corresponding period
of the previous year (Chart 56). Scheme-wise, 73.6 per cent of the gross mobilisation
of funds was under liquid/money market oriented schemes during April-June 2005.
Redemption pressures were high in the case of debt-oriented schemes on expectation
of a further hardening of interest rates. Net mobilisation of resources under
growth/equity oriented schemes maintained their upward trend during April-June
2005, mainly due to attractive returns in a buoyant secondary market.
Secondary Market
The major stock indices underwent a correction from all-time
high levels on post-budget enthusiasm in early March 2005 (Chart 57). The markets
turned weak during April 2005 with rising international crude oil prices, a
cautious approach adopted by investors ahead of the last quarter financial results
of the companies and a slowdown in investments by foreign institutional investors
(FIIs). Buoyancy returned in May 2005 with the declaration of strong financial
results by corporates and the Government's decision to divest 10 per cent stake
in Bharat Heavy Electricals Limited (BHEL). Fall in international crude oil
prices,
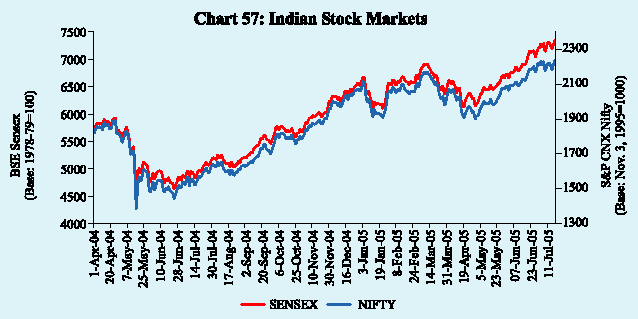
announcement of fresh reform measures in the banking sector and firm trends
in major international markets also helped in improving the market sentiment.
The stock market was buoyed up further in the third week of
June 2005 with the settlement of the Reliance family dispute and the onset of
the monsoon. On July 18, 2005, the BSE Sensex closed at a historical high of
7347.10. The BSE Sensex registered an increase of 10.8 per cent on a point-to-point
basis between end-June 2005 and end-March 2005. On an average basis, the BSE
Sensex rose by 25.5 per cent during April-June 2005 over the corresponding period
of the previous year, while the S&P CNX Nifty recorded an increase of 23.2
per cent (Table 30). The price-earnings (P/E) ratio at 16.0 as at end-June 2005
was marginally higher than that of 15.6 as at end-March 2005.
|
Table 30: Stock Market Indicators |
|
Indicator |
|
BSE |
|
|
NSE |
|
|
| |
|
|
|
|
|
|
|
|
| |
2003-04 |
2004-05 |
April-June |
2003-04 |
2004-05 |
April-June |
| |
|
|
2004-05 |
2005-06 |
|
|
2004-05 |
2005-06 |
| |
|
|
|
|
|
|
|
|
|
1 |
2 |
3 |
4 |
5 |
6 |
7 |
8 |
9 |
| |
|
|
|
|
|
|
|
|
|
Average BSE Sensex/ |
|
|
|
|
|
|
|
|
|
S&P CNX Nifty |
4492.19 |
5740.99 |
5263.54 |
6607.70 |
1427.5 |
1805.26 |
1659.49 |
2044.32 |
|
Volatility |
23.0 |
11.2 |
8.7 |
4.3 |
23.3 |
11.28 |
9.6 |
4.0 |
|
P/E Ratio |
|
|
|
|
|
|
|
|
|
(End-period)* |
18.57 |
15.61 |
14.23 |
16.03 |
20.70 |
14.60 |
12.64 |
14.31 |
|
Turnover |
|
|
|
|
|
|
|
|
|
(Rs. crore) |
5,02,618 |
5,18,716 |
1,27,291 |
1,39,647 |
10,99,535 |
11,40,071 |
2,84,769 |
2,80,917 |
|
Market Capitalisation |
|
|
|
|
|
|
|
|
|
(Rs. crore) |
|
|
|
|
|
|
|
|
|
(End-period) |
12,01,207 |
16,98,428 |
10,47,258 |
18,50,377 |
11,20,976 |
15,85,585 |
9,79,700 |
17,27,502 |
|
* : For 30 scrips included in the BSE Sensex and 50 scrips included in the S & P CNX NIfty.
Source : The Stock Exchange, Mumbai (BSE) and National Stock Exchange of India Ltd. (NSE). |
The rally in the stock markets during April-June 2005 was spread
across mid-cap and small-cap stocks. The BSE 500 increased by 7.1 per cent on
a point-to-point basis in April-June 2005. The major sectoral indices registered
gains in line with the broad trends in the stock market as well as sector-specific
developments (Chart 58). The consumer durables index rose sharply (34.0 per
cent) on account of robust corporate results led by increase in sales in electronics
and auto segments. Fast moving consumer goods (FMCG) shares also performed well
(21.8 per cent) due to progress of monsoon and solid consumer demand. The capital
goods scrips were buoyant (14.2 per cent) due to strong industrial activity
and positive investment climate. Public sector undertaking scrips witnessed
some gains (2.5 per cent) mainly due to the decision of the Government to divest
its stake in BHEL by 10 per cent. Satisfactory corporate results from software
majors and the success of Infosys in raising funds through a secondary issue
of ADRs contributed to the rise in IT sector scrips (7.3 per cent). The banking
sector scrips registered gains of 4.3 per cent due to announcement of fresh
reform measures by the Government such as providing voting rights to investors
in proportion to their shareholding in private sector banks.

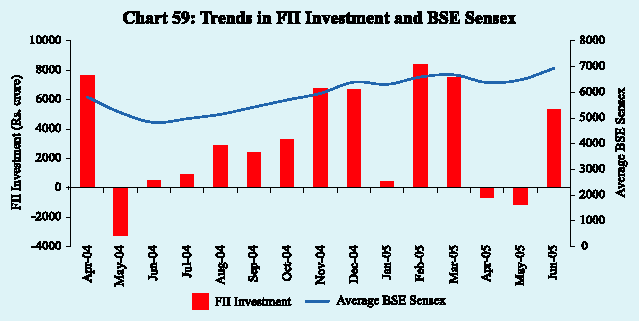
During April-May 2005, FIIs were net sellers in the equity
market at Rs.1,794 crore, in sharp contrast to net purchases of Rs.4,391 crore
during the corresponding period of the previous year (Chart 59). During June
2005, FIIs turned net buyers (Rs. 5,329 crore) more than offsetting the sales
during April-May 2005. Domestic mutual funds made net purchases in equities
of Rs.4,810 crore during April-May 2005, significantly higher than that of Rs.786
crore during the corresponding period of the previous year. During June 2005,
however, mutual funds made net sales of Rs. 1,759 crore.
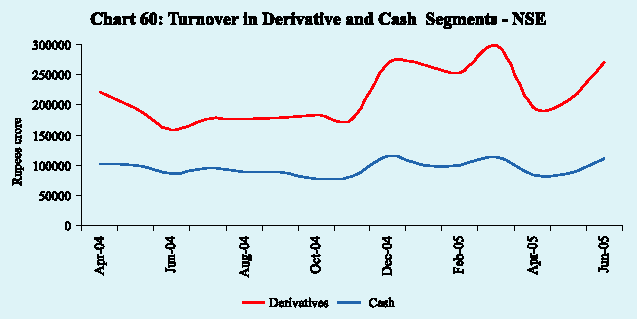
At the NSE, the total turnover in the cash segment declined
marginally by 1.4 per cent to Rs.2,80,917 crore during April-June 2005 over
the corresponding period of the previous year. The turnover in the NSE's derivative
segment continued to be higher than in the cash segment and increased by 17.8
per cent to Rs.6,75,579 crore during April-June 2005 over a year ago (Chart
60).
|