Centre's
Fiscal Position
With the
introduction of the Fiscal Responsibility and Budget Management (FRBM) Rules
2004, the year 2004-05 marked a new beginning in the Centre's fiscal consolidation
process. The revenue deficit was budgeted at 2.5 per cent of GDP for 2004-05
as against 3.6 per cent of GDP in the revised estimates (RE) for 2003-04. The
RE placed the revenue deficit for 2004-05 at 2.7 per cent of GDP. As against
the stipulation of a yearly reduction of 0.5 percentage points in the revenue
deficit to GDP ratio in the FRBM Rules, the actual reduction for 2004-05 turned
out to be higher at 0.9 percentage points. The required reduction of 0.3 percentage
points in the GFD to GDP ratio for 2004-05 under the FRBM Rules was also achieved
[The GFD to GDP ratio for 2004-05 was 4.5 per cent in the RE as against 4.8
per cent in 2003-04 (RE)]. Notwithstanding these corrections, the revised estimates
for 2004-05 exceeded the budgeted targets in respect of all the key deficit
indicators (Table 6). The slippage in the revenue deficit was mainly on account
of a shortfall of Rs. 8,102 crore in net tax revenue. The slippage in fiscal
deficit, albeit of a lower order was on account of reduction in non-defence
capital outlay by Rs.4,103 crore and lower net lending (loans and advances net
of recovery of loans) to the extent of Rs.2,976 crore.
|
Table
6 : Deficit Indicators of the Centre
|
| |
|
|
|
(Amount
|
in Rs.
crore)
|
| |
|
|
|
|
|
|
Item
|
2003-04
|
2004-05
(BE)
|
2004-05
(RE)
|
Variation
|
(4 over
3)
|
| |
|
|
|
Amount
|
Per
cent
|
|
1
|
2
|
3
|
4
|
5
|
6
|
| |
|
|
|
|
|
|
1. Gross Fiscal Deficit
|
1,23,272
|
1,37,407
|
1,39,231
|
1 ,
8 2 4
|
1 .
3
|
| |
(4.5)
|
(4.4)
|
(4.5)
|
|
|
|
2. Revenue Deficit
|
9 8
, 2 6 2
|
7 6
, 1 7 1
|
8 5
, 1 6 5
|
8 ,
9 9 4
|
1 1
. 8
|
| |
(3.6)
|
(2.5)
|
(2.7)
|
|
|
|
3. Gross Primary Deficit
|
-816
|
7 ,
9 0 7
|
1 3
, 3 2 6
|
5 ,
4 1 9
|
6 8
. 5
|
| |
(0.0)
|
(0.3)
|
(0.4)
|
|
|
|
BE: Budget Estimates.
RE: Revised
Estimates.
Note : Figures
in parentheses are percentages to GDP.
|
Revenue
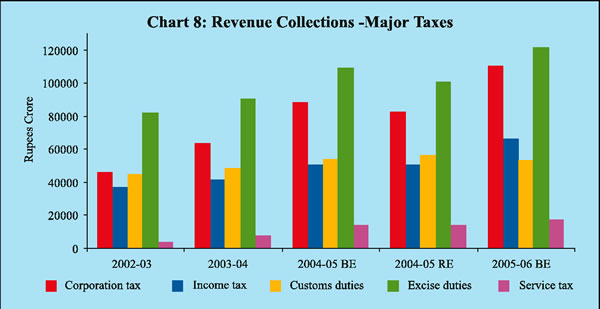
receipts of the Centre were lower by 2.7 per cent than their budgeted level
for 2004-05 due to decline in both tax and non-tax revenues. The gross tax revenue
was 3.7 per cent lower than the budget estimates (BE) mainly on account of lower
corporation tax collections and union excise duties (Chart 8). The lower collections
from excise duties reflected the post-budget reduction of duties in respect
of certain petroleum products and non-alloy steel to contain inflationary pressures.
The shortfall
in non-tax revenue was mainly due to lower interest receipts and external grants.
Dividends and profits exceeded BE. Non-debt capital receipts (comprising disinvestment
and recovery of loans) were significantly higher at 32.0 per cent of the total
capital receipts than the budgeted 18.5 per cent (Table 7). This was largely
on account of receipts under the Debt Swap Scheme (DSS) which enabled the States
to swap their high cost debt owed to the Central Government with additional
market borrowings and a part of current small savings transfers. Non-debt capital
receipts, after netting the receipts under debt swap, however, constituted 12.0
per cent of the total capital receipts.
|
Table
7 : Total Receipts of the Centre
|
| |
|
|
|
(Amount
|
in Rs. crore)
|
|
Item
|
2003-04
|
2004-05
(BE)
|
2004-05
(RE)
|
Variation
|
(4 over
3)
|
| |
|
|
|
Amount
|
Per
cent
|
|
1
|
2
|
3
|
4
|
5
|
6
|
|
1. Total Receipts
(2+3)
|
4,71,368
|
4,77,829
|
5,05,791
|
2 7
, 9 6 2
|
5 .
9
|
| |
(17.1)
|
(15.3)
|
(16.3)
|
|
|
|
2. Revenue Receipts
(i+ii)
|
2,63,878
|
3,09,322
|
3,00,904
|
-8,418
|
- 2
. 7
|
| |
(9.6)
|
(9.9)
|
(9.7)
|
|
|
|
i. Tax Revenue
|
1,86,982
|
2,33,906
|
2,25,804
|
-8,102
|
- 3
. 5
|
| |
(6.8)
|
(7.5)
|
(7.3)
|
|
|
|
ii. Non-tax Revenue
|
7 6
, 8 9 6
|
7 5
, 4 1 6
|
7 5
, 1 0 0
|
-316
|
- 0
. 4
|
| |
(2.8)
|
(2.4)
|
(2.4)
|
|
|
|
3. Capital Receipts
|
2 0
7 , 4 9 0
|
1 6
8 , 5 0 7
|
2 0
4 , 8 8 7
|
3 6
, 3 8 0
|
2 1
. 6
|
| |
(7.5)
|
(5.4)
|
(6.6)
|
|
|
|
of which:
|
|
|
|
|
|
|
Market Borrowings
|
8 8
, 8 6 9
|
9 0
, 3 6 5
|
4 5
, 9 4 3
|
-44,422
|
- 4
9 . 2
|
|
Recovery of Loans
|
6 7
, 2 6 5
|
2 7
, 1 0 0
|
6 1
, 5 6 5
|
3 4
, 4 6 5
|
1 2
7 . 2
|
|
Disinvestment proceeds
|
1 6
, 9 5 3
|
4 ,
0 0 0
|
4 ,
0 9 1
|
9 1
|
2 .
3
|
|
BE: Budget Estimates.
RE: Revised
Estimates.
Note :
Figures in parentheses are percentages to GDP.
|
Aggregate
expenditure was higher than the budgeted level by 5.9 per cent for 2004-05,
mainly on account of debt swap transactions. Aggregate expenditure net of debt
swap transactions, was, however, lower than the budget estimates by one per
cent (Table 8). The expenditure was compressed entirely in respect of the Plan
component in the form of a reduction of Rs.2,170 crore in the revenue account
and Rs.6,033 crore in the capital account.
|
Table
8 : Aggregate Expenditure of the Centre
|
| |
|
|
|
|
|
(Amount
|
in Rs.
crore)
|
|
Item
|
2003-04
|
2004-05
(BE)
|
2004-05
(RE)
|
|
Variation
|
(4 over
3)
|
| |
|
|
|
|
Amount
|
Per
cent
|
|
1
|
|
2
|
3
|
4
|
|
5
|
6
|
|
1.
|
Total Expenditure
|
4,25,157*
|
4,77,829
|
4,73,126*
|
-4,703
|
- 1
. 0
|
| |
( 2 + 3 = 4 + 5 )
|
(15.4)
|
(15.3)
|
(15.2)
|
|
|
|
|
2.
|
Non-Plan Expenditure
|
3,02,877*
|
3,32,239
|
3,35,739*
|
3
|
, 5
0 0
|
1 .
1
|
| |
|
(11.0)
|
(10.6)
|
(10.8)
|
|
|
|
| |
of which:
|
|
|
|
|
|
|
| |
Interest Payments
|
1,24,088
|
1,29,500
|
1,25,905
|
-3,595
|
- 2
. 8
|
| |
|
(4.5)
|
(4.1)
|
(4.1)
|
|
|
|
| |
Defence
|
6 0
, 0 6 6
|
7 7
, 0 0 0
|
7 7
, 0 0 0
|
|
0
|
0 .
0
|
| |
|
(2.2)
|
(2.5)
|
(2.5)
|
|
|
|
| |
Subsidies
|
4 4
, 2 5 6
|
4 3
, 5 1 6
|
4 6
, 5 1 4
|
2
|
, 9
9 8
|
6 .
9
|
| |
|
(1.6)
|
(1.4)
|
(1.5)
|
|
|
|
|
3.
|
Plan Expenditure
|
1,22,280
|
1,45,590
|
1,37,387
|
-8,203
|
- 5
. 6
|
| |
|
(4.4)
|
(4.7)
|
(4.4)
|
|
|
|
|
4.
|
Revenue Expenditure
|
3,62,140
|
3,85,493
|
3,86,069
|
|
5 7
6
|
0 .
1
|
| |
|
(13.1)
|
(12.3)
|
(12.4)
|
|
|
|
|
5.
|
Capital Expenditure
|
6 3
, 0 1 7 *
|
9 2
, 3 3 6
|
8 7
, 0 5 7 *
|
-5,279
|
- 5
. 7
|
| |
|
(2.3)
|
(3.0)
|
(2.8)
|
|
|
|
|
*:Net of the repayments
made to the NSSF.
BE: Budget Estimates.
RE: Revised Estimates.
Note : Figures in parentheses are percentages to GDP.
|
Non-Plan
revenue expenditure was marginally higher than the BE, mainly on account of
higher fertiliser subsidies due to increase in their input cost (Chart 9). Interest
payments were, however, lower mainly due to less than anticipated recourse to
market borrowings and substitution of high cost loans with low cost loans.

A notable
feature of the Central Government finances during 2004-05 was the persistence
of surplus cash balances held by the Government with the Reserve Bank. While
this reflected, to a large extent, debt swap proceeds and advance tax payments,
particularly in the third quarter of the year, it also represented compression
in expenditure. Owing to the availability of surplus cash balances, the Central
Government cancelled its auctions for market borrowings of the order of Rs.18,000
crore during October-December 2004. The Central Government had also ended the
preceding financial years 2003-04 and 2002-03 with surplus cash positions.
Financing of the Union Budget
Gross market
borrowings of the Centre for 2004-05 were budgeted at Rs.1,50,817 crore and
the net market borrowings at Rs.90,365 crore. The RE placed the net market borrowings
at Rs.45,943 crore which were 49.2 per cent lower than the budget estimates.
Although the DSS transactions are deficit neutral, they resulted in a compositional
shift in the financing pattern of GFD. Market borrowings financed 33.0 per cent
of GFD as compared with the budgeted level of 65.8 per cent, while the securities
issued against small savings - which represent reinvestment by National Small
Savings Fund (NSSF) out of the proceeds received on redemption of Special Central
Government securities - financed around 24 per cent of the gross fiscal deficit
as compared with one per cent in the BE.
The agreed
limits on the Centre's Ways and Means Advances (WMA) from the Reserve Bank for
the first and second halves of 2004-05 continued to be at Rs.10,000 crore (April-September)
and Rs.6,000 crore (October-March), respectively. As alluded to earlier, the
Central Government maintained surplus cash balances with the Reserve Bank for
the greater part of 2004-05. As a result, the Centre abjured from WMA from September
10, 2004.
State Finances
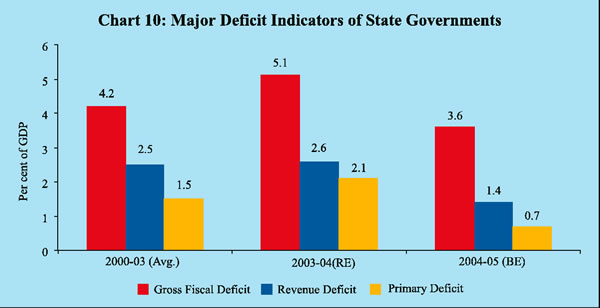
The finances
of the State governments are expected to improve during 2004-05 with all the
major deficit indicators budgeted to decline in 2004-05 from their respective
levels in the revised estimates of the previous year (Chart 10).
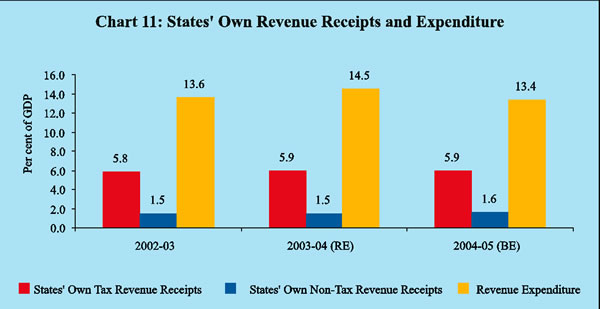
The
envisaged fiscal correction in 2004-05 is expected to be brought about mainly
through improvement in non-tax revenue and a reduction in revenue expenditure.
The States' own tax revenue is, however, estimated to have remained around the
previous year's level (Chart 11).
The decomposition of the
States’ GFD indicates that although the share of the revenue deficit would decline
substantially in 2004-05, it would still be higher than the average for the
first half of the 1990s. Small savings [securities issued to the National Small
Savings Fund (NSSF)] would continue to be the main source of financing the GFD,
followed by market borrowings (Table 9).
|
Table
9: Decomposition and Financing of States’ Gross Fiscal Deficit
|
| |
|
|
|
|
|
|
(Per cent)
|
|
Item
|
1990-95
|
1995-2000
|
2000-02
|
2002-03
|
2003-04
|
2004-05
|
| |
|
(Avg.)
|
(Avg.)
|
(Avg.)
|
|
(RE)
|
(BE)
|
| |
|
|
|
|
|
|
|
|
1
|
|
2
|
3
|
4
|
5
|
6
|
7
|
|
Decomposition (1+2+3)
|
1 0
0
|
1 0
0
|
1 0
0
|
1 0
0
|
1 0
0
|
1 0
0
|
|
1.
|
Revenue Deficit
|
2 4
. 7
|
4 4
. 7
|
6 0
. 7
|
5 4
. 0
|
5 1
. 1
|
3 9
. 1
|
|
2.
|
Capital Outlay
|
5 5
. 3
|
4 3
. 2
|
3 4
. 2
|
3 5
. 8
|
4 3
. 6
|
5 4
. 2
|
|
3.
|
Net Lending
|
2 0
. 0
|
1 2
. 1
|
5 .
1
|
1 0
. 2
|
5 .
3
|
6 .
7
|
|
Financing (1+2+3+4+5)
|
1 0
0
|
1 0
0
|
1 0
0
|
1 0
0
|
1 0
0
|
1 0
0
|
|
1.
|
Small Savings
|
–
|
5 .
8
|
3 6
. 8
|
5 1
. 2
|
4 3
. 4
|
5 7
. 0
|
|
2.
|
Market Borrowings
|
1 6
. 0
|
1 6
. 1
|
1 6
. 0
|
2 7
. 9
|
3 2
. 0
|
2 4
. 6
|
|
3.
|
State Provident Fund
|
1 4
. 3
|
1 3
. 4
|
1 0
. 2
|
7 .
0
|
6 .
8
|
9 .
3
|
|
4.
|
Loans from Centre
|
4 9
. 0
|
4 0
. 6
|
1 3
. 5
|
-0.9
|
-15.2
|
-7.4
|
|
5.
|
Others*
|
2 0
. 7
|
2 4
. 0
|
2 3
. 6
|
1 4
. 8
|
3 3
. 0
|
1 6
. 5
|
| |
|
|
|
|
|
|
|
|
Avg. : Average.
* :Including
reserve funds, deposits, loans from banks and other institutions.
|
The budget
estimates for 2004-05 reveal an endeavour of the State Governments to carry
forward fiscal reforms. A number of States have underscored the need to increase
the magnitude and efficiency of tax revenue mobilisation. The general approach
is to rationalise and simplify the tax structure, broaden the tax base and have
moderate rates of taxation. Most of the State Governments have reiterated the
need to contain unproductive expenditures and reorient spending towards developmental
purposes. Several State Governments have already enacted Fiscal Responsibility
legislation (FRL) and formulated medium-term fiscal plans to bring about an
orderly correction of their financial positions. Some of the remaining State
Governments have also proposed to enact FRL. A number of State Governments have
taken initiatives towards empowering the local bodies based on the recommendations
of the respective State Finance Commissions. The recent implementation of the
Value Added Tax (VAT) by a number of States, with effect from April 1, 2005,
is an important milestone in the area of tax reforms.
Financing of the State Budgets
The net
market borrowings allocated to the States for 2004-05 amounted to Rs.36,935
crore, including additional allocation of Rs.18,805 crore under the Debt Swap
Scheme (DSS). Taking into account repayments of Rs.5,123 crore, the gross allocation
amounted to Rs.42,058 crore. The gross market borrowings raised during 2004-05
by the State Governments amounted to Rs.39,101 crore (Rs.38,216 crore through
tap sale and Rs.885 crore through auctions) including allocation under the DSS.
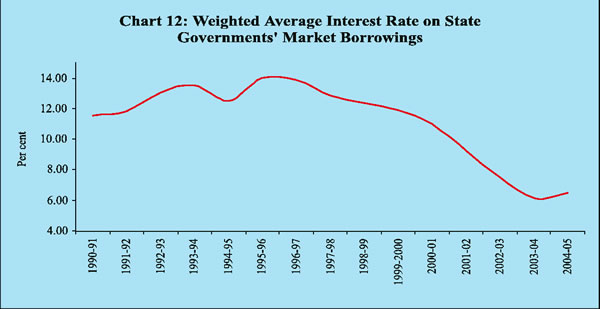
An amount of Rs.16,943 crore was raised under the DSS. Interest rates on States'
market borrowings were in the range of 5.60-7.36 per cent as compared with 5.78-6.40
per cent in 2003-04. The weighted average interest rate on market loans, which
declined between the mid-1990s and 2003-04,firmed up somewhat during 2004-05
(Chart 12).
Weaknesses
in the finances of some State Governments were manifested in the widening of
spreads and under-subscription in respect of their market loans. The spread
between the rate of interest on State market loans and Central market loans
of ten-year maturity in the secondary market widened from 25 basis points in
2000-01 to 50 basis points in the recent period.
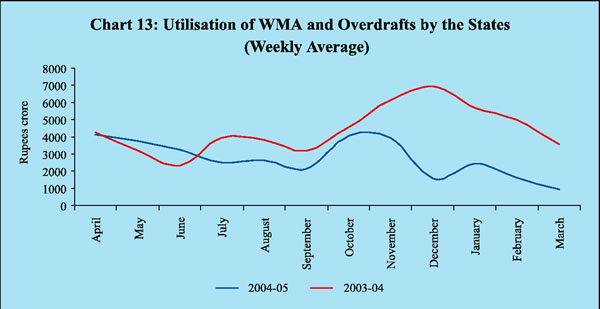
The State Governments' recourse
to WMA and overdrafts was lower during 2004-05 than in the previous year (Chart
13).
Combined Government Finances
The combined
gross fiscal deficit of the Centre and the States for 2004-05 was budgeted at
7.9 per cent of GDP, lower than 9.4 per cent in the RE for 2003-04. Commensurate
reductions were also budgeted for the gross primary deficit and the revenue
deficit which were placed at 1.8 per cent and 3.8 per cent of GDP, respectively,
as compared with RE of 2.9 per cent and 6.2 per cent, respectively, in 2003-04.
Reduction in the various deficit indicators was envisaged to be achieved through
higher revenue mobilisation and moderation in the growth of expenditure.
Financing Patterns
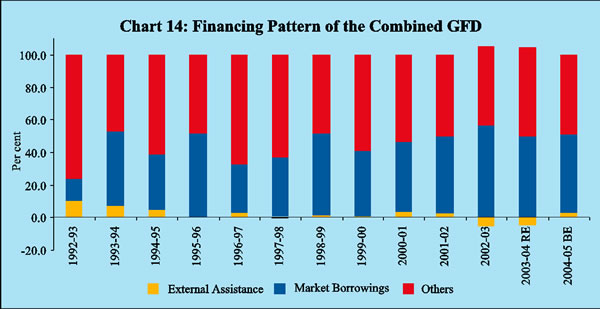
The combined
fiscal deficit of the Centre and the States during 2004-05 is budgeted to be
financed primarily from domestic sources. The share of 'other liabilities' (small
savings, provident funds and deposits) in financing declined from 54.3 per cent
in 2003-04 to 48.8 per cent in 2004-05. The share of financing through market
borrowings also declined from 50.1 per cent to 47.9 per cent over the same period.
External sources financed 3.3 per cent of the combined fiscal deficit during
2004-05, unlike in the preceding two years when there was a net outflow due
to prepayment of external debt (Chart 14).
 Public
Debt Public
Debt
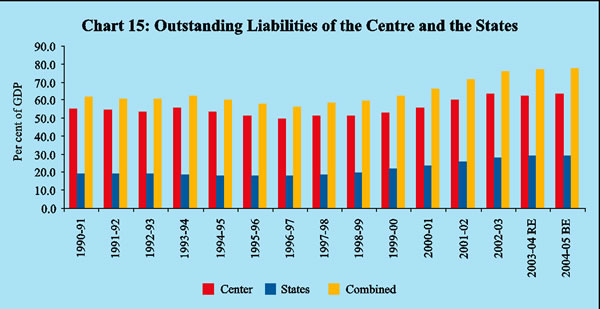
The combined
debt-GDP ratio of the Centre and the States is estimated to have remained broadly
stable at 77.6 per cent in 2004-05 as compared with 77.1 per cent in 2003-04
(Chart 15). The weighted average maturity of dated securities of the Central
Government issued during the year increased from 7.70 years in 1998-99 to 14.94
years in 2003-04. The maturity profile of dated securities issued during 2004-05
reflected the prevailing liquidity conditions and the sentiment of market participants.
Accordingly, the weighted average maturity of the dated securities of the Central
Government issued during the current year at 14.13 years was lower than 14.94
years during 2003-04.
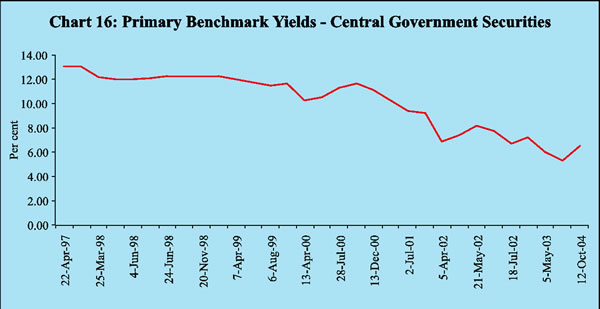
Interest
rates on market borrowings firmed up somewhat during 2004-05, mainly on account
of inflationary expectations. The weighted average yield of the dated securities
issued during the year worked out to 6.11 per cent as compared with 5.71 per
cent in 2003-04, reflecting the firming up of interest rate conditions. The
yield on the benchmark security of 10-year maturity in the primary market hardened
to 6.99 per cent as on October 12, 2004 from 5.32 per cent as on February 16,
2004 (Chart 16).
 The
debt-GDP ratio of the States is estimated to have risen by over seven percentage
points to 29 per cent over the five-year period ending 2004-05. Interest payments
on debt were projected to absorb over 24 per cent of revenue receipts of the
States in 2004-05 as compared with over 25 per cent in the previous year. While
the share of loans from the Centre in the outstanding liabilities of the State
Governments declined over the years, that of loans from NSSF, market loans and
negotiated loans from banks and other institutions have increased.
Outlook
The Government
has committed itself to pursuing fiscal policies designed to promote savings,
to devise ways and means to channel these savings into productive investment
and to fund necessary social expenditures through the Union Budget, 2005-06.
The central theme that runs through the various schemes and programmes is creation
of jobs, strengthening of social infrastructure and providing succour to the
weaker sections of society. The Union Budget seeks to carry forward the process
of fiscal consolidation in coordination with the States through the mechanism
of cooperative fiscal federalism.
The Union
Budget has set a 'pause' in the path outlined in the Fiscal Responsibility and
Budget Management (FRBM) Act 2003 due to constraints emanating from implementation
of the Twelfth Finance Commission's (TWFC) recommendations and the need to compensate
the States for any revenue loss due to implementation of VAT. It is also significant
to note that the disinvestment receipts have been taken out of the budgetary
receipts so as to create a separate fund for the same. Revenue receipts of the
Centre are expected to grow by 16.7 per cent and aggregate expenditure by 8.7
per cent (over the expenditure net of NSSF repayments in 2004-05). The revenue
deficit is budgeted at 2.7 per cent of GDP - the same as in 2004-05 - while
the fiscal deficit is budgeted to decline to 4.3 per cent from 4.5 per cent
in the preceding year. The gross primary deficit to GDP ratio is placed at 0.5
per cent, marginally higher than 0.4 per cent in the previous year (Table 10).
Under revenue
receipts, tax revenue is projected to increase by 21.1 per cent, the major portion
of which is estimated to emanate from corporation tax. Collections from customs
duties are budgeted to decline reflecting the rationalisation of these duties.
Excise duties and income tax are budgeted to register significant increases
during 2005-06. Consequently, the gross tax-GDP ratio of the Central Government
is expected to rise to 10.5 per cent in 2005-06, the highest level after 1989-90.
Non-tax revenue is budgeted to increase by 3.5 per cent mainly on account of
higher receipts from 'dividends and profits'. On the expenditure side, revenue
expenditure is budgeted to register a significantly higher increase of 15.7
per cent mainly due to higher grants to the States on account of the TWFC's
recommendations and compensation to the States for revenue losses that may occur
on implementation of VAT. Higher interest payments reflect the
|
Table
10 : Union Budget 2005-06 at a Glance
|
| |
|
|
|
|
(Amount
in
|
Rs.
Crore)
|
|
Item
|
|
2004-05
(RE)
|
2005-06
(BE)
|
Variation
(per cent)
|
| |
|
|
|
|
(Col.
3 over
|
Col.
2)
|
| |
|
|
|
|
(Amount)
|
(Per
cent)
|
| |
|
|
|
|
|
|
|
1
|
|
|
2
|
3
|
4
|
5
|
|
1.
|
Revenue Receipts (i+ii)
|
3,00,904
|
3,51,200
|
50,296
|
1 6
. 7
|
| |
|
|
(9.7)
|
(10.0)
|
|
|
| |
i)
|
Tax Revenue
|
2,25,804
|
2,73,466
|
47,662
|
2 1
. 1
|
| |
|
|
(7.3)
|
(7.8)
|
|
|
| |
ii)
|
Non-tax Revenue
|
75,100
|
77,734
|
2,634
|
3 .
5
|
| |
|
|
(2.4)
|
(2.2)
|
|
|
|
2.
|
Non-Plan Expenditure
|
3,68,404
|
3,70,847
|
2,443
|
0 .
7
|
| |
|
|
(11.9)
|
(10.6)
|
|
|
| |
of which:
|
|
|
|
|
| |
i )
|
Interest Payments
|
1,25,905
|
1,33,945
|
8,040
|
6 .
4
|
| |
|
|
(4.1)
|
(3.8)
|
|
|
| |
ii)
|
Defence
|
77,000
|
83,000
|
6,000
|
7 .
8
|
| |
|
|
(2.5)
|
(2.4)
|
|
|
| |
iii)
|
Subsidies
|
46,514
|
47,432
|
918
|
2 .
0
|
| |
|
|
(1.5)
|
(1.3)
|
|
|
|
3.
|
Plan Expenditure
|
1,37,387
|
1,43,497
|
6,110
|
4 .
4
|
| |
|
|
(4.4)
|
(4.1)
|
|
|
|
4.
|
Revenue Expenditure
|
3,86,069
|
4,46,512
|
60,443
|
1 5
. 7
|
| |
|
|
(12.4)
|
(12.7)
|
|
|
|
5.
|
Capital Expenditure
|
1,19,722
|
67,832
|
-51,890
|
-43.3
|
| |
|
|
(3.9)
|
(1.9)
|
|
|
|
6.
|
Revenue Deficit
|
85,165
|
95,312
|
10,147
|
1 1
. 9
|
| |
|
|
(2.7)
|
(2.7)
|
|
|
|
7.
|
Gross Fiscal Deficit
|
1,39,231
|
1,51,144
|
11,913
|
8 .
6
|
| |
|
|
(4.5)
|
(4.3)
|
|
|
|
8.
|
Gross Primary Deficit
|
13,326
|
17,199
|
3,873
|
2 9
. 1
|
| |
|
|
(0.4)
|
(0.5)
|
|
|
| |
|
|
|
|
|
|
|
BE: Budget Estimates.
RE: Revised Estimates.
Note :Figures in parentheses are proportions to GDP in percent.
|
continuing
dependence on debt resources and the interest outgo on account of the Market
Stabilisation Scheme. Capital expenditure is budgeted to decline by 43.3 per
cent in 2005-06, reflecting mainly the absence of NSSF repayments and Plan loans
to the States in pursuance of the recommendations of the TWFC. Adjusted for
these components, capital expenditure is budgeted to show an increase of 9.2
per cent.
During 2005-06,
net market borrowings are budgeted to be higher at Rs.1,03,791 crore as against
Rs.45,943 crore in the RE for 2004-05 . Inclusive of repayments to the tune
of Rs.61,676 crore, the gross market borrowings are placed at Rs.1,65,467 crore.
Net market borrowings would finance 68.7 per cent of the GFD in 2005-06 as compared
with 33.0 per cent in the revised estimates for 2004-05. The securities issued
against small savings would finance 2.0 per cent of the GFD as against 24.4
per cent in 2004-05, reflecting the discontinuance of the DSS and associated
NSSF repayments. The fiscal measures initiated in the Union Budget would augment
revenue, promote efficient utilisation of expenditure and pave the way for sustained
economic development.
|