| Kaushik Bhattacharya and Abhiman
Das* The
paper examines the nature and the extent of changes in the market concentration
in the Indian banking sector and their possible implications on prices and output
of banking services. The first part of the paper attempts to measure market concentration
in banking in India in alternative ways from 1989-90 to 2000-01. In contrast to
earlier empirical applications on banking, it focuses on both static and dynamic
measures of market concentration. The paper finds a strong evidence of change
in the market structure in banking in India. Interestingly, results reveal that
a major part of the change in market structure occurred during the early 1990s.
Despite a spate of mergers during the late 1990s, market concentration was not
significantly affected. It is also observed that the different concentration ratios
rank the changes similarly over time. The
second part of the paper analyses the possible impact of changes in banking market
structure on prices and output of this sector during the same period. It is demonstrated
that measurement problem of real output pertaining to banking sector in the national
income data could be severe. The implied inflation as obtained through the GDP
deflator for the banking sector in India led to unbelievable measures of inflation
for banking services, casting some doubt on the methodology adopted. Alternatively,
proxy price measures based on the spread appear to be more consistent with the
changes in market structure in India during the late 1990s. The paper argues that
the favourable market structure in India could be one important factor that led
to a reduction in the ‘prices’ of banking services after the administered interest
regime was lifted. JEL Classification
: D40, G21, L11, L89 Key Words : Concentration,
Competition, Banking *
The authors are working as Assistant Advisers in the Monetary Policy Department
and Department of Statistical Analysis and Computer Services, respectively. The
authors wish to express their sincere thanks to Prof. Esfandiar Maasoumi, Department
of Economics, Southern Methodist University, Dallas, Texas, and Prof. Mark Flannery,
University of Florida, Department of Finance, Gainesville, for their insightful
comments, which led to substantial improvement of the exposition of an earlier
draft. The views expressed in this paper are the authors’ own. The authors bear
full responsibility for any errors that remain. Introduction The
role of competition in ushering economic efficiency has been extensively examined
in the literature. In
view of globalisation and renewed interest in shaping appropriate competition
policies in many countries, the issue has once again become germane (Neumann,
2001). A major requirement for enhancing competition in an economy is the removal
or minimisation of entry barriers. An important source of removing them is to
ensure the availability of cheap finances, which inter alia, is easier
to meet in the presence of a thriving and competitive banking sector. Theoretical
results demonstrate that monopolistic market power of banks raises the opportunity
costs of capital and thus, tends to make financing more expensive (Smith, 1998).
Lack of adequate competition in banking could thus, adversely affect economic
development. To analyse
competitiveness in any sector, an in-depth analysis of the structure of the market
is essential. While highly concentrated markets do not necessarily imply lack
of competitive behaviour, it is generally agreed that market concentration is
one of the most important determinants of competitiveness (Nathan and Neavel,
1989). For banking sector, the relationship between market concentration and competitiveness
has been examined in detail for many countries and the results indicated that
a high concentration tends to reduce competitiveness in this sector (Gilbert,
1984). Most of the empirical evidences in the literature are, however, based on
developed economies. The financial structures in many developing countries being
sharply different from the developed ones, it is necessary to examine to what
extent the established empirical findings in the developed economies apply to
these countries, especially in an environment where financial structures are undergoing
rapid and swift changes. This paper
examines the nature and the extent of changes in the structure of banking in India
during the 1990s and analyses the possible impact of these changes on prices and
output of banking services during the same period. The concepts of price and real
output in the banking sector being fuzzy, an analytical discussion on these aspects
has also been attempted. Currently, a detailed examination of these issues is
relevant because the economic reforms in India during the 1990s ushered in phenomenal
changes in the Indian banking sector. The new regime, in sharp contrast to the
earlier regime that thrived on banking through public sector, is perceived as
more accommodative towards competition. A fundamental change in this context during
the second half of the 1990s had been the liberalisation of the earlier administered
interest rate regime. Besides that, other significant policy measures included
reduction in reserve ratio, relaxation of quantitative restrictions assets/liability
composition and removal of some of the major barriers to entry into the financial
system. The new policy framework also entailed considerable institutional reforms,
including new laws and regulations governing the financial sector, the restructuring
and privatisation of banks, and the adoption of indirect instruments of monetary
policy. In the current regime, banks enjoy almost full freedom in pricing their
products. Furthermore, a spate of new entries of private Indian and foreign banks
and mergers among some of the existing players during the second half of the 1990s
is expected to usher in significant changes in the structure of the banking sector
in India. The changes in the market
structure of firms could be examined through alternative measures. Recent survey
of Bikker and Haaf (2001a) lists 10 such measures proposed and used in the literature.
Among these, the more popularly used ones are k-Bank Concentration Ratios
and Herfindahl-Hirschman Index (HHI). The Lorenz Ratio (Gini Coefficient), a popular
measure in the literature on income inequality, is also used to measure industrial
concentration. In India, some of these measures have been used by the official
agencies to address similar problems.1 It may, however, be noted that
the scope of these popular measures is somewhat limited. For example, the HHI
and the Gini coefficient are based on the variance of market shares. So far as
market concentration is concerned, policy makers are in most cases not interested
in the variance per se, but at the tails of the distribution of market
shares. Although some of the measures listed by Bikker and Haaf (2001a) attempt
to address these problems, all of them ignore the inherent dynamics associated
in this process. To analyse competitiveness in an industry, specification of a
full dynamic framework is necessary to gain sufficient hold on the market in the
long run, while firms may initiate price wars, resulting in apparently misleading
changes in the short-run concentration profiles. Although the dynamic aspects
of concentration have been addressed in the literature, earlier studies focussed
primarily on a descriptive analysis of the changes in indices of concentration
from year to year in specific industries and related it to 'competitiveness' measured
in alternative ways. Recent advances
in the literature have, however, explicitly focussed on the dynamic aspects of
concentration measures. Borrowing concepts from the related literature on income
mobility, Maasoumi and Slottje (2002) have classified measures of industrial concentration
based on generalised entropies, obtained asymptotic distributions for these measures
and applied them on the US steel industries. Empirical results reveal that the
incorporation of the dynamic aspects could lead to changes in inferences drawn
from more traditional static measures. As this development is a nascent one, the
empirical relevance of these developments in the banking sector is yet to be examined. So
far as banking sector is concerned, our study is different from the earlier studies
in two respects. First, we examine the changes in concentration in the banking
sector in India in both static and dynamic framework and compare them empirically.
While the static framework employs standard measures of concentration, in the
dynamic frameworks, we measure these changes through generalised entropy measures
as developed by Maasoumi (1986) and Maasoumi and Zandvakili (1990). Wherever possible,
results are compared to those obtained for other countries. Second, while examining
the implications of changes in the concentration profiles on competitiveness and
on the prices and output of the banking sector, we demonstrate that standard measures
of prices and output as per the national accounts statistics could provide a distorted
picture. We argue that alternative proxies of ‘price’ based on the spread between
the lending and the deposit rates appear to be more consistent with the changes
in the concentration profiles of banks in India during this period. The
plan of the paper is as follows: Section I presents a brief review of literature
on measuring concentration, with special reference to dynamic measures of concentration.
Section II describes the empirical evidence on changes in the structure of banking
sector in India. Section III attempts to analyse the possible impact of these
changes on prices and quantities of the financial intermediation services. Finally,
Section IV concludes the paper with some critical comments, focussing on policy
aspects. Section
I A Brief Review of Literature So far as measur ement
of market concentration is concerned, many of the existing results on income inequality
could be readily translated. Drawing analogies from the literature on income inequality,
the ‘inequality’ in the share of sales (or output or share of industry employees)
of individual firms in an industry has been specified as appropriate empirical
measure of market concentration. These measures have been estimated and related
them to competitiveness measured in alternative ways. In
the income inequality literature, inequality has also been examined in a dynamic
framework. These mobility studies have been compared to videotapes on inequality
as against a spot picture provided by the static measures. Recently, attempts
have been made to translate the framework to measure market concentration. Accordingly,
Subsection I.1 reviews the static measures of concentration and Subsection I.2
does that for the dynamic measures. I.1 Static Measures of Concentration In
the static inequality literature, different inequality measures do not necessarily
imply the same ordering of distributions. Either explicitly or implicitly, almost
all these measures or orderings are based on a weighted average of the income
(or, wealth) vector of individuals (or, households). The disagreement occurs in
the specification of the weights. The disagreement is irrelevant, if there are
‘good’ reasons to demonstrate the superiority of one measure over others. The
‘good’ reasons could be specified in alternative ways. One way is to identify
a few desirable properties that a measure on inequality should satisfy. Some of
these properties are symmetry, continuity, invariance to scalar multiplication,
additive decomposability and satisfaction of transfer principle (Shorrocks, 1984).
Another way is to derive an inequality measure or an ordering from a social welfare
function (SWF). The SWF is specified as a function of the income (or, wealth)
vector of all individuals (or, households). Thus, different income distributions
can be ordered based on the SWF pertaining to them. This approach often involves
specifying an axiomatic structure that such a SWF should satisfy. Subsequent task
involves characterising indices or orderings that would satisfy such axioms. Like
indices of inequality, different indices of concentration put different weights
over different parts of the distribution of market shares across firms and may
give contradictory evidence. Let there be n firms in an industry with market
shares s1, s2, …, sn. A simple but general linear form of
an index of industrial concentration (IIC ) is:
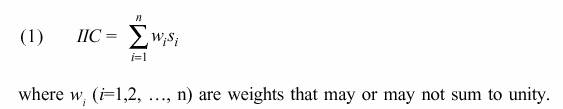
Following the taxonomy
of Marfels (1971), there could be four broad classes of weighing schemes: (i)
unity to top k firms and zero to the rest, (ii) individual ranks of firms,
(iii) firms’ own market shares or their power, and (iv) the negative of the logarithm
of market shares. The weighing scheme reflects different
assessment regarding the relative impact of larger and smaller firms. Depending
upon the weighing scheme, the individual measures may vary, but they may lead
to similar orderings.2 As in the inequality
literature, there are two ways to deal with the problem of lack of robustness
with respect to weights. One way is to report 'complete rankings’’ through a class
of concentration measures that reflect the sensitivity to concentration in all
parts of the share distribution. Another approach is to consider 'partial but
uniform’’ orderings that evaluate concentration over a restricted part, but over
a larger class of evaluative functions. Whatever be the strategy, Maasoumi and
Slottje (2002) argue that for transparency’s sake, it is imperative for the policymakers
and analysts to declare the 'weights’’ they attach to a reduction in concentration
over various parts of a distribution. The most common measure
used in the literature on market concentration has been a simple concentration
index, aggregating such shares of a few top firms (say, k). These measures
for banking firms are called k-Bank Concentration Ratios. There is no rule
for choosing an appropriate value of k. So, the number of firms included
in the concentration index is an ad hoc and an arbitrary decision. The
index ranges from zero to unity. The index approaches zero for an infinite number
of equally sized banks and it equals unity, if the firms included in the calculation
of the concentration ratio make up the entire industry. Another popularly
used measure is the Hirfendahl-Hirschman index (HHI)3 . For
n firms in an industry with market shares si ,(i=1,2,
... , n), the HHI is defined as: 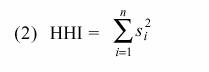
HHI can be written as an increasing
function of the population variance of market shares. The more 'equal' the firm’s
size is, the smaller is the HHI. HHI also satisfies the well known 'transfers’’
property. By definition (1/n) <1, where n is the number of
firms in an industry. The maximum concentration of unity occurs when one firm
has all the sales, output, etc. Minimum of concentration (1/n) occurs
when each firm has an equal share of 1/n. Despite
its popularity, HHI suffers from a few limitations. A major limitation is that
distributions of market shares with radically different tail properties may have
HHI of similar magnitude (Rhoades, 1995). Recently, Maasoumi and Slottje (2002)
have argued that common economic phenomena like mergers between a strong and a
weak firm or entries and exits only change certain parts of the distribution of
market share – often the tails only. Indices based solely on 'dispersion’’ or
variance, (e.g., HHI, Gini, etc.) may miss such changes. Another popular
measure that shares most of the properties of HHI is the Gini ratio. The Gini
ratio, in a continuous variable framework, is defined as: 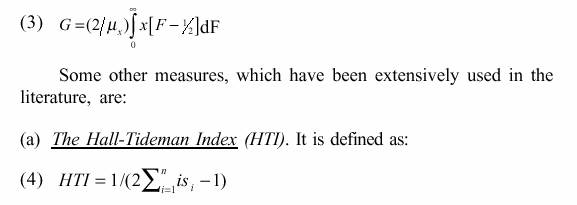
where
the market share of each bank is weighted by its ranking in order to ensure that
the emphasis is on the absolute number of banks, and that the largest bank receives
weight i=l. This index includes the number of banks in the calculation
of a concentration index, because it reflects to some extent the conditions of
entry into a particular industry. (b) The Rosenbluth Index (RI) is
defined as: (5) RI=1/(n(1-G)), where G is the Gini-coefficient. (c)
The Comprehensive Industrial Concentration Index (CCI) is defined as :

It
is the sum of the proportional share of the leading bank and the summation of
the squares of the proportional sizes of each bank, weighted by a multiplier,
reflecting the proportional size of the rest of the industry.
(d) The Hannah and Kay Index (HKI) is defined as :
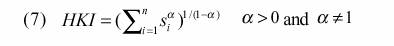
where
a is an elasticity parameter to be specified and intended to reflect their
ideas about changes in concentration as a result of the entry or exit of banks,
and the sales transfer among the different banks in the market. The freedom to
choose a allows for alternative views on: what is the appropriate weighting
scheme and for the option to emphasise either the upper or the lower segment of
the bank size distribution. Therefore, in addition to the distribution of the
banks in the market, the value of the index is sensitive to the parameter a.
For ????0 , the index approaches the number of banks in the industry,
and for ?????, it converges towards the reciprocal of the market
share of the largest bank. (e) The
Hause Indices i) The multiplicatively modified Hause Index takes
the form: 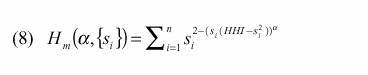
where
HHI is the Herfindahl-Hirschman Index and a is the parameter capturing
the degree of collusion. ii) Hause furthermore
proposes the additively adjusted measure of concentration, which is defined as: 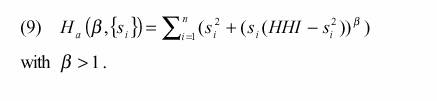
(f)
Entropy Measure The
Entropy measure has its theoretical foundations in information theory and measures
the ex-ante expected information content of a distribution. It takes the
form: 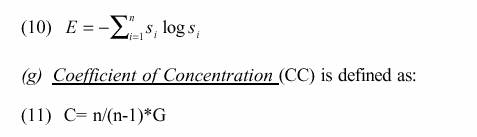
Indices
(a) to (g) are discussed in detail in Bikker and Haaf (2001a). It
may be noted that some of the indices are based on higher moments of market shares.
For example, the Comprehensive Concentration Index (CCI) could be associated with
the third moment of market shares. In some cases, they are functions of market
shares as well as the HHI. Some of the measures, in fact, represent broad classes.
The values of a specific measure within that class will depend on specific values
of certain parameters. In an empirical exercise, the choices of the values of
these parameters are often not clear. Researchers typically specify a set of 'plausible'
values of these parameters and examine the robustness of the obtained results.
Availability of so many indices implies that in any specific exercise, it is
important to specify the underlying axiomatic structure under which the corresponding
index becomes the 'best' index. In their various incarnations, axiomatic structures
identify the generalised entropy (GE) as an 'ideal' family of indices. For a weighted
random vector X=(X1,…,Xn)' with weights w=(w1,…,wn)' the GE concentration
measure is defined as: 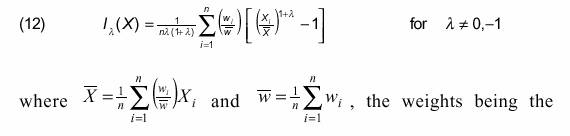
reciprocal
inclusion probabilities. This family includes HHI, variance of logarithms, square
of the coefficient of variation, and for l=0, -1, this index converges
to the first and second Theil measures of information 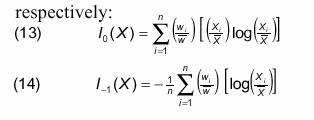
It
has been shown that Theil's second measure (l = -1) provides the most unambiguous
answer to such fundamental questions as: How much of the overall concentration
is due to the concentration within the rt h group? The groups could
be with respect to type of product, technology, location, or the size itself.
These two measures in (13) and (14) were further studied by Maasoumi and Theil
(1979) with a view to determine their characteristics in terms of the moments
of distributions. Let: 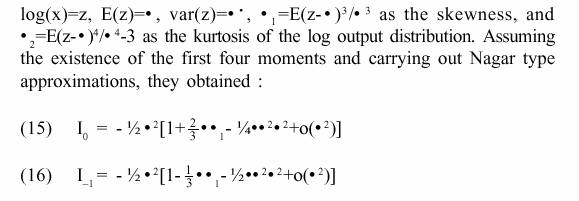
When
z has a lognormal distribution, both indices equal - (1/2)s2.
HHI can be shown to be a simple function of s2, but not of the
higher moments. Thus, it can fail with departures from lognormality. The above
approximate formulae can be used when the underlying distribution is not known.
They allow us to see that positive skewness and leptokurtosis increase concentration,
and that is more sensitive to positive skewness I 0(high sales/output
groups) and fat tails (large extreme sales groups) than I-1 .
As these entropy measures appear more general and relatively
easy to implement, their use in the context of measuring market concentration
has often been suggested. This is because entropy is shown as a much richer function
of all the moments of a distribution, and more closely identifies it than any
single moment such as variance or HHI. I.2 Dynamic Measures of Concentration The
dynamic measures of concentration emerge from the realisation that it is misleading
to consider states of a market at only single points in time. Transitory conditions
may mislead and become difficult to disentangle when looking at several periods/situations.
It is thus, desirable to consider market concentration over several periods, and
to develop a dynamic concentration profile, following the concepts of mobility
as in Maasoumi and Zandvakili (1990). Let denote sales/output of firm i,
(i=1,…,N), in period t=1,…,T.XitWe denote the vector
,....Xt =(X1t ,X2t ,XNt)¢. Let Si=Si (Xi1,…, XiT)
be the ‘permanent’ or 'aggregate’’ sales of firm i over T periods.
Of course, one can define the aggregates over periods 1 to T¢£
T, say, and develop a mobility profile as T¢ approaches T.
Then(17)S =(S1,…, Sn)¢is the vector of
aggregate sales for a chosen time frame. Following Maasoumi (1986), the following
type of aggregation functions are justified on the basis that they minimize the
generalized entropy distance between S and all of the T 'sales’’ distributions:
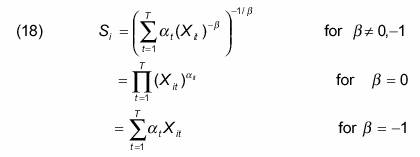
where at
is the weight attached to sales in period t, Sa t=1. The elasticity
of substitution of sales/output across time is constant at a=1/ (1+b).
The case b = –1 corresponds to perfect inter-temporal substitution, which
subsumes Shorrocks’ analysis for certain weights. This case is also the most common
formulation of the 'permanent income’’ concept in economics. In this context,
we can think of the concept as 'permanent output’’, or 'expected sales’’. Mobility
is measured as the ratio of 'long run’’ concentration occurring when the period
of examination is extended, and a measure of short run concentration. The latter
may be represented by any one period of interest, or a weighted average of the
single period concentrations. We might think of this as a notion of 'competition
enhancing’’ mobility, a welfare theoretic base in favour of large, non-concentrated
markets.4 The extension of the time interval is meant to reflect the
dynamics and smooth out the transitory or business cycle effects in the industry.
Shorrocks (1978) proposed the following mobility measures: 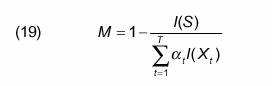
where
I() is the 'inequality’’ measure. For convex inequality measures I(), 0£M£1
is easily verified when S is the linear 'permanent output’’ function. For
other aggregator functions see Maasoumi and Zandvakili (1990). A priori,
there would be no reason for an analyst to give unequal weights to different years
under study. Nevertheless, Shorrocks (1978) suggests the ratio of year t
income to total income over the T periods as suitable values for at
s. We consider both weighting schemes here.5
Section II Empirical Analysis Compared
to many other developing countries, India has an extensive banking network. Before
an empirical analysis, a brief discussion on the taxonomy and the historical development
of the structure of the Indian banking market would be essential.6
Accordingly, Subsection II.1 presents such a review in brief. Subsections II.2
and II.3 present results based on static and dynamic measures, respectively. II.1
Taxonomy and Historical Development The scheduled banking
structure in India consists of banks that are included in the Second Schedule
of the Reserve Bank of India Act, 1934. These scheduled banks are divided in two
groups, viz., scheduled commercial banks and scheduled co-operative banks. This
study is restricted to scheduled commercial banks that account for more than 90
per cent of banking business in India. For analytical purposes, the scheduled
commercial banks could be further classified into four groups, viz., public
sector banks, Indian private sector banks, regional rural banks and foreign banks.
Among the public sector banks, official reports generally indicate results separately
for State Bank of India (SBI) and its Associates and Other Nationalized Banks,
due to the large size of the former. So far as banking is
concerned, the year 1969 marked a watershed, during which fourteen major banks
in India were nationalised. At that time, there were 73 scheduled commercial banks
in India, of which 15 were foreign banks. Due to strong emphasis on increasing
the savings rate of the economy, the 1970s and 1980s experienced phenomenal growth
in the banking network that spanned the entire country. As a result, though the
absolute number of scheduled commercial banks (other than regional rural banks)
did not increase much (78 as at end-March 1990, of which 22 were foreign banks),
the number of bank branches increased from 8,262 in 1969 to 59,752 as at end-March
1990, resulting in a very high annual compound growth rate of 18.8 per cent in
deposit mobilisation, from Rs.4,646 crore as at end-March 1969 to Rs.1,73,515
crore as at end-March 1990. The Indian Government has historically undertaken
a number of extensive and elaborate policy initiatives to extend the outreach
of formal credit systems to the rural population. One of the major initiatives
taken was the establishment of Regional Rural Banks (RRBs) in 1975. These policy
initiatives during 1970-90 had a far-reaching impact on the functional reach and
geographical spread of banking in India. However, this period is also characterised
by widespread control, limiting the scope of competition. Interest rates were
strictly administered and had multiple layers. On the lending side, the focus
was on priority sectors. The banking market during this period was also highly
segmented. Following the balance of payments crisis in India
during the early 1990s, the earlier regime experienced a radical change. A major
change was to shift away from the earlier administered rates towards market determined
ones. On the lending side, the deregulation began in 1994 with emphasis on the
development of money, Government securities and foreign exchange markets. The
conduct of monetary policy also slowly moved away from the use of direct instruments
of monetary control to indirect measures such as open market operations. Banks
were given freedom to set their Prime Lending Rates and to devise their own lending
policies. On the liabilities side, the entire gamut of deposit rates – except
on savings deposits – were deregulated, and the banks were given freedom to offer
different interest rates for different maturities/ size-groups. Interest rates
on Government securities were made market-determined. The refinance facility of
Reserve Bank of India (RBI) was also rationalised and sector specific refinance
facilities were de-emphasised. During 1997, another overriding development with
far reaching implications was, however, the reactivation of the Bank Rate, which
was linked to other interest rates including the Reserve Bank’s refinance rate.
During this period, banks were also permitted to rationalise their existing branch
network viz., to shift their existing branches within the same locality,
open certain type of specialised branches, convert the existing non-viable rural
branches into satellite offices, etc. Table 1 presents
the movement of select banking indicators during last two decades. It is observed
that the decade 1992-02 is marked with significant increase in the banking business
by Indian private banks. While the deposits of Indian public sector banks grew
at an annual compound growth rate of around 15.55 per cent during 1992-02, the
same for Indian private banks grew at an annual compound growth for around 28.57
per cent. In the case of bank credit also, a similar pattern is observed.
|
Table 1: Movement of Select Banking
Indicators during 1982-92 to 1992-02 |
| Bank-groups |
Growth in number |
Compound growth |
Compound growth |
| |
of branches |
of deposits |
of bank credit | | |
1982-92 |
1992-02 |
1982-92 |
1992-02 |
1982-92 |
1992-02 |
| State Bank of India & its |
| | | |
| | |
Associates | 26.54 |
7.69 |
16.18 |
15.48 |
14.64 |
15.32 | |
Nationalised Banks |
32.64 |
3.41 |
15.15 |
15.59 |
13.81 |
15.23 | |
Regional Rural Banks |
60.09 |
-1.82 |
27.46 |
23.07 |
21.64 |
16.52 | |
Indian Private Banks |
-5.87 |
23.67 |
15.57 |
28.57 |
17.85 |
28.23 | |
Foreign Banks |
12.58 |
17.93 |
25.91 |
13.46 |
21.53 |
19.29 | |
Total | 35.33 |
4.80 |
16.12 |
16.75 |
14.83 |
17.00 |
The liberalisation measures adopted
during the beginning of the study period, attempted to reduce entry barriers by
discarding the earlier licence-permit regime. As a consequence, there were a number
of new entrants in the banking business during this period. Table 2 lists the
new arrivals of banks in India between 1989-90 and 2000-01 chronologically. It
is interesting to note that during the first few years, there were no new arrivals.
The early 1990s was the period of consolidation after the economic debacle following
the balance of payments crisis experienced by India during the year 1990-91. The
arrivals started during early 1994 after the crisis was effectively tackled and
in consequence, the pace of liberalisation in the Indian financial sector accelerated.
Table 2 reveals the arrival of 33 new banks during this period, among which 24
are of foreign origin. It is also interesting to note that the arrival of the
foreign banks accelerated during the later period.
| Table
2: Entry of New Banks during 1990-2001 | |
| | | |
| | |
BankName | Dateof |
Ownership |
BankName | Dateof |
Ownership | |
| Opening |
Category | |
Opening |
Category | |
Barclays Bank | 8/10/90 |
Foreign Bank |
Bank of Ceylon | 30/10/95 |
Foreign Bank | |
Sanwa Bank |
20/12/90 | Foreign
Bank | Commerz Bank |
1/12/95 |
Foreign Bank | |
UTIBank | 28/02/94 |
IndianPrivate |
Siam Commercial | 14/12/95 |
Foreign Bank | |
| | Bank |
Bank | |
| | IndusIndBank |
2/04/94 |
IndianPrivate | Bank
International | 6/04/96 |
Foreign Bank | |
| | Bank |
Indonesia | |
| | ICICI Bank |
17/05/94 |
IndianPrivate | Arab
Bangladesh | 6/04/96 |
Foreign Bank | |
| | Bank |
Bank | |
| | INGBank |
1/06/94 |
Foreign Bank | Chinatrust |
8/04/96 |
Foreign Bank | | |
| | Commercial
Bank | | | |
Global Trust Bank |
6/09/94 | IndianPrivate |
Cho Hung Bank |
6/05/96 | Foreign
Bank | | | |
Bank | |
| | |
Chase Manhattan Bank |
21/09/94 | Foreign
Bank | Fuji Bank |
20/05/96 |
Foreign Bank | |
State Bank of Mauritius |
1/11/94 | Foreign
Bank | Krung Thai Bank |
6/01/97 |
Foreign Bank | |
HDFC Bank | 5/01/95 |
IndianPrivate |
Overseas Chinese | 31/01/97 |
Foreign Bank | |
| | Bank |
Bank | |
| | Centurion Bank |
13/01/95 |
IndianPrivate | Commercial
Bank | 12/03/97 |
Foreign Bank | |
| | Bank |
of Korea | |
| | DBS Bank |
15/03/95 |
Foreign Bank | Sumitomo
Bank | 20/06/97 |
Foreign Bank | |
Bank of Punjab |
5/04/95 | IndianPrivate |
Hanil Bank |
5/07/97 | Foreign
Bank | | | |
Bank | |
| | |
TimesBank | 8/06/95 |
IndianPrivate |
Toronto-Dominion | 25/10/97 |
Foreign Bank | |
| | Bank |
Bank | |
| | Dresdner Bank |
21/08/95 |
Foreign Bank | Bank
Muscat | 9/09/98 |
Foreign Bank | |
| | |
International | | |
| IDBI Bank |
28/09/95 |
IndianPrivate | Morgan
Guaranty | 24/12/98 |
Foreign Bank | |
| | Bank |
Trust K. B. C. Bank |
15/02/99 |
Foreign Bank |
The
new environment in banking demanded restructuring and reorienting the policy goals
of banks. One way to adapt to the new environment was through mergers. It may
be noted that though bank mergers were common phenomenon in many developed and
developing countries, they were comparatively new in India during the 1990s.7
Table 3 presents the list of mergers and acquisitions among the banks. It lists
18 such mergers. Once again, it may be noted that 10 of the mergers and restructuring
took place during the second half of the 1990s. To understand the nature of these
mergers in detail, the type of merger has also been indicated in Table 3. Most
of the mergers took place either between two private sector banks or two public
sector banks. Among the public sector banks, generally a 'weak' bank had been
merged with a 'strong' bank. Thus, if one considers public sector or private sector
as a group, the effect of merger on bank performance may not be very significant.
In one or two cases, it is observed that a non-banking
financial company had been merged with a bank.
| Table
3 : Mergers and Acquisitions of Banks: 1985-2002 | |
Name of the merging entity |
No. of |
Name of the merged entity |
Date/Year of | | |
Branches | |
merger | |
| | | |
| United Industrial Bank |
145 |
Allahabad Bank | 31/10/89 |
| Bank of Tamil Nadu |
99 |
Indian Overseas Bank |
20/02/90 | |
Bank of Thanjavur | 156 |
Indian Bank |
20/02/90 | |
Parur Central Bank |
51 | Bank of India |
20/02/90 | |
Purbachal Bank |
40 | Central Bank
of India | 29/08/90 |
| Bank of Karad |
48 |
Bank of India | 2/05/92 |
| New Bank of India |
591 |
Punjab National Bank |
1993 | | BCCI
(Mumbai) | 1 |
State Bank of India |
1993 | |
Kashinath Seth Bank |
11 | State Bank of
India | 1/01/96 |
| Bari Doab Bank |
10 |
Oriental Bank of Commerce |
8/04/97 | |
Punjab Co-operative Bank |
9 | Oriental Bank
of Commerce | 8/04/97 |
| 20th Century Finance |
| Centurion Bank |
1/01/98 | |
Bareilly Corporation Bank |
65 |
Bank of Baroda | 3/06/99 |
| Sikkim Bank |
7 |
Union Bank of India |
22/12/99 | |
Times Bank | 10 |
HDFC Bank |
26/02/00 | |
Bank of Madura | 270 |
ICICI Bank |
10/03/01 | |
Sakura Bank | 2 |
Sumitomo Bank |
1/04/01 | |
Morgan Gurantee Trust |
1 | Chase Manhattan
Bank | 10/11/01 |
II.2 Changes in the Market Structure
in Indian Banking: Static Measures The evidences in
Tables 1–3 reflect the changes in the structure of Indian banking. We now attempt
to examine these changes in detail by measuring the changes in different concentration
indices over the years. We estimated the measures of concentration at industry
as well as at bank-group level with respect to total assets, total deposits and
total income. However, for the sake of brevity, we have presented the values at
industry level based on total assets.8 From an
analytical point of view, before discussing the trends of the various concentration
measures in the post-reform period, we present a brief statistical profile of
various concentration measures (Table 4).9 The first impression demonstrates
the diverging results yielded by the various concentration measures when applied
to the same underlying market. Even a short glance reveals the wide spread in
these values. The results show clearly that not only does the range of possible
values differ strongly across the indices, but so do the values of the indices
within this range. For instance, the value is high for the CRk
and low for the HHI and Rosenbluth index. Table
5 presents the trends in various concentration measures during 1989-90 to 2000-01.
Note that as these figures are population figures (scheduled co-operative banks
are excluded, we interpret scheduled commercial banks as the ‘population’), computations
of standard errors are not necessary. In general, concentration indices, as presented
in Table 5, appear to be inversely related to the number of banks. This is owing
to the well-known weakness of concentration indices, namely, their dependency
on the size of the banking market. The value of the k-bank concentration
ratios (for various values of k) always exceeds the value of HHI, since
the latter gives less prominence to the markets shares (the weights again being
market shares) than the former (unit weights). Irrespective of the choice of the
concentration index, measures of concentration have declined in
| Table
4: Average Measures of Concentration: 1989-90 to 2000-01 |
| | | |
| | | |
| | | |
Index |
Range | |
| Parameters |
Typical features |
Avg. |
Std. | CV |
| type |
| | | |
| | Value |
Dev. | |
| GINI |
| | | |
| | 0.736 |
0.012 |
1.631 | | | |
| | | |
Takes only large banks |
0.250 |
0.020 | 7.931 |
| CR1 |
| | | |
| | | |
| | |
0 < | |
1 | | |
into account; |
0.311 | 0.025 |
8.160 | |
CR2 |
CR |
k£ |
| | | |
| | | |
| | | |
| | arbitrary
cut off | 0.472 |
0.032 |
6.690 | | CR5 |
| | | |
| | | |
| | | |
| | | |
| 0.628 |
0.044 |
6.940 | | CR10 |
| | | |
| | | |
| | HHI |
1/n £ HHI |
£ |
1 | |
Considers all banks; sensitive |
0.085 | 0.012 |
13.835 | | |
| | | |
| to entrance of new banks |
| | | |
HTI |
0 < HTI |
£ | 1 |
| Emphasis on absolute |
0.050 |
0.005 | 9.805 |
| | | |
| | |
number of banks | | |
| | Rosen- |
0 < RI |
£ | 1 |
| | Sensitive
to changes in | 0.044 |
0.007 |
15.753 | |
bluth | | |
| | |
the size distribution of | |
| | | |
| | | |
| small banks |
| | | |
CCI |
0 < CCI £ |
1 | |
| Addresses relative dispersion |
0.293 |
0.023 | 7.810 |
| | | |
| | |
and absolute magnitude; | |
| | | |
| | | |
| suitable for cartel markets |
| | | |
CI | |
| | | |
| 0.745 |
0.013 |
1.700 | |
HKI | HKI£ |
n | a
= 0.005 | Stresses influence
small banks | 86.880 |
11.292 |
12.998 | | |
(1/s 1)
£ | | |
| | | |
| | | |
| | | |
a
= 0.25 | |
62.355 | 8.264 |
13.253 | | |
| | | |
a
= 5 | |
5.686 | 0.542 |
9.529 | | |
| | | |
a
= 10 | Stresses influence
large banks | 4.688 |
0.399 |
8.501 | |
Hause | 0 < |
£ |
1 | | a
= 0.25 | Suitable for
highly collusive | 0.138 |
0.019 |
13.481 | | |
Hm |
| | | |
| | | |
| index |
| | | |
| markets |
| | | |
| | | |
| a
= 1 | |
0.085 | 0.012 |
13.947 | | |
| | | |
a
= 2 | Suitable for not
collusive | 0.085 |
0.012 |
13.837 | | | |
| | | |
markets | |
| | |
Entropy | 0 £
E £ |
log | n |
| Based on expected |
3.282 |
0.152 | 4.633 |
| | | |
| | |
information content of a | |
| | | |
| | | |
| distribution |
| | |
the post-reform period. Two different patterns are very clear:
(a) there exists a uniform ordering/trend across various measures, (b) although
reform process reduced concentration in the industry, the speed of reduction has
been noticeably slow. However, the role of financial liberalisation in lowering
concentration is clearly established. It is interesting to note that the major
part of the change in the structure had occurred during the early 1990s. Thus,
the spate of mergers during the late 1990s did not change the market structure
significantly. |
Table 5 : Movement of Various Measures
of Concentration: 1989-90 to 2000-01 |
| | | |
| | | |
| | | |
Year |
No. of |
GINI |
1-Bank |
HHI |
HTI |
RI |
CCI |
CC |
Entropy | | |
Banks |
| Ratio |
| | | |
| | |
1990 | 75 |
0.757 |
0.281 |
0.103 |
0.058 |
0.055 |
0.328 |
0.767 |
3.057 | |
1991 |
77 | 0.757 |
0.279 |
0.102 |
0.057 |
0.054 |
0.325 |
0.767 |
3.079 | |
1992 |
77 | 0.750 |
0.278 |
0.101 |
0.055 |
0.052 |
0.324 |
0.760 |
3.105 | |
1993 |
76 | 0.733 |
0.261 |
0.091 |
0.052 |
0.049 |
0.306 |
0.742 |
3.174 | |
1994 |
74 | 0.721 |
0.256 |
0.089 |
0.050 |
0.048 |
0.301 |
0.731 |
3.192 | |
1995 |
83 | 0.725 |
0.237 |
0.079 |
0.049 |
0.044 |
0.282 |
0.734 |
3.300 | |
1996 |
92 | 0.738 |
0.241 |
0.079 |
0.047 |
0.041 |
0.283 |
0.746 |
3.340 | |
1997 |
97 | 0.734 |
0.233 |
0.075 |
0.045 |
0.039 |
0.274 |
0.742 |
3.404 | |
1998 |
100 | 0.734 |
0.226 |
0.072 |
0.045 |
0.038 |
0.267 |
0.742 |
3.437 | |
1999 |
100 | 0.732 |
0.234 |
0.075 |
0.046 |
0.037 |
0.273 |
0.740 |
3.433 | |
2000 |
100 | 0.729 |
0.236 |
0.074 |
0.045 |
0.037 |
0.273 |
0.736 |
3.441 | |
2001 |
99 | 0.727 |
0.244 |
0.077 |
0.045 |
0.037 |
0.279 |
0.735 |
3.425 |
To establish the observed first
pattern, Table 6 presents product-moment correlations among various concentration
indices in India over time10. Results based on almost all the pairs
are similar, displaying a high degree of correlation. The strongest correlations
are found between CR1 and CR2, RI and CR3, CCI and CR1, HHI and CR1. These results
clearly demonstrate that, at least in the Indian context, the behaviour of various
concentration indices is very similar. Thus, our results indicate that though
a host of measures for market concentration are available, an empirical application
is unlikely to yield different rankings of a single economy over time. Our results
thus, compliment the results of Bikker and Haaf (2001a), who did a similar exercise
over space. The observed correlations are, however, not very strong when the measures
are based on either total deposits or total income , indicating that some differences
could exist across the variable, which is used to compute the size distribution
(e.g., asset, deposit and income)11. This is not unlikely because
the markets for different bank products could be sharply different and the largest
banks in one market may not be necessarily so in other ones. Finally,
we compare concentration measures of Indian banking industry to those in a few
other developed economies based on the results of Bikker and Haaf (2001a). Bikker
and Haaf (2001) observed high market concentration in Denmark, Greece, Netherlands
and Switzerland and low market concentration in France, Germany, Italy,
|
Table 6 : Product Moment Correlations
among Different | | |
| |
Measures of Concentration | |
| | | |
GINI |
HHI |
RI |
CR1 |
CR2 |
CR3 |
CR4 |
CCI |
CC |
ENT | |
GINI | 1.00 |
| |
| |
| |
| |
| |
HHI | 0.74 |
1.00 |
| |
| |
| |
| |
| RI |
0.66 |
0.97 |
1.00 |
| |
| |
| |
| |
CR 1 | 0.73 |
0.99 |
0.94 |
1.00 |
| |
| |
| |
| CR 2 |
0.76 |
0.99 |
0.97 |
0.99 |
1.00 |
| |
| |
| |
CR 3 | 0.72 |
0.98 |
0.99 |
0.95 |
0.98 |
1.00 |
| |
| |
| CR 4 |
0.70 |
0.95 |
0.99 |
0.91 |
0.95 |
0.99 |
1.00 |
| |
| |
CCI | 0.73 |
0.99 |
0.97 |
0.99 |
0.99 |
0.98 |
0.95 |
1.00 |
| |
| CC |
0.99 |
0.79 |
0.72 |
0.78 |
0.81 |
0.77 |
0.75 |
0.78 |
1.00 |
| |
ENT | -0.66 |
-0.98 |
-0.99 |
-0.95 |
-0.97 |
-0.99 |
-0.99 |
-0.98 |
-0.72 |
1.00 |
Luxembourg and the US. Table 7 juxtaposes
the HHI and CRk (for k=3, 5 and 10) measures based
on total assets for India along with similar measures for 20 countries during
the year 1997. It is interesting to observe that market oncentration in banking
in India appears to be low as compared to other countries. For example, India
ranks joint 8th (with Spain) with respect to HHI and joint 6th
(with UK) with respect to CR3 measure.
| Table
7: Concentration Indices for 21 Countries, based on Total
Assets: 1997 | |
Countries | HHI |
| | |
No. of banks | | |
| CR3 |
CR5 |
CR10 |
| | Australia |
0.14 |
0.57 |
0.77 |
0.90 |
31 | |
Austria |
0.14 |
0.53 |
0.64 |
0.77 |
78 | |
Belgium | 0.12 |
0.52 |
0.75 |
0.87 |
79 | |
Canada |
0.14 |
0.54 |
0.82 |
0.94 |
44 | |
Denmark | 0.17 |
0.67 |
0.80 |
0.91 |
91 | |
France |
0.05 |
0.30 |
0.45 |
0.64 |
336 | |
Germany | 0.03 |
0.22 |
0.31 |
0.46 |
1803 | |
Greece |
0.20 |
0.66 |
0.82 |
0.94 |
22 | |
India | 0.08 |
0.34 |
0.43 |
0.62 |
97 | |
Ireland |
0.17 |
0.65 |
0.73 |
0.84 |
30 | |
Italy | 0.04 |
0.27 |
0.40 |
0.54 |
331 | |
Japan |
0.06 |
0.39 |
0.49 |
0.56 |
140 | |
Luxembourg | 0.03 |
0.20 |
0.30 |
0.49 |
118 | |
Netherlands |
0.23 |
0.78 |
0.87 |
0.93 |
45 | |
Norway | 0.12 |
0.56 |
0.67 |
0.81 |
35 | |
Portugal |
0.09 |
0.40 |
0.57 |
0.82 |
40 | |
Spain | 0.08 |
0.45 |
0.56 |
0.69 |
140 | |
Sweden |
0.12 |
0.53 |
0.73 |
0.92 |
21 | |
Switzerland | 0.26 |
0.72 |
0.77 |
0.82 |
325 | |
UK |
0.06 |
0.34 |
0.47 |
0.68 |
186 | |
US | 0.02 |
0.15 |
0.23 |
0.38 |
717 | |
Source : Except India, other figures have been taken
from Bikker and Haaf (2001a). |
II.3 Changes in the Market Structure in Indian Banking: Dynamic Measures In
the case of computing generalised entropy measures, the permanent assets (deposits/income)
are computed based on µ t weights. These weights used
here are the ratio of mean assets at µt time t
to the mean assets over the entire M periods. In our computations, the
substitutions parameter b is restricted by the relation -g
= 1 + b. We computed four different aggregator functions corresponding
to four inequality measures with -g = V = (2, 1, 0.5,
0.0). V = 0.0 and 1.0 correspond to Theil’s first and second inequality
measures, respectively, combined with the linear and the Cobb-Douglas forms of
the aggregator function. Table 8 provides the annual short-run inequalities, the
inequalities in the aggregated (long-run) assets, and the assets stability measures
RM. Decomposition of each ‘between’ and ‘within’ groups is also presented. Short-run
inequality in Table 8 has generally decreased. Surprisingly, the inequality has
not become greater with larger degrees of relative inequality aversion (V).
For V other than 2, the ‘within-group’ component of short-run inequalities
is dominant. However, the absolute values of both ‘within-group’ and ‘between-group’
inequality measures have recorded a significant decline over the 12 years period. The
long-run inequality has recorded relatively less volatility. In all the years,
the values of Ig(S) have decreased and in most cases they
are dominated by ‘within-group’ component measures. In some cases, the long-run
inequality measures are higher than the short-run component. It may be mentioned
that these relative values are somewhat sensitive to the size distribution. The
corresponding stability measures showed somewhat different pattern. Although,
the stability measures have fallen over the years, they have been highly dominated
by ‘between-group’ component and the impact of ‘within-group’ has been marginalised.
Thus, there is a tendency for the profiles of the banks to fall, and then level
off in the years to come. These patterns are robust with respect to the choice
of aggregation function, size-adjustment and inequality measure.
| Table
8: Empirical Values of Generalised Entropy Measures |
| Year |
| Shortrun |
Longrun |
| | Stability |
| | |
Overall |
Between |
Within |
Overall |
Between |
Within |
Overall |
Between |
Within | | |
| | | |
| | | |
| | | |
| Degree
of inequality aversion = 2.0 | |
| | |
1990-93 | 2.028 |
0.891 |
1.137 |
2.068 |
0.904 |
1.164 |
1.020 |
1.014 |
0.006 | |
1990-95 |
1.744 |
0.762 |
0.982 |
1.877 |
0.794 |
1.084 |
1.076 |
1.042 |
0.035 | |
1990-97 | 0.959 |
0.641 |
0.319 |
1.243 |
0.696 |
0.547 |
1.296 |
1.086 |
0.210 | |
1990-99 |
0.777 |
0.544 |
0.233 |
1.036 |
0.620 |
0.416 |
1.333 |
1.139 |
0.194 | |
1990-01 | 0.696 |
0.475 |
0.221 |
0.904 |
0.564 |
0.340 |
1.299 |
1.187 |
0.112 | |
1996-01 |
0.552 |
0.354 |
0.198 |
0.581 |
0.362 |
0.219 |
1.053 |
1.022 |
0.030 | | |
| |
Degree of inequality aversion = 1.0 |
| | | |
1990-93 |
1.333 |
0.507 |
0.826 |
1.141 |
0.375 |
0.766 |
0.856 |
0.740 |
0.116 | |
1990-95 | 1.254 |
0.460 |
0.794 |
1.074 |
0.348 |
0.727 |
0.856 |
0.755 |
0.102 | |
1990-97 |
1.175 |
0.409 |
0.766 |
1.016 |
0.311 |
0.705 |
0.865 |
0.759 |
0.105 | |
1990-99 | 1.134 |
0.364 |
0.770 |
0.982 |
0.276 |
0.706 |
0.866 |
0.758 |
0.108 | |
1990-01 |
1.112 |
0.328 |
0.784 |
0.972 |
0.246 |
0.726 |
0.874 |
0.750 |
0.124 | |
1996-01 | 1.052 |
0.273 |
0.780 |
0.956 |
0.232 |
0.724 |
0.909 |
0.852 |
0.057 |
| | | |
Degree of inequality aversion = 0.5 |
| | | |
1990-93 |
1.068 |
0.425 |
0.643 |
1.063 |
0.422 |
0.641 |
0.995 |
0.993 |
0.002 | |
1990-95 | 1.017 |
0.394 |
0.623 |
1.008 |
0.387 |
0.621 |
0.991 |
0.982 |
0.009 | |
1990-97 |
0.966 |
0.357 |
0.609 |
0.955 |
0.344 |
0.611 |
0.989 |
0.965 |
0.024 | |
1990-99 | 0.936 |
0.323 |
0.613 |
0.921 |
0.305 |
0.616 |
0.984 |
0.945 |
0.039 | |
1990-01 |
0.921 |
0.294 |
0.627 |
0.905 |
0.272 |
0.633 |
0.983 |
0.927 |
0.055 | |
1996-01 | 0.879 |
0.251 |
0.628 |
0.879 |
0.247 |
0.632 |
1.000 |
0.981 |
0.019 |
| | | |
Degree of inequality aversion = 0.0 |
| | | |
1990-93 |
1.147 |
0.438 |
0.709 |
1.331 |
0.506 |
0.825 |
1.160 |
1.155 |
0.006 | |
1990-95 | 1.093 |
0.397 |
0.696 |
1.262 |
0.458 |
0.804 |
1.155 |
1.153 |
0.001 | |
1990-97 |
1.041 |
0.358 |
0.683 |
1.194 |
0.405 |
0.789 |
1.147 |
1.132 |
0.015 | |
1990-99 | 1.011 |
0.333 |
0.678 | 1.143 |
0.358 |
0.785 | 1.131 |
1.075 |
0.055 | | 1990-01 |
0.997 |
0.324 | 0.673 |
1.115 |
0.320 | 0.795 |
1.118 |
0.988 | 0.130 |
| 1996-01 |
0.955 |
0.303 | 0.652 |
1.063 |
0.271 | 0.792 |
1.113 |
0.893 | 0.220 |
The fact that the profiles
are becoming flatter is an indication that, although there have been some transitory
movements in the size distribution of assets, there is a lack of any permanent
equalization. Further more, while some equalisation has taken place within each
group of banks, inequality between groups has been noticeably high.
Section III Impact on Prices and Quantities In
this section, we examine the possible impact of the changes in concentration on
the prices and output in the banking sector. It may be noted that as we have limited
observations (e.g., annual data only), the causal nature of market structure
and performance is difficult to establish. It is well known that even in a market
structure that is apparently monopolistic, competitive prices may exist due to
threat of entry. Our arguments in this section are, therefore, not definitive.
However, despite limitations, our observations in this section may turn out to
be useful in reconciling the conceptual anomalies and as a consequence, in forming
the suitable hypotheses. The literature
that discusses the relationship between market structure and competitiveness is
voluminous. The survey of Bikker and Haaf (2001a) also covers this area, focussing
on different theoretical and empirical approaches with special reference to banking.
To link concentration and competitiveness empirically, one needs to specify and
estimate appropriate models based on panel data.1 2 In the panel data
models, disaggregated bank specific data on some ‘performance’ measures is regressed
on the bank’s own market share, market concentration at the aggregate level and
other ‘control’ factors. The ‘performance’ measures are typically based on profits
or prices. While data on profits are taken from the profit and loss accounts of
banks, appropriate bank specific interest rates are supposed to be a proxy for
the prices. Empirical findings suggest monopolistic competition; competition appears
to be weaker in the local markets and stronger in the international markets. The
relationship for the impact of market structure on competition seems to support
the conventional view that concentration impairs competitiveness. It
may be noted that whatever be the theoretical structure specified, the empirical
measures for ‘prices’ in banking are not very clear. As there is no clear common
methodology for measuring prices and output of financial intermediation services
and SNA 1993 recognizes this as a problem area, Subsection III.1 discusses a few
common conceptual problems in the literature, and in this context, emphasises
that the direct use of select interest rates as a ‘price’ measure may not be conceptually
appropriate. Arguing on the basis of the user cost approach, we suggest the use
of spread as ‘price’ measures for banking. Subsection III.2 reviews alternative
empirical estimates of prices and output for this sector in India during the reference
period, and attempts to relate it to our earlier findings. In particular, it compares
inflation measures for banking based on traditional GDP deflators and spread,
and finds the latter to be more consistent with the changing patterns of market
structure of banking in India. III.1 Conceptual
Problems in Measurement of Prices and Output of Financial Intermediation Services It
may be noted that measurements of prices and output of services are difficult
because services are produced and consumed at the same point of time. Also, prices
of services are more dispersed across regions because of their non-tradable nature
(Grilliches, 1992). Besides these common problems, measurements of prices and
output of financial services are further limited due to many conceptual problems
that have not yet been resolved satisfactorily. First, it is not clear whether
financial services are attached to the financial instruments, accompanying the
transactions or to the monetary units being transacted. Most of the activities
of a bank involve processing documents (such as cheques and loan payments) and
dealing with customers (Benston et al., 1982). Consequently, previous researchers
have used the average number of deposit and loan accounts serviced per month as
their unit of output to measure the customer related services. Alternatively,
Fixler (1993) has argued that the amount of financial services sold by a bank
can be more appropriately measured by the money balances in the various products.
Secondly, it is not clear which financial services are relevant to the measurement
of output: those attached to assets, liabilities or both? This question concerns
the precise identification of inputs and outputs. The
debate on measurement of bank output mainly revolves around the status of demand
deposit related financial services . Demand deposits have the characteristics
of both input and output. On one hand, they are like ‘raw materials’ in the financial
intermediation process and are used for ‘production’ of loans and investment;
on the other hand, a host of ‘final’ services (e.g., maintenance of money,
free cheque facilities, etc.) are attached to them. Till now, consensus
regarding the status of demand deposit has not emerged in the literature. Thirdly,
many of the financial services are jointly produced with a sequence of barter
transactions and are typically assigned to a bundle of financial services, the
‘pricing’ of which is difficult and is often apparently ‘free’ in nature. These
conceptual problems imply that any measurement of the services provided by banks
in real terms would be difficult. In the absence of precise measures of prices
and output in banking, researchers have attempted to resolve the problem indirectly
by developing certain indicators – either for production or for the prices. A
few common indicators have been used widely in official statistics, for conversion
of value added of the banking sector from current prices to constant prices. In
many cases, the indicators have focused on a single aspect related to the sector,
concentrating on a simple ratio-variable and hoping that other related variables
move proportionally to the one proposed. Till the end of
1980s, the United States’ (US) Bureau of Economic Analysis (BEA) used one such
indicator for conversion of gross product originating (GPO) in the banking sector
from current prices to constant prices. To do that, the benchmark value of GPO
at current prices was determined for a particular year. Output for subsequent
years was calculated by extrapolating the benchmark value by a factor based on
the ‘number of persons engaged in production’, the implicit assumption in the
method being that there had not been any growth in labour productivity in banking!
When applied, the estimates showed very small real output growth in the banking
sector, so small that many economists believed that the method underestimated
real output of the banking sector in the US economy (Fixler, 1993). So far as
the other countries are concerned, it is also not uncommon to find the movement
of value added at constant prices estimated by means of changes in the compensation
of employees at constant prices (SNA 93, page 397). The
conversion factor used in the National Accounts Statistics (NAS) in India is slightly
different. In India, the base year estimates of value added from the banking sector
are carried forward using an indicator based on the ratio of aggregate deposits
for the two years and the wholesale price index (WPI). The volume of activity
is measured in value terms, the indicator being the ratio of aggregate deposits.
To obtain the quantity index, the ratio of deposits for two years is deflated
by WPI. It may be noted that the
‘quantity index’ of banking used in the NAS in India covers only one aspect of
banking, i.e., deposits; other aspects like credit are totally neglected.
This may turn out to be a serious limitation because the different products of
banks are fairly heterogeneous in nature. A composite index based on activities
of a bank would perhaps be more preferable. Moreover, deflation by WPI to derive
the quantity index is tantamount to the assumption that ‘prices’ for banking move
parallel to that of the goods sector as a whole, which may not be valid in reality. Besides
these simple indicators, models of real banking activity and measures for ‘prices’
and ‘quantities’ of various products offered by banks have also been developed
in the bank regulation literature. To determine whether economies of scale exist
in banking, researchers have estimated explicit multioutput production or cost
functions. Typically, such functions include bank financial inputs and outputs,
and the usual capital, labour and material inputs. Though precise measures of
nominal and real outputs are absolutely crucial for such studies, a variety of
approaches have been followed, and a consensus on conceptual questions has not
yet emerged. In the literature, three distinct approaches,
viz., the asset approach, value added approach and user cost approach,
are available. The process of generation of output and the role of demand deposit
in all these three approaches are sharply different. Each of these approaches
has certain advantages and certain drawbacks and adoption of any one of them depends
on the objective of the study. A detailed discussion on all these approaches is
beyond the scope of the paper.1 4 The paper restricts
its attention on the user cost approach because a major focus in this approach
is on measuring the implicit prices of financial intermediation through user cost
(Hancock, 1985; Fixler and Zieschang, 1992; Fixler, 1993). The user cost approach
attempts to measure prices of financial intermediation from the interest rates
of different financial instruments. In traditional applications, prices of different
financial instruments have been measured as deviations of the rate of return associated
with them from a benchmark risk-free financial instrument (e.g., discount
rates of treasury bill, coupon rates of standard Government bonds, bank rates,
etc.). But the problem with this approach is that the estimates provided
by it would be crucially related to the profitability of the banking sector. If
the risk of default is high, banks might not be willing to disburse more credit
as the amount disbursed might turn into a non-performing asset (NPA). If NPAs
of banks increase, the effective returns from these assets would decrease. In
such situations, the banks might tend to allocate a substantial portion of their
funds in approved securities. Thus, if the profitability of the banking sector
decreases, returns from advances would become closer to the return from the benchmark
rates and for some periods, it might be less than these rates leading to zero
or negative prices for some instruments. Alternatively, the weighted average rates
of all asset and liability products of the banking sector have also been considered
as the ‘standard’ rate. In the Indian cont ext, Srimany
and Bhattacharya (1998) have obtained empirical estimates based on traditional
user cost approach and compared the results with alternative estimates. Samanta
and Bhattacharya (2000), on the other hand, highlight the role of spread in this
context. Their study demonstrates that under some simplifying conditions, the
spread between rates of interest charged by the bank to borrowers and depositors
could be given the interpretation of a price for financial intermediation. III.2
Empirical Estimates of Prices and Output of Banking Services in India In
this section, we examine the behaviour of ‘price’ and ‘output’ of the banking
sector from the national income data. Figure 1 presents the nominal (Chart 1a)
and the real (Chart 1b) growth rates in GDP from the banking sector during the
period under study. To compare the sector’s relative performance, these figures
have been juxtaposed with the overall nominal and real growth of GDP in the respective
parts. In Chart 1a, the 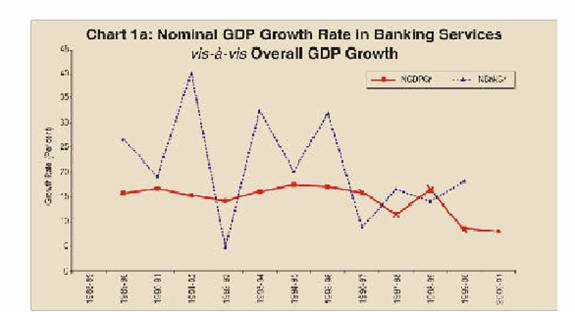 curves
of NGDPGr and NBnkGr reflect the nominal overall GDP growth and GDP growth pertaining
to the banking sector, respectively. Similarly, In Chart 1b, the curves of RGDPGr
and RBnkGr show the corresponding values in real terms. Using
the nominal and real GDP figures, the implicit deflators in banking as well as
for the entire economy could be obtained. These deflators could be used to obtain
measures pertaining to sectoral and overall inflation. Chart 2 presents the implicit
‘inflation’ in banking services as per the NAS in India (Inf_Bnk). Once again,
to compare its relative performance, these figures have been juxtaposed with (i)
the overall ‘inflation’ in all commodities and services as measured by the GDP
deflator (Inf_GDP), and (ii) inflation based on WPI (Inf_WPI). It
may be noted that the method adopted by India in preparing National Accounts Statistics
is fully consistent with the international conventions. Given this, the above
figures look strange. While it is expected that the growth rates in a services
sector may be erratic and may fluctuate from year to year, such high fluctuation
reveals the general methodological weakness in the convention adopted internationally.
Is it possible that when inflation rates in almost all the sectors in an economy
are on a declining trend, the banking sector experiences a more than 20 per cent
rise in the prices and in the very next year experiences a deflation? We argue
that the NAS is providing 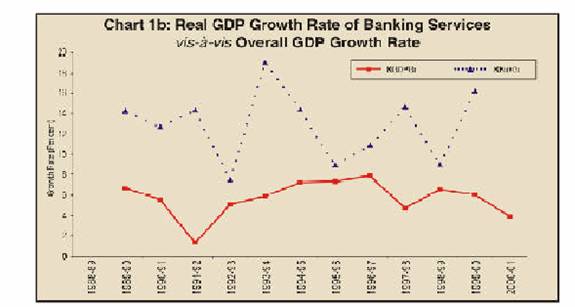
a misleading picture because there is circularity in measurement of banking services.
The circularity occurs because of the use of WPI to deflate the ‘nominal’ figures
of the value added in the banking services, and that too based on solely the movements
in deposits. As an alternative, we examine the movements
in spread-based measures. Although the theoretical implications of spread have
been examined in detail, there is no unique empirical definition of spread. Brock
and Rojas-Saurez (2000) have suggested six alternative proxies for banks spread,
ranging from a narrow concept – one that includes 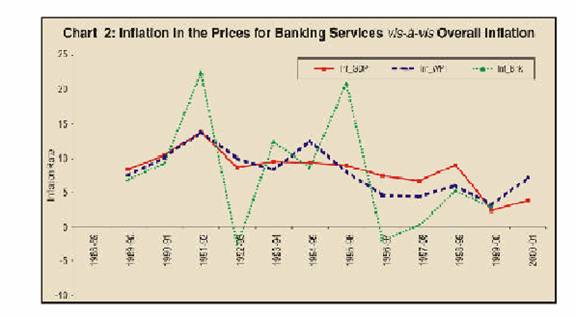
loans and investments in the assets side and deposits and borrowings in the liability
side – to a broad concept, where all interest earning assets and interest bearing
liabilities plus associated fees and commissions are included. In addition,
one may perhaps consider the simple difference of a standard lending rate and
the deposit rate as a proxy. In the Indian context, some of these measures have
been computed and examined, sometimes separately across bank groups. For example,
Chapter VII of the Report on Currency and Finance (1999-2000) defines spread as
net interest income to total assets and computes this measure separately across
bank groups from 1991-92 to 1999-00. The Report observes a gradual reduction of
spread and attributes this reduction to competitive pressures. The Report also
observes '…a tendency towards their convergence across all bank-groups, except
foreign banks …' (pp. VII-1) In addition to the measures
suggested by Brock and Rojas-Saurez (2000), in this paper, we have considered
three additional measures based on the simple differences between lending and
deposit rates. As the interest structure during the early 1990s in India was administered,
these measures are expected to reveal the extent of 'administered spread' in India
during the same period. The definitions of these measures are presented in Table
9. Table 10 presents estimates pertaining to the nine alternative
measures of spread from 1989-90 to 2001-02. From Table 10, it is observed that
there are strong correlations among many of the pairs of measures for spread.
In general, correlations for pairs within a broad group are high and sometimes
more than 0.95. However, in general correlations for pairs in different groups
are moderate. Interestingly, measures in Group 3 have negative correlations with
measures in other groups. A detailed examination of these
measures reveals that they are in general agreement with the observations of Reserve
Bank of India. Almost all the measures display a decreasing trend during the second
half of the 1990s. Thus, the spread appears to have decreased, implying a change
in the price for financial intermediation. In this context, it may be noted that
as during the early 1990s, interest rates in India were administered, the measures
for spread during these periods may not reflect market forces properly and thus,
may not be consistent with the existing
| | Table
9: Alternative Definitions of Spread | |
| Group 1 |
| | |
SPN1= | [(interest
earned on advances/advances)–(interest paid on deposits/ |
| | deposits)]*
100; | | |
SPN2 = | [(interest
earned on advances/advances)–(interest paid on deposits and |
| | borrowings)/(deposits+borrowings)]*
100; | | |
SPN3 = | [(interest
earned on advances and investments)/(advances+investments)– |
| |
(interest paid on deposits and borrowings)/(deposits+borrowings)]* 100; |
| | | |
| Group 2 |
| | |
SPB1 = | (interest
earned –interest paid)/(total assets)*100; | |
| SPB2 = |
[{(interest earned)/(interest earning assets15)}
– | | | |
{(interest paid)/(interest bearing liabilities16
)}]*100; | | |
SPB3 = |
[{(interest earned +commission, exchange and brokerage)/ |
| |
(interest earning assets)} – {( interest paid)/(interest bearing |
| | liabilities)}]*
100; | | |
Group 3 | | |
| SPI1 = |
Lending Rate – Time Deposit Rate for Less Than One
YearMaturity | |
SPI2 = | Lending Rate
– Time Deposit Rate for One to Three Years |
Maturity | |
SPI3 = | Lending Rate
– Time Deposit Rate for Beyond Five Years |
Maturity |
market
structure. However, it is interesting to observe that from 1995-96 onwards, all
the measures of spread pertaining to the first two groups reveal a strong downward
trend. Thus, it is logical to argue that as soon as the administered price regime
in banking in India was lifted, the
| Table
10 : Alternative Measures of Spread in the Banking Sector
in India: 1989-90 to 2001-02 | |
Year | SPN1 |
SPN2 |
SPN3 | SPB1 |
SPB2 |
SPB3 | SPI1 |
SPI2 |
SPI3 | |
1989-90 | | |
1.78 |
2.46 | 3.28 |
7.00 |
6.50 | 6.50 |
| | 1990-91 |
| | 1.77 |
2.43 |
3.32 | 7.00 |
5.50 |
5.50 | | |
1991-92 | 6.27 |
5.57 |
3.95 | 3.31 |
4.14 |
4.99 | 4.50 |
3.50 |
3.50 | | 1992-93 |
4.81 |
4.63 | 3.67 |
2.50 |
3.48 | 4.33 |
8.00 |
8.00 | 8.00 |
| 1993-94 |
5.22 |
5.14 | 3.71 |
2.54 |
3.32 | 4.22 |
9.00 |
9.00 | 9.00 |
| 1994-95 |
4.25 |
4.24 | 4.37 |
3.01 |
3.65 | 4.59 |
4.00 |
4.00 | 4.00 |
| 1995-96 |
5.43 |
5.37 | 4.90 |
3.15 |
3.82 | 4.85 |
4.50 |
3.50 | 3.50 |
| 1996-97 |
6.29 |
6.29 | 4.86 |
3.22 |
3.85 | 4.82 |
3.00 |
2.00 | 1.75 |
| 1997-98 |
4.60 |
4.60 | 4.21 |
2.95 |
3.38 | 4.28 |
3.25 |
2.25 | 2.25 |
| 1998-99 |
4.19 |
4.26 | 3.85 |
2.78 |
3.15 | 4.00 |
3.00 |
2.00 | 2.00 |
| 1999-00 |
3.59 |
3.61 | 3.58 |
2.72 |
3.13 | 3.94 |
3.00 |
1.75 | 1.75 |
| 2000-01 |
3.74 |
3.78 | 3.62 |
2.84 |
3.18 | 3.91 |
2.75 |
1.75 | 1.75 |
| 2001-02# |
3.05 |
3.22 | 3.15 |
2.81 |
3.10 | 3.82 |
3.25 |
2.87 | 2.87 |
| # : Provisional
for SPI1, SPI2 and SPI3. | | |
| | | |
favourable market structure
put a downward pressure on the prices through competition. The result once again
establishes that a favourable market structure alone may not be adequate for competitive
prices and other institutional features and policy measures also contribute significantly
towards it. Section IV Conclusion The
paper examined the nature and the extent of changes in the market concentration
in the Indian banking sector and their possible implications on competitiveness,
prices and outputs of banking services. The paper was logically divided into two
parts. The first part measured market concentration in banking in India in alternative
ways from 1989-90 to 2000-01. In contrast to earlier empirical applications on
banking, this paper focussed on both static and dynamic measures of market concentration.
The paper found strong evidence of change in market structure in banking in India.
Interestingly, results reveal that a major part of the change in market structure
occurred during the early 1990s. Despite a spate of mergers during the late 1990s,
banking market concentration in India was not significantly affected. It was also
observed that different concentration ratios rank the changes of banking market
concentration in India similarly over time. This result, in conjunction with Bikker
and Haaf (2001a), provides evidence that despite the existence of a host of concentration
measures, empirical rankings of countries over space or time may not be significantly
affected due to differences in measures used. The second
part of the paper analysed the possible impact of changes in banking market structure
on prices and output during the same period. It was articulated that before measuring
competitiveness, the fuzzy issues relating to measurements of prices and quantities
of banking services needed to be satisfactorily resolved. Using Indian data, the
paper demonstrated that measurement problem of real output pertaining to banking
sector in the national income data could be severe. The implied inflation as obtained
through the GDP deflator for the banking sector in India led to unbelievable measures
of inflation for banking services, casting some doubt on the methodology adopted.
Alternatively, proxy price measures based on spread appeared to be more consistent
with the changes in market structure in India during the late 1990s. The paper
argued that the favourable market structure in India could be one important factor
that led to a reduction in the ‘prices’ of banking services after the
administered interest regime was lifted. Although it might be wrong to attribute
the entire change in spread to the change in market structure, it was logically
one important factor that could lead to lagged reduction in the ‘prices’ of banking
services in a favourable environment, freed from arbitrary price restrictions.
A deeper study addressing these problems in a cross-country perspective would
thus, be useful in narrowing the current gaps in the literature. Notes
1 For example, the Report on Currency and Finance
(1998-99) published by the Reserve Bank of India reports some of these indices
and comments on the nature of concentration of export of the Indian economy (pp.IX.6). 2
For example, the survey of Bikker and Haaf (2001a) demonstrates that for 20 countries,
the rankings of the k-Bank Concentration Ratios and the HHI are strongly
correlated. 3 In the US, the Department of Justice, uses HHI
to assess whether mergers and acquisitions 'significantly’’ constitute a threat
to competition. 4 This is particularly so in
the case of econometric studies of 'wage dispersion’’ in which statistical causes
of dispersion are usefully identified, but welfare-theoretic motivation is lacking
with regards to ‘‘dispersion’’ as a measure of 'mobility’’, or inequality. 5
In other work with PSID data, Maasoumi and Zandvakili (1990) have studied different
weights, including Principal Component weights and unequal subjective weights.
They find these weights are inconsequential for the qualitative inferences and
rankings. 6 The taxonomy, in detail, is available
in the 'Report on Trend and Progress of Banking in India', published by the Reserve
Bank of India (RBI), for different years. These Reports also analyse the implications
of the major developments in the Indian banking market in detail. 7
See the Box II.1 entitled ‘Merges and Acquisition in Banking: International Experiences
and Indian Evidence’ in the 'Report on Trend and Progress of Banking in India
2000-01' (pp. 51–52) by the Reserve Bank of India for details. 8
The results based on other indicators at industry as well as bank-group level
are available with the authors. 9 See Bikker and Haaf (2001a)
for details 10 The rank-correlations among various indices also
show similar results. 11 Results are available with the authors
and can be obtained on request. 12 The structural
approach to model competition includes Structure-Conduct-Performance (SCP) paradigm
and efficiency hypothesis. The SCP paradigm investigates, whether a highly concentrated
market causes collusive behaviour among large banks resulting in superior market
performance; whereas efficiency hypothesis tests, whether it is the efficiency
of larger banks that makes for enhanced performance. On the other hand, non-structural
mod e l s like Panzar and Rosse (P-R) model, uses explicit information about
the structure of the market. 13 These types of
indices have been applied to measure productivity of the banking sector. U.S.
measures of banking labor productivity adopt the activity approach – bank output
includes counts of loan and deposit activities (such as loan applications processed
and cheques cleared). 14 For a recent survey of literature, see
Srimany and Bhattacharya (1998). 15 Interest earning assets include
advances, investments, balances with central bank, balances with other banks and
money at call and short notice. 16 Interest bearing liabilities
include deposits and borrowings. References Atkinson T. (1970):
‘On the Measurement of Inequality’, Journal of Economic Theory, II, pp.244-263. Bain
J. S., (1956): Barriers to New Competition, Harvard University Press, Cambridge. Bain
J. S. (1966): International Differences in Industry Structure, Yale University
Press, New Haven. Baldwin J. R. and P. K. Gorecki (1994): ‘Concentration
and Mobility Statistics in Canada’s Manufacturing Sector’, Journal of International
Economics, 42, pp.93–103. Barth J. R. and R. D. Brumbaugh Jr. and J.
A. Wilcox (2000): ‘The Repeal of Glass-Stegall and the Advent of Broad Banking’,
Journal of Economic Perspectives, 14, pp.191–204. Benston G., G.
Hanweck and D. Humphrey (1982): ‘Scale Economies in Banking’, Journal of Money,
Credit and Banking, 14, pp.435–456. Bikker J. A. and K. Haaf (2001a):
‘Measures of Competition and Concentration: A Review of Literature’, De Nederlandsche
Bank, Amsterdam. Bikker J. A. and K. Haaf (2001b): ‘Competition, Concentration
and Their Relationship: An Empirical Analysis of the Banking Industry’, De
Nederlandsche Bank (DNB) Staff Reports, No. 68. Brock P. L. and L. Rojas-Saurez
(2000): ‘Understanding the Behaviour of Bank Spread in Latin America’, Journal
of Development Economics, 63, pp.113-134. Calem P. S. and G. A. Carlino
(1991): ‘The Concentration/Conduct/Relationship in Bank Deposit Markets’, Review
of Economics and Statistics, 73, pp.268–276. Chakravarty S. R. (1999):
‘Measuring Inequality: The Axiomatic Approach’ in Handbook on Income Inequality
Measurement by Jacques Silber (Ed.), Kluwer Academic Publishers, Boston. Davies
S. W. and P.A. Geroski (1997): ‘Changes in Concentration, Turbulence, and the
Dynamics of Market Shares’, Review of Economic Statistics, 79, pp.383–91. Dean
E. R. and K. Kunze (1992): 'Productivity Measurement in Service Industries' in
‘Output Measurement in the Services Sector’ by Griliches, Z.(Ed.), National
Bureau of Economic Research, Studies in Income and Wealth, Volume 50, University
of Chicago Press, pp.73–107. De Bandt O. and E. P. Davies
(2000): ‘Competition, Contestability and Market Structure in European Banking
Sectors on the Eve of EMU’, Journal of Banking and Finance, 24, pp.1045–1066. Diewert
W. E. (1976): ‘Exact and Superlative Index Numbers’, Journal of Econometrics,
4, pp.115–145. Fixler D. (1993): ‘Measuring Financial Service Output and
Prices in Commercial Banking’, Applied Economics, 25, pp.983–993. Fixler
D. and K. D. Zieschang (1992): 'User Costs, Shadow Prices, and the Real Output
of Banks' in ‘Output Measurement in the Service Sector’ by Griliches, Z.
(Ed.), University of Chicago Press, Chicago, pp.219–243. Gilbert
R. A. (1984): ‘Bank Market Structure and Competition – A Survey’, Journal of
Money, Credit and Banking, 19, pp.617–645. Griliches Z. [Ed.], (1992):
Output Measurement in the Service Sector, University of Chicago Press, Chicago. Hancock
D. (1985): ‘The Financial Firm: Production with Monetary and Nonmonetary Goods’, Journal
of Political Economy, 93, pp.859–880. Maasoumi E. and H. Theil (1979):
‘The Effect of the Shape of the Income Distribution on Two Inequality Measures’,
Economics Letters, 4, pp.289–291. Maasoumi E. (1986): ‘The Measurement
and Decomposition of Multi-Dimensional Inequality’, Econometrica, 54, pp.991–997. Maasoumi
E. and D. J. Slottje (2002): ‘Dynamics of Market Power and Concentration Profiles’, Mimeo,
Southern Methodist University, Dallas, USA. Maasoumi E. and S. Zandvakili
(1990): ‘Generalised Entropy Measures of Mobility for Different Sexes and Income
Levels’, Journal of Econometrics, 43, pp.121–133. Marfels C. (1971):
‘Absolute and Relative Measures of Concentration Reconsidered’, Kyklos,
24, pp.753–766. Molyneux P., D. M. Lloyd-Williams and J Thornton (1994):
‘Competitive Conditions in European Banking’, Journal of Banking and Finance,
18, pp.445–459. Nathan A. and E. H. Neavel (1989): ‘Competition and Contestability
in Canada’s Financial System: Empirical Results’, Canadian Journal of Economics,
22, pp.576–594. Neumann M. (2001): Competition Policy: History, Theory
and Practice, Edward Elgar, Cheltenham, UK. Panzar J. C. and J. N. Rosse
(1987): ‘Testing for Monopoly Equilibrium, Journal of Industrial Economics,
35, pp.443-456. Pryor F. L. (1972): ‘An International Comparison of Concentration
Ratios’, Review of Economics and Statistics, 54, pp.130–140. Reserve
Bank of India (Various Official Publications) Rhoades S. A. (1995): ‘Market
Share Inequality, the HHI and Other Measures of the Firm Composition of a Market’,
Review of Industrial Organization, 10, pp.657–674. Samanta G. P.
and K. Bhattacharya (2000): ‘Prices of Financial Services: An Index Based on Spread’,
International Journal of Development Banking, 18, pp.71-76. Shaffer
S. and J. Di Salvo (1994): ‘Conduct in Banking Duopoly’, Journal of Banking
and Finance, 18, pp.1063–1082. Shorrocks A. F. (1978): ‘Income Equality
and Income Mobility’, Journal of Economic Theory, 19, pp.376–393. Shorrocks
A. F. (1984): ‘Inequality Decomposition by Population Subgroups’, Econometrica,
52, pp.1369–1385. Smith R. T. (1998): ‘Banking Competition and Macroeconomic
Performance’, Journal of Money, Credit and Banking, 30, pp.793–815. Sen
A., (1973): On Economic Inequality, Clarendon Press, Oxford. Srimany
A. K., and K. Bhattacharya (1998): ‘Measures for Financial Services: A Review
with Special References to Banking in India’, Reserve Bank of India Occasional
Papers, 19, pp.1–38. Tirole J.(1988): The Theory of Industrial Organization,
Cambridge, Mass.: MIT Press. United Nations (1993): System of National Accounts
(SNA 1993 for Short).
|