Money
Market
Foreign Exchange Market
Credit
Market
Government Securities Market
Equity
Market
Financial
markets were flush with liquidity generated by surges in external inflows during
2003-04. In the foreign exchange market, the rupee faced upward pressure vis-a-vis
the US dollar throughout the year. Forward premia declined across the board
in the second half of the year and even turned into discounts in the third quarter
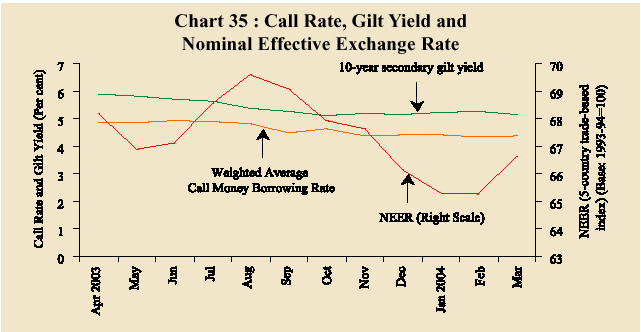
before firming up marginally towards the close of the year. Call rates remained
stable, ruling persistently below the repo rate despite large sterilisation operations
(Chart 35). Gilt yields softened during the first half of the year but remained
generally range-bound in the second half as inflation edged up in January and
February 2004. The yield curve flattened throughout the first half of the year,
undergoing some correction from November with some firming of international interest
rates and profit booking by investors.
In
the credit market, ample liquidity conditions and the soft interest rate bias
in monetary policy enabled banks to cut deposit rates. Lending rates also declined,
though they remained relatively sticky. The introduction of the benchmark prime
lending rate (PLR) system brought about some moderation from the level of tenor
linked PLRs of the earlier regime. Non-food credit, which had been subdued in
the first half of the year, started picking up after August 2003. Credit to medium
and large industry decelerated while priority sector and retail lending recorded
substantial increases. The equity market revived strongly from end-May 2003 in
a broad-based rally (Table 15).
Table
15: Financial Markets at a Glance - 2003-04
|
| | Call
Money | Gilt |
Foreign Exchange | |
Liquidity Management | |
Equity | | |
| Month |
Average
Daily
Turnover
(Rs.crore) |
Average
Call
Rates
(Percent) |
Turnover
in
Govt.
Securities
(Rs.crore)+ |
Average
Daily
Inter-bank
Turnover
(US
$ million) | Average
Exchange
Rate
(Rs.
per
US $) | RBI’s
net
Foreign
Currency
Sales (-)/
Purchases (+)
(US $ million) |
Forward
premia
3-month
(Percent) |
Net
OMO
Sales(-)
Purchases
(+)
(Rs.crore) | Average
Daily
Repos
(LAF)
Outstan-
ding
(Rs.
crore) | Average
Daily
Reverse-
Repo
(LAF)
Outstan-ing
(Rs.crore) |
Average
Daily
BSE
Turnover
(Rs.crore) |
Average
Daily
NSE
Turnover
(Rs.crore) |
Average
BSE
Sensex |
Average
S & P
CNX
Nifty |
| 1 |
2 |
3 |
4 |
5 |
6 |
7 |
8 |
9 |
10 |
11 |
12 |
13 |
14 |
15 |
|
| April |
17,338 |
4.87 | 2,26,803 |
5,585 |
47.38 |
1,432 |
2.08 | -7 |
27,372 |
109 | 1,041 |
2,449 |
3037 | 965 |
| May |
18,725 |
4.87 | 2,99,933 |
5,960 |
47.08 |
2,342 |
1.1 | -5,569 |
25,223 |
10 | 1,072 |
2,604 |
3033 | 963 |
| June |
20,544 |
4.91 | 3,00,504 |
5,837 |
46.71 |
896 | 2.76 |
-44 | 24,805 |
– | 1,187 |
2,933 |
3387 | 1069 |
| July |
18,698 |
4.90 | 3,04,587 |
5,920 |
46.23 |
3,146 |
2.65 | -57 |
42,690 |
39 | 1,434 |
3,429 |
3665 | 1150 |
| August |
19,556 |
4.83 | 4,09,539 |
5,983 |
45.93 |
2,352 |
2.25 | -11,546 |
39,995 |
0 | 1,817 |
4,267 |
3978 | 1261 |
| September |
20,584 |
4.50 | 2,65,848 |
6,862 |
45.85 |
2,345 |
0.91 | -5,107 |
31,373 |
0 | 2,032 |
4,698 |
4315 | 1369 |
| October |
23,998 |
4.64 | 3,89,968 |
7,672 |
45.39 |
1,593 |
0.02 | -13,986 |
13,569 |
0 | 2,288 |
5,026 |
4742 | 1506 |
| November |
15,156 |
4.38 | 1,77,063 |
6,795 |
45.52 |
3,449 |
(-) 0.002 |
-69 | 21,182 |
0 | 2,251 |
4,644 |
4951 | 1580 |
| December |
15,276 |
4.40 | 1,81,991 |
6,207 |
45.59 |
2,888 |
(-) 0.30 |
-132 | 32,020 |
0 | 2,492 |
5,017 |
5425 | 1740 |
| January |
14,189 |
4.43 | 1,81,619 |
7,306 |
45.46 |
3,294 |
.0.50 |
-5,228 |
38,539 |
0 | 3,125 |
6,394 |
5954 | 1906 |
| February |
9,809 |
4.33 | 1,39,130 |
7,171 |
45.27 |
3,357 |
0.51 | -35 |
46,244 |
0 | 2,709 |
5,722 |
5827 | 1849 |
| March |
12,422 |
4.37 | 2,22,685 |
8,018 |
45.02 |
3,382 |
0.62 | -69 |
54,915 |
0 | 2,308 |
4,767 |
5613 | 1780 |
|
| OMO: Open
Market Operations. + Outright turnover in Central Government dated securities.
LAF:
Liquidity Adjustment Facility.
BSE: The Stock Exchange, Mumbai
NSE: National
Stock Exchange. |
Money Market
The
average daily call money borrowing rate remained below the repo rate over the
greater part of the year, except in short-lived episodes in August and October
2003 (Chart 36). The sustained pace of capital flows left money markets with abundant
liquidity in spite of continuous absorptions through repo and open market operations.
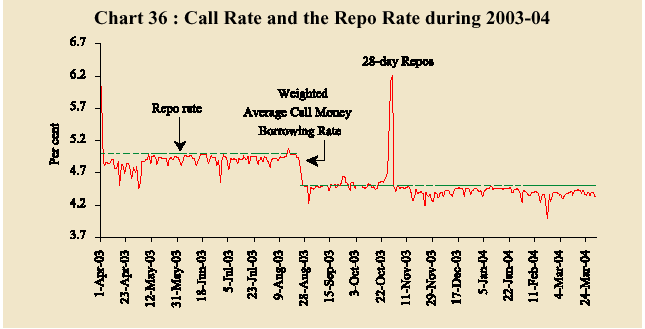
Unsterilised
exchange market interventions, unwinding of the year-end tightness in liquidity
and deferred government expenditure pushed the average call rate below the repo
rate from April 2003. Fund outflows on account of State Government borrowings
and open market sales resulted in isolated spikes in the call rate and some volatility
in August related to the bomb blasts in Mumbai. The call rate adjusted smoothly
to the 50 basis point repo rate cut, effective August 25, and hovered around the
repo rate throughout September and early October, in spite of the redemption of
the Resurgent India Bonds (Rs.22,693 crore). Measures by the Reserve Bank (28-day
repos and open market operations) to absorb excess liquidity from the system in
the second half of October resulted in temporary volatility in call rates. Stability
returned quickly with the call rate remaining below the repo rate from November.
The call rates dipped in February 2004 as large capital inflows continued and
were largely unsterilised. They recovered in March to a little below the repo
rate (Table 16). The call rates continued to be stable at about 4.3 per
cent in a April 2004 with the average daily turnover working out to Rs. 12,916
crore.
Table 16 : Call/ Notice
Money Market: 2003-04
|
| Month |
Average Call/Notice |
Co-efficient of |
Average Daily Call/ |
| | Money
Borrowing Rate | Variation
of | Notice
Money Turnover |
| |
(Per cent) |
Call Rate |
(Rs. crore) |
| 1 |
2 |
3 |
4 |
|
| April |
4.87 | 0.07 |
17,338 |
|
May | 4.87 |
0.02 | 18,725 |
| June |
4.91 | 0.02 |
20,544 |
|
July | 4.90 |
0.01 | 18,698 |
| August |
4.83 | 0.04 |
19,556 |
|
September | 4.50 |
0.01 | 20,584 |
| October |
4.64 | 0.09 |
23,998 |
|
November | 4.38 |
0.02 | 15,156 |
| December |
4.40 | 0.01 |
15,276 |
|
January | 4.43 |
0.01 | 14,489 |
| February |
4.33 | 0.02 |
9,809 |
|
March | 4.37 |
0.01 | 12,422 |
|
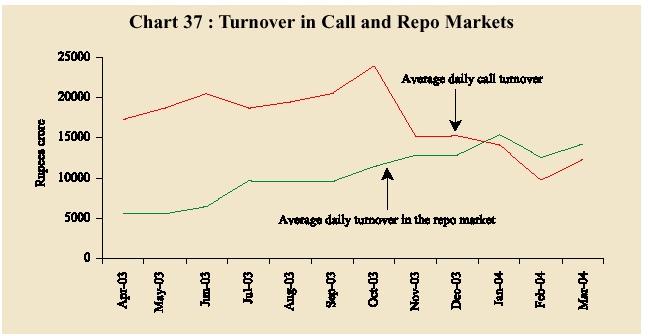
The turnover in the
call/notice money market declined during 2003-04 on account of a significant improvement
in liquidity, reduction in CRR and higher placement of funds in LAF repos. There
was also migration of a part of call borrowing to market repos and to the Collateralised
Borrowing and Lending Operations (CLBO) segments on account of cheaper funding
costs in these markets vis-à-vis the call/ notice market. With the
tightening of prudential norms relating to the exposure of banks to the call market
and the gradual phasing out of non-bank participants from the call market, activity
in the repo market (outside the Reserve Bank) increased (Chart
37)
Treasury
Bills
Primary
yields of 91-day Treasury Bills and 364-day Treasury Bills moved synchronously
with call rates, largely staying below the repo rate. Excess liquidity conditions
in the beginning of the year evinced a vigorous market response to auctions with
bid-cover ratios (ratio of competitive bid amount received to notified amount)
crossing four for 91-day Treasury Bills and three for 364-day Treasury Bills around
mid-April 2003. Yield spreads between the 91-day and 364-day instruments were
virtually absent during end-May to August 2003. The notified amount of 91-day
Treasury Bills was raised temporarily from Rs.500 crore to Rs.1,500 crore for
eight auctions starting from August 6, 2003 to September 24, 2003, keeping in
view the ample liquidity in the system. Temporary misalignment in the Treasury
Bill yields was corrected when the notified amount of 91-day Treasury Bills was
lowered to Rs.500 crore from October 1, 2003. Treasury Bill yields increased in
January and February 2004 with edging up of inflation but softened by March as
inflation fears subsided and conditions of surplus liquidity prevailed (Chart
38).
Primary
yields of Treasury Bills moved downward during 2003-04, but hardened marginally
during February 2004, primarily on account of market uncertainty relating to the
issue of securities under the market stabilisation scheme. Yields, however, fell
back in March reflecting a large liquidity overhang in the system. Yields hardened
again with the spread between 91-day and 364-day yields around three basis points
on April 28, 2004 The bid-cover ratio indicated responsible participation
in the auctions (Table 17).
Table
17 : Treasury Bills in the Primary Market: 2003-04
|
| | Average
Implicit Yield at minimum | Bid-Cover
Ratio |
| |
cut-off Price (Per cent) | |
| | 91-day |
364-day |
91-day |
364-day |
| 1 |
2 |
3 |
4 |
5 |
|
| April |
5.04 | 5.19 |
4.13 | 2.56 |
| May |
4.56 | 4.77 |
1.94 | 1.88 |
| June |
4.95 | 4.95 |
1.91 | 2.51 |
| July |
4.87 | 4.88 |
3.06 | 2.15 |
| August |
4.90 | 4.96 |
1.73 | 2.01 |
| September |
4.60 | 4.65 |
2.91 | 3.32 |
| October |
4.61 | 4.53 |
2.24 | 2.38 |
| November |
4.37 | 4.42 |
3.23 | 2.32 |
| December |
4.19 | 4.32 |
2.76 | 1.80 |
| January |
4.25 | 4.37 |
2.01 | 1.98 |
| February |
4.38 | 4.44 |
3.07 | 1.72 |
| March |
4.24 | 4.36 |
3.42 | 2.28 |
|
Other Money Market Instruments
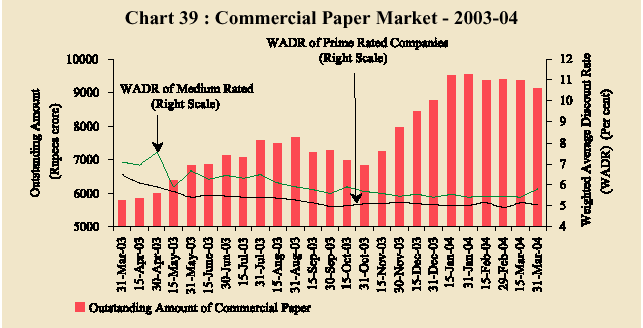
Comfortable
liquidity conditions enabled companies to raise a higher volume of funds through
the issue of commercial paper (CPs) during 2003-04. The outstanding amount of
CPs increased from Rs.5,839 crore at the beginning of the year to Rs.7,646 crore
by end-August 2003 before entering a period of slack through September 2003 and
October 2003. Activity picked up in the CP market from December 2003 reflecting
interest from mutual funds on account of the Securities and Exchange Board of
India's (SEBI) guidelines on investments in non-SLR debt securities and market
perception about cost effectiveness in issuances of CP vis-à-vis bonds
and fixed deposits. Furthermore, reduction in stamp duty on CP issuances boosted
this market. There was a decline in the amount of CPs outstanding during February
and March 2004. As on April 15, 2004 the amount of outstanding CPs was Rs.9,590
crore. With the softening of interest rates across the money market, the weighted
average discount rate (WADR) of prime rated companies declined by 112 basis points
during 2003-04 while that of medium rated companies declined by 129 basis points
(Chart 39).
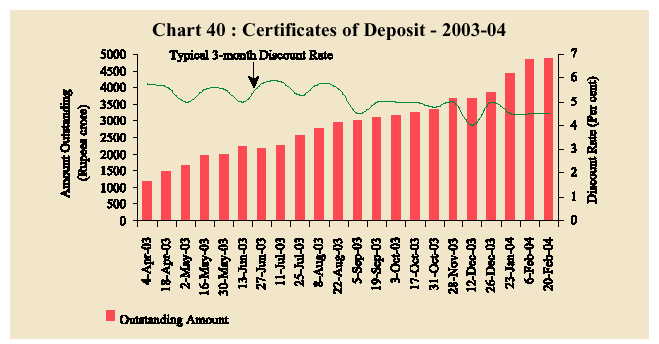
The
outstanding amount of certificates of deposit (CDs) increased from Rs.1,188 crore
in early April 2003 to Rs.4,831 crore by early-March 2004 mainly on account of
issuances by some banks with low deposit bases (Chart 40).
The
rest of the money market segments also witnessed increased activity. The market
for forward rate agreements and interest rate swaps (FRA/IRS) experienced a sharp
expansion during the year with the outstanding amount increasing by about 112
per cent to Rs.5,18,260 crore. The Collateralised Borrowing and Lending Obligation
(CBLO), a money market instrument operationalised through the Clearing Corporation
of Indian Limited (CCIL) since January 20, 2003, recorded an increase in average
daily turnover from Rs.47 crore in April 2003 to Rs. 2,506 crore in March 2004.
This market is expected to see further growth with real-time connectivity between
the Public Debt Office of the Reserve Bank and CCIL in place and value-free transfer
of securities operationalised for CBLO.
Foreign
Exchange Market
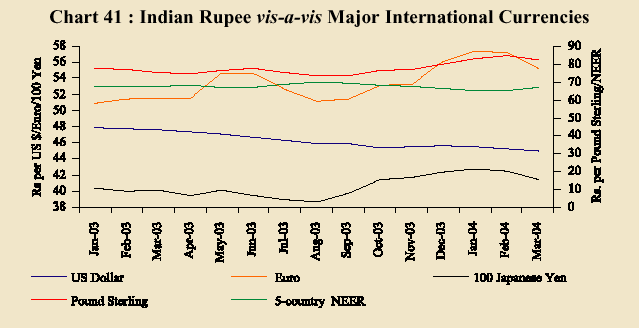
The
foreign exchange market was characterised by persistent conditions of excess supply
during 2003-04 on account of sustained foreign exchange inflows. In spite of rising
demand for imports and large outflows in the capital account due to debt repayments,
the Indian rupee appreciated by 9.3 per cent against the US dollar during the
year. The rupee, however, weakened against other major currencies. Accordingly,
the five-country trade-weight based nominal effective exchange rate (NEER) remained
broadly stable at the March 2003 level (Chart 41). Uncertain market sentiments
were reflected in intra-week volatility in April 2004 despite ample supply conditions.
The rupee depreciated by 2.1 per cent against the US dollar but appreciated by
0.7 per cent against the euro and 3.4 per cent against the yen during the month.
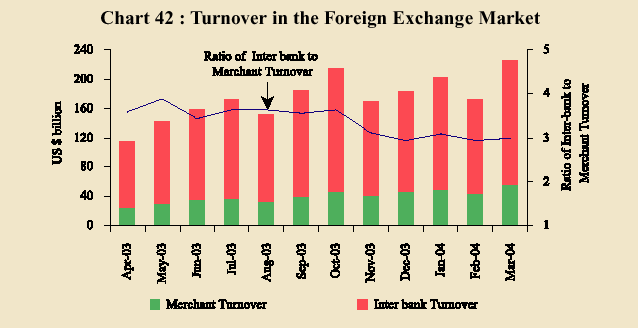
Activity
in both the merchant and inter-bank segment of the foreign exchange market increased
strongly. While the merchant turnover increased from US $ 25 billion in April
2003 to US $ 56.6 billion in March 2004, the inter-bank turnover increased from
US $ 89.4 billion to US $ 168.4 billion during the same period (Chart 42). The
ratio of inter-bank to merchant turnover hovered in the range of 3-4, indicating
normal hedging activity and stability in exchange rate expectations.
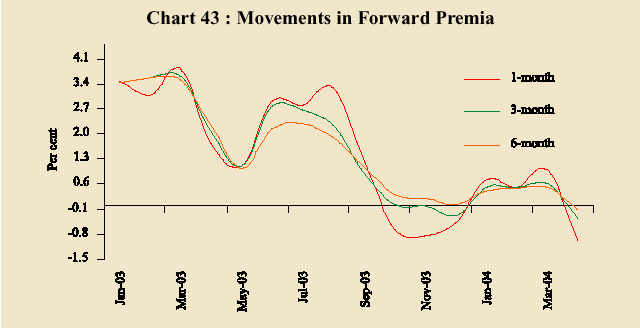
The
rupee's upward drift against the US dollar in the spot exchange market drove banks,
exporters and corporates to book heavy forward US dollar sales. As a result, forward
premia declined sharply over the year turning into discounts on the US dollar
during the period October-December 2003. Forward premia turned positive in January
and February 2004 with the gradual easing of pressure in the cash market. In March
forward premia were generally below one per cent across the maturity spectrum
as against a range of 3.5-3.8 per cent during March 2003. Large capital inflows
pushed down the forward premia again into slender discounts of around one per
cent in April 2004 (Chart 43).
Credit
Market
In view
of easy liquidity conditions and lower market interest rates, public sector banks
(PSBs) reduced deposit rates in the one-year and above tenor from a range of 5.25-7.00
per cent in March 2003 to 5.00-5.75 per cent by April 16, 2004 (Table 18). Deposit
rates of the private and foreign banks also eased but the decline in banks' prime
lending rate (PLR) was relatively muted.
Table
18 : Deposit and Lending Rates
| (Per
cent) |
|
| | | March |
June |
September |
December |
March |
| | |
2003 |
2003 |
2003 |
2003 |
2004# |
| |
1 | 2 |
3 |
4 |
5 |
6 |
|
| 1. |
Domestic Deposit Rate | | | | | |
| | Public
Sector Banks | | | | | |
| | Up to
1 Year | 4.00-6.00 |
4.00-5.75 |
3.75-5.50 |
3.75-5.25 |
3.75-5.25 |
| |
>1-3 Years | 5.25-6.75 |
5.00-6.25 |
4.75-6.00 |
5.00-5.75 |
5.00-5.75 |
| |
>3 Years | 5.50-7.00 |
5.25-6.50 |
5.25-6.25 |
5.25-6.00 |
5.25-6.00 |
| |
Private Sector banks | | | | | |
| | Up to
1 Year | 3.50-7.50 |
3.00-7.00 |
3.00-7.00 |
3.00-6.25 |
3.00-6.00 |
| |
>1-3 Years | 6.00-8.00 |
5.50-7.75 |
5.50-7.50 |
5.00-7.00 |
5.00-6.50 |
| |
>3 Years | 6.00-8.00 |
6.00-8.00 |
5.75-8.00 |
5.50-7.00 |
5.25-7.00 |
| |
Foreign banks | | | | | |
| | Up to
1 Year | 3.00-7.75 |
3.00-7.75 |
3.00-7.75 |
2.75-7.75 |
2.75-7.75 |
| |
>1-3 Years | 4.15-8.00 |
3.50-8.00 |
3.50-8.00 |
3.35-8.00 |
3.30-8.00 |
| |
>3 Years | 5.00-9.00 |
4.50-8.00 |
3.75-8.00 |
3.50-8.00 |
3.25 – 8.00 |
|
2. | Prime
Lending Rate# | | | | | |
| | Public
sector Banks | 9.00-12.25 |
9.00-12.25 |
9.00-12.25 |
9.00-12.25 |
10.25-11.50 |
| |
Private Sector Banks |
7.00-15.50 | 7.00-15.50 |
8.00-15.50 |
7.50-15.50 |
10.50-13.00 |
| |
Foreign Banks | 6.75-17.50 |
5.45-17.50 |
4.80-17.50 |
4.55-17.50 |
11.00-14.85 |
|
3. | Actual
Lending Rates* | | | | | |
| | Public
sector Banks | 6.00-16.25 |
5.00-16.00 |
5.75-16.00 |
5.75-16.00 |
NA |
| |
Private Sector Banks |
5.18-23.00 |
4.95-23.00 |
3.00-23.00 |
3.00-23.00 |
NA |
| |
Foreign Banks | 5.40-20.00 |
5.00-23.00 |
5.00-22.00 |
3.00-22.00 |
NA |
|
| *Interest
rate on non-export demand and term loans above Rs.2 lakh excluding lending rates
at the extreme 5 per cent on both sides. #Benchmark PLR/ PLR for March 2004. |
Sub-PLR lending
of the banking system (excluding exports, the bulk of which is at sub-PLR) constituted
about half of the total outstanding advances above Rs.2 lakh. The spreads around
PLRs of PSBs for term loans (excluding 5 per cent of the credit sanctioned at
extreme rates on either side of lending) narrowed marginally during September-December
2003.
During the period March 2003 and March 2004, the range
of benchmark PLRs (BPLR) at their upper limits was moderated by 75-265 basis points
from the existing PLRs, partly as a result of the introduction of the benchmark
concept. As per the information available, nearly all banks have adopted BPLRs
on April 1, 2004 by abandoning the system of tenor linked PLR. During January
to March 2004, the range of BPLRs was 10.25-14.85 per cent. The level of BPLRs
continued unchanged in April 2004.
Food credit extended
by the banking system declined in consonance with lower procurement. Non-food
credit picked up in the second half of 2003-04, driven up by credit to the priority
sector, retail credit and export credit. The main driver of credit within the
priority sector were ‘other priority sectors’ and agricultural credit. Credit
to housing picked up in 2003-04 primarily on account of policy incentives and
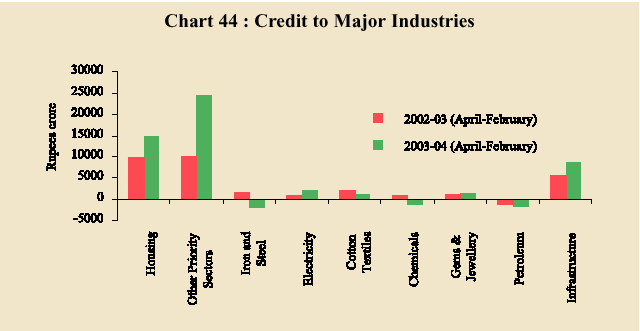
lower interest rates. Credit to medium and large industry and wholesale trade
recorded lower growth (Table 19).
Table
19 : Deployment of Bank Credit
| (Rupees
crore) |
|
| Sector/Industry |
Variations |
| | | 2002-03 | |
2003-04 | |
| | | Up
to February | Up
to February |
| | |
Absolute |
Per cent |
Absolute |
Per cent |
|
1 | |
2 |
3 |
4 |
5 |
|
| 1 |
Priority sector# | 19,548 |
11.2 | 39,076 |
18.5 |
| |
Agriculture | 7,424 |
12.2 | 11,001 |
15.0 |
| |
Small Scale | 2,119 |
3.7 | 3,500 |
5.8 |
| |
Others | 10,005 |
17.5 | 24,575 |
31.6 |
|
2 | Industry
(Medium and Large) | 22,070 |
12.8 | 6,807 |
2.9 |
| |
Iron and Steel | 1,479 |
7.4 | -1,896 |
-6.8 |
| |
Electricity | 1,008 |
10.8 | 2,057 |
18.4 |
| |
Cotton Textiles | 2,072 |
17.6 | 1,040 |
6.6 |
| |
Chemicals, Dye, Paints |
839 | 3.2 |
-1,175 |
-3.7 |
| |
Gems and Jewellery | 1,219 |
18.9 | 1,378 |
18.3 |
| |
Petroleum | -1,331 |
-11.8 |
-1,648 |
-11.2 |
| |
Infrastructure | 5,466 |
36.9 | 8,731 |
33.2 |
|
3 | Housing |
9,974 |
44.6 | 14,774 |
40.4 |
|
4 | Non-Banking
Financial Companies | 2,914 |
30.2 | 625 |
4.4 |
|
5 | Wholesale
Trade | 2,192 |
10.7 | 1,132 |
5.0 |
|
6 | Export
Credit | 3,710 |
8.6 | 6,236 |
12.7 |
|
| # Excluding
investments in eligible securities. Note: Data are provisional and
relate to select scheduled commercial banks which account for about
90 per
cent of bank credit of all scheduled commercial banks. |
Petroleum, chemicals and iron and steel industries recorded
a decline in bank credit demand. On the other hand, gems and jewellery and infrastructure
recorded a healthy growth in credit off-take (Chart 44). The decline in overall
credit to industry during April 2003 to February 2004 can be attributed, inter
alia, to an increased recourse by corporates to internal sources of financing
enabled by higher profits as well as surge in debt issues in the private placement
market and higher external commercial borrowings.
Operational
and prudential indicators for the banking system point to a growing resilience.
Commercial bank profitability continued to increase during 2003-04. Both gross
NPA to gross advances and net NPA to net advances ratios were lower during the
first half of 2003-04 than in the corresponding period of 2002-03 (Table 20).
By end-September 2003, banks had recovered Rs. 769 crore from 13,583 cases out
of an aggregate amount outstanding of Rs.14,141 crore in 42,047 cases.
Table
20 : Important Parameters of Scheduled Commercial Banks
| |
(per cent) |
|
| Parameter |
March 2003 |
April-September # |
| | | 2003-04 |
2002-03 |
|
1 | 2 |
3 |
4 |
|
| Operating Expenses/Total Assets |
2.2 | 1.1 |
1.1 |
|
Spread/Total Assets |
2.8 | 1.5 |
1.5 |
|
Net Profits/Total Assets |
1.0 | 0.6 |
0.5 |
|
Gross Non-Performing Assets to Gross Advances |
8.8 | 9.7 |
11.1 |
|
Net Non-Performing Assets to Net Advances |
4.4 | 4.0 |
5.5 |
|
CRAR | 12.6 |
13.2 | 12.5 |
| #Data relate to domestic operations
only. | | | |
|
Government
Securities Market
Average
monthly volumes of secondary market transactions in Government securities through
the subsidiary general ledger (SGL) increased sharply to Rs.2,19,991 crore during
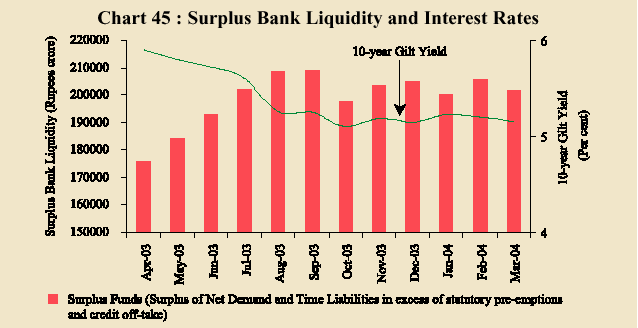
2003-04 as against Rs.1,61,804 crore during 2002-03. Ample liquidity conditions
enabled reduction in yields in the Government securities market during the first
half of 2003-04. As non-food credit off-take began to recover, market sentiment
limited the softening of the yields during the second half of the year (Chart
45).
Liquidity
conditions facilitated a smooth completion of the borrowing programme of the Central
Government, which was truncated by a persistent cash surplus in its current account
since August 8, 2003. The weighted average cost of market borrowing through issuances
of dated securities declined to 5.74 per cent during 2003-04 from 7.34 per cent
in 2002-03. The weighted average maturity increased to 14.94 years from 13.83
years. The first ever buy-back auction through an interactive platform developed
by CCIL enabled the market to return 19 high coupon but relatively illiquid Government
securities amounting to a total face value of Rs.14,434 crore in exchange for
four liquid securities involving a buy back premium of Rs.3,472 crore paid by
the Government. There were three issuances of Floating Rate Bonds aggregating
Rs.16,000 crore.
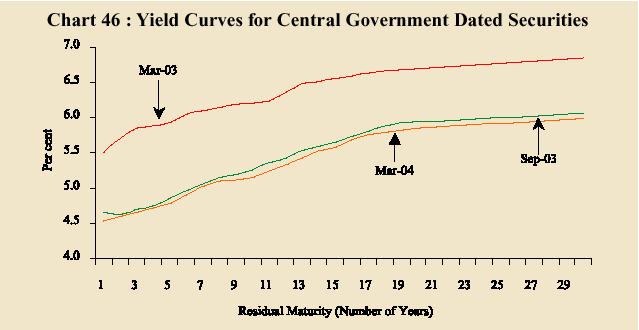
The yield curve flattened in the secondary
market for Government securities during the first half of 2003-04. Despite intermittent
price rallies under easy liquidity conditions, gains were capped as the market
borrowing programme of the Government intensified and open market sales were conducted.
The repo rate reduction, effective August 25, 2003, boosted market sentiment with
the 10-year yield declining to 5.23 per cent on August 26, 2003. The announcement
of the calendar of issuance of Government securities for the second half of 2003-04
was much lower than the anticipated amount. Market sentiment lifted, leading to
a fall in yields across short to medium-tenor securities at the end of the second
quarter of 2003-04 (Chart 46).
In
the second half of 2003-04, inflation expectations hardened at the long end of
the maturity spectrum. The lowering of cut-off yields on 364-day Treasury Bills
drove down the 10-year yield on Government securities to a low of 4.95 per cent
on October 16, 2003. Open Market Operation (OMO) sales and a series of 28-day
repos under the LAF in the second fortnight of October checked possible rallies.
As portfolio switches occurred, the outright transactions in Central Government
securities, which had moved up from Rs.1,13,402 crore in April 2003 to Rs.1,94,984
crore in August 2003, decreased to Rs.90,810 crore in January 2004. With liquidity
at high levels, yields inched down in March 2004. During the year, the 10-year
yield declined by 106 basis points from 6.21 per cent at the end of March 2003
to 5.15 per cent at the end of March 2004. Yields moved up for securities
of tenor of 14 year and above by around 13 basis points on an average and by seven
basis points for tenors between four year and 10 year. The larger than expected
drop in inflation boosted demand for securities at the longer end causing the
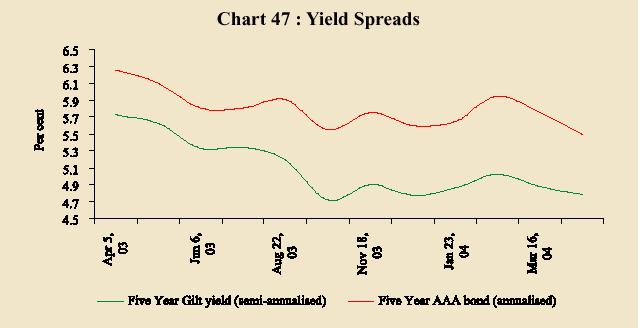
yield curve to flatten in March 2004. Yield spreads between Government securities
and AAA-rated corporate bonds widened marginally during the latter half of the
year (Chart 47).
The
Government securities market remained bullish in April 2004 amidst ample liquidity
conditions with the 10-year yield hovering around 5.14 per cent at the end of
the month. The yield curve flattened as the supply of securities increased at
the short end while excess demand prevailed at the long end.
Equity
Market
The stock
markets broke out of the subdued conditions prevailing since February 2000 in
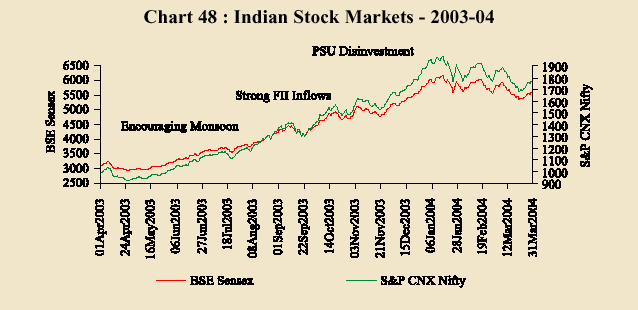
a sustained upturn from the end of May 2003. The BSE Sensex crossed the 6100 mark
in January 2004 in a strong rally (Chart 48). The BSE Sensex had crossed
the 6000 mark only once before in intra-day trading during February 2000. Intermittent
bouts of correction occured since February 2004. Notwithstanding the correction
on profit booking at higher levels, the underlying macroeconomic fundamentals
continued to be strong. The average BSE-Sensex during April 2004 worked out to
5809.
The
increase in stock prices was accompanied by a rise in market capitalisation, turnover
and volatility (Table 21).
Table
21: Stock Market Indicators
|
| |
2003-04 |
2002-03 |
2003-04 |
2002-03 |
|
1 | 2 |
3 |
4 |
5 |
|
| Average BSE Sensex/ S&P
CNX Nifty | 4492.19 |
3206.29 |
1427.50 |
1037.23 |
|
Volatility (Coefficient of Variation) (Per cent) |
22.95 |
4.85 | 23.30 |
5.17 |
|
Turnover (Rupees crore) |
5,02,618 |
3,14,073 |
10,99,535 |
6,17,988 |
|
Market Capitalisation (end-period) (Rupees crore) |
12,01,207 |
5,72,197 |
11,20,976 |
5,37,133 |
|
| Source:
The Stock Exchange, Mumbai (BSE) and National Stock Exchange (NSE). |
The rally in 2003-04
was stronger and more broad-based than in 1999-2000. It was supported by an improvement
in underlying fundamentals, strong corporate performance, a robust appetite of
Foreign Institutional Investors (FIIs) for Indian equity and debt instruments
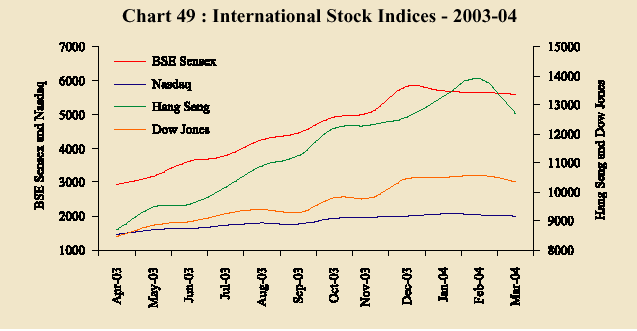
as well as sector-specific factors. The revival of the stock market in India was
coincident with a return of buoyancy to equity markets worldwide (Chart 49).
Foreign
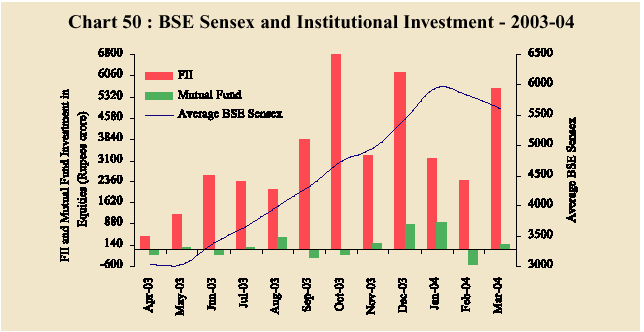
Institutional Investors (FIIs) made net investments in equity amounting to Rs.39,959
crore during 2003-04 as compared with Rs.2,528 crore during 2002-03 (Chart 50).
Notably, mutual funds made net investments in equity amounting to Rs.1,308 crore
during 2003-04 as compared with net sales of Rs.2,067 crore in 2002-03.
The
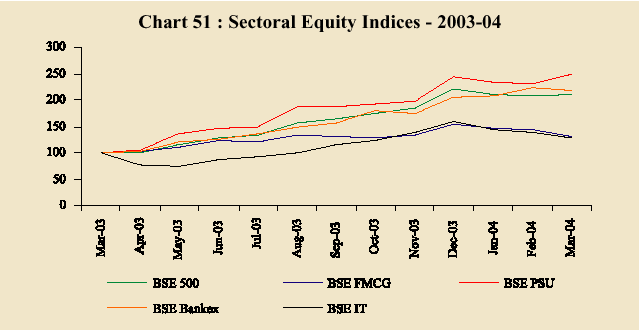
rally in the stock market was broad-based with the BSE 500 index registering an
increase of 109.4 per cent during 2003-04 as against a decline of 8.0 per cent
during the preceeding year. Technology, banking, fast moving consumer goods (FMCG)
stocks contributed to the rally (Chart 51).
The
derivative segment continued to expand with the total turnover on the NSE derivatives
segment rising nearly five-fold to Rs.21,30,612 crore during 2003-04 from Rs.4,39,863
crore during 2002-03. The cash segment turnover recorded an increase, but this
was modest in comparison with the derivatives market (Chart 52). In addition to
stock futures and options and index futures and options, interest rate futures
were introduced on the NSE, effective June 2003.
Primary
Market
After a long
period of lacklustre activity, the public issues market experienced a revival.
Resource mobilisation in the public issues market (excluding offers for sale)
amounted to Rs.7,190 crore through 35 issues during 2003-04, as against only Rs.4,867
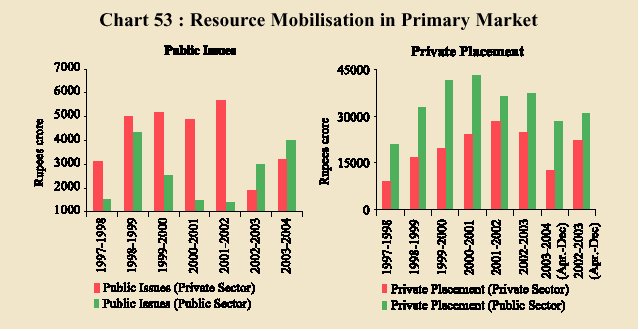
crore raised through 17 issues during 2002-03 (Chart 53). Out of the issues floated
in 2003-04, 28 were equity issues accounting for 40.5 per cent of resource mobilisation.
Public sector entities accounted for 55.4 per cent of total resources mobilised
in the primary market.
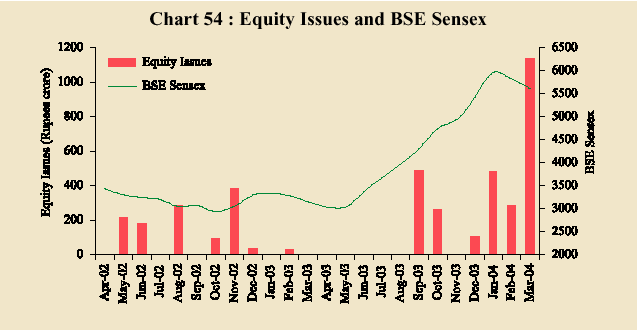
Non-Government
public limited companies (private sector) garnered Rs.3,210 crore through 27 issues
during 2003-04 as compared with Rs.1,878 crore raised through nine issues during
the previous year. In 2003-04, 24 equity issues aggregated to Rs.1,959 crore as
compared with five equity issues aggregating Rs.460 crore during the previous
year. Equity issances surged during the second half of 2003-04 (Chart 54). There
were three debt issues of Rs.1,251 crore (all from ICICI Bank) during 2003-04
as compared with four bond issues of Rs.1,418 crore during 2002-03.
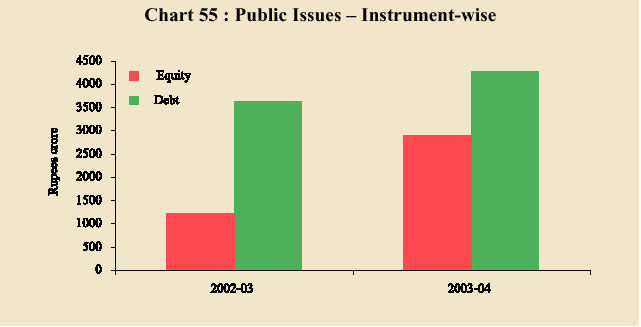
Public
sector entities mobilised Rs.3,980 crore through eight issues during 2003-04 as
compared with Rs.2,989 crore raised through eight issues during the previous year.
Four public sector banks floated equity issues aggregating Rs.950 crore during
2003-04. All-India Financial Institutions floated three bond issues of Rs.2,930
crore (all from IDBI) during 2003-04 as compared with five bond issues aggregating
Rs.2,216 crore during the previous year (Chart 55).
Resource
mobilisation through private placement aggregated Rs.41,070 crore during April-December
2003, down from Rs.53,308 crore mobilised during the corresponding period of the
previous year (see Chart 53). 131 entities entered the market in 2003-04 with
669 floatations as compared with 148 entities with 912 floatations during the
corresponding period of the preceeding year. All the issues in the private placement
market were debt issues excepting one equity issue. The public sector entities
(mainly financial intermediaries) dominated the private placement market; however,
resource mobilisation by these entities decreased marginally to Rs.28,372 crore.
Public sector entities accounted for 69.0 per cent of total resource mobilisation
in the private placement market as compared with 58.2 per cent in the corresponding
period of the previous year.
A
total of eighteen issues aggregating Rs.3,098 crore (US$ 666 million) were floated
in the Euro issues market during 2003-04 as compared with eleven issues aggregating
Rs.3,426 crore (US$ 711 million) during the previous year. GDR issuances recorded
a sharp decline.
The
resource mobilisation by mutual funds (net of redemptions) amounted to Rs.46,808
crore during 2003-04, a sharp increase of 1015.5 per cent over the preceding year.
UTI recorded a net inflow of Rs.1,667 crore during 2003-04 as compared with a
net outflow of Rs.9,434 crore during the previous year. The resources mobilised
by private sector mutual funds increased to Rs.42,545 crore (Rs.12,069 crore in
2002-03). Public sector mutual funds mobilised Rs.2,597 crore (Rs.1,561 crore
in 2002-03).
Financial
assistance sanctioned and disbursed by All-India Financial Institutions increased
sharply during 2003-04 to Rs.52,924 crore and Rs.31,457 crore, respectively, after
a gap of more than two years.