Global
Inflation Environment
Inflation
Conditions in India
Components
of Inflation
Consumer
Price Inflation
Asset Prices and Inflation
Inflation
in India went through episodes of pressures before edging down in the last quarter
of 2003-04. Globally, inflation remained subdued in several parts of the world.
Downside risks of deflation receded during the year. Prices of basic and intermediate
materials firmed up in association with signs of recovery in economic activity
and the persistent hardening of international crude oil prices.
Global
Inflation Environment
Inflation remained low in 2003, although inflationary expectations began to edge
up in the second half of the year as signs of recovery became stronger and widespread.
Monetary policy remained accommodative in various parts of the world in support
of economic recovery, albeit with a growing recognition that some reversal
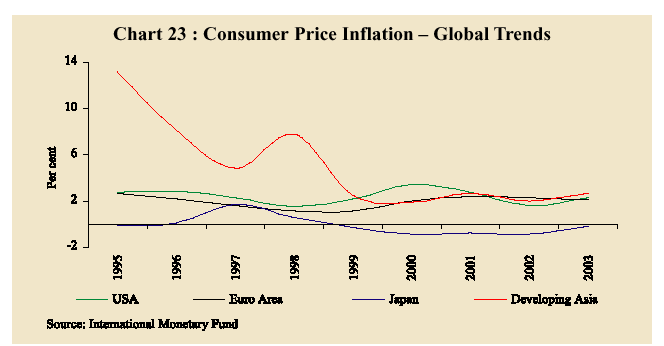
could be necessary in the future. In the developed countries, inflation
stayed below two per cent for the second year in succession while remaining close
to six per cent in developing economies. In the US, headline consumer inflation
fell to 1.7 per cent in March 2004 as the slack in resource utilisation remained
substantial and productivity gains led to a decline in unit labour costs. In the
United Kingdom, inflation remained well below the Bank of England’s target of
2.0 per cent, although muted pressures from incipient demand growth led
to a pre-emptive tightening of monetary policy. In the euro area, inflation
stayed close to the European Central Bank’s target of 2.0 per cent with pressures
emanating from higher oil and food prices offset by the appreciation of the euro.
Japan continued to experience deflation during 2003 although recovery in real
GDP growth became stronger in the second half of the year.
In developing
Asia, domestic demand picked up but did not translate into inflationary pressures
(Chart 23). In China, consumer prices rose moderately on account of higher prices
of food, farm products and metals. Countries in Africa and the Western Hemisphere,
on the other hand, continued to face relatively high inflation risks.
International
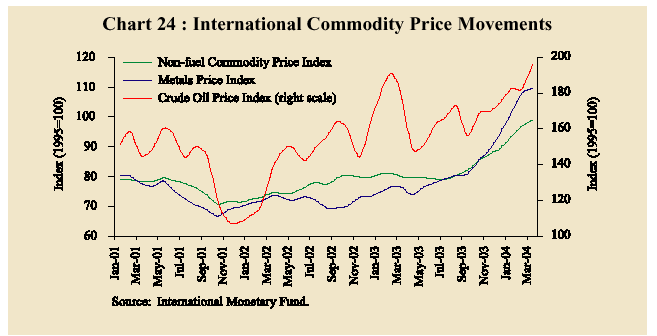
commodity prices surged in 2003 (Chart 24). Crude oil prices hardened from 2002
levels due to slower than expected resumption of oil production in Iraq, pick-up
in economic activity, low levels of inventory in industrial countries and further
cuts in production by the Organisation of Petroleum Exporting Countries (OPEC).
Non-fuel commodity prices also rose sharply, mainly reflecting increased Chinese
demand for metals and cotton, crop failures as well as the depreciation of the
US dollar - the currency in which commodity prices are generally invoiced. The
large increases in commodity prices were not transmitted into consumer prices
in industrial countries but appear to have been absorbed in firms’ profit
margins, as commodity costs represent only a small share of overall costs in these
economies.
Inflation
Conditions in India
Headline
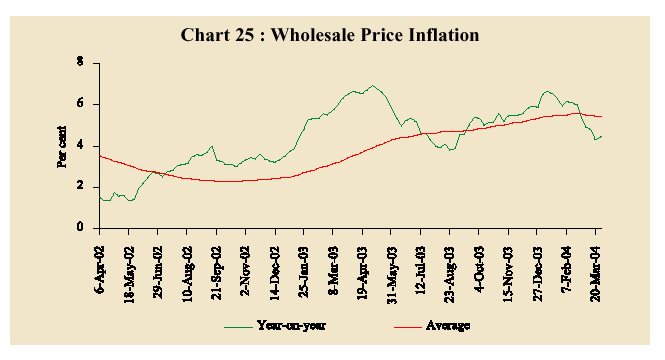
inflation, measured by year-on-year (y-o-y) changes in the wholesale price index
(WPI), peaked at 6.9 per cent in the first week of May 2003 as transport disruptions
and an upward revision in electricity prices dispelled the effect of downward
revisions in petroleum, oil and lubricants (POL) prices. Inflation receded thereafter
to a trough of 3.8 per cent on August 23, 2003 driven down by declines in the
prices of mineral oils, fruits, oil seeds, oil cakes and chemicals. Incipient
inflationary pressures began to emerge from prices of iron and steel, vegetables,
sugar and administered coal. Over the subsequent weeks, inflation rose to 6.6
per cent by January 10, 2004 due to hardening prices of mineral oils, cotton textiles,
iron and steel and fruits. About a fifth of this rise in inflation was due to
successive hikes in domestic petrol and diesel prices on December 16, 2003 and
January 1, 2004. With the delayed seasonal fall in vegetable prices, a decline
in prices of eggs and poultry chicken on fears of avian influenza and base
effects of oil price hikes in February and March 2003, inflation decelerated to
4.5 per cent by end-March 2004. The year-on-year WPI inflation eased further to
4.3 per cent by April 24, 2004.
Rising prices of iron and steel, cotton textiles and international crude prices
posed inflation concerns in the second half of the year. Sugar prices rose in
the last quarter, reflecting lower domestic sugarcane production in the western
belt due to persistent drought conditions as well as upward revisions in the statutory
minimum prices for sugarcane. Annual WPI inflation, excluding the administered
and partially decontrolled items (electricity, coal mining, mineral oils and urea-N-content),
stood at 5.1 per cent in 2003-04, on a point-to-point basis, as compared with
the headline rate of 4.5 per cent. On an annual average basis, WPI inflation was
5.4 per cent in 2003-04 as compared with 3.4 per cent a year ago (Chart 25).
Components
of Inflation
The
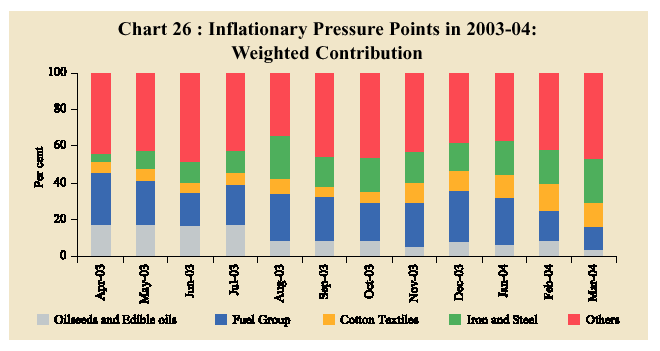
key movers of headline inflation in 2003-04 were iron and steel, cotton textiles,
fuel group, sugar and milk. These items, which have a weight of 30 per
cent in the overall WPI index, accounted for 66 per cent of the headline inflation
(Chart 26).
Domestic
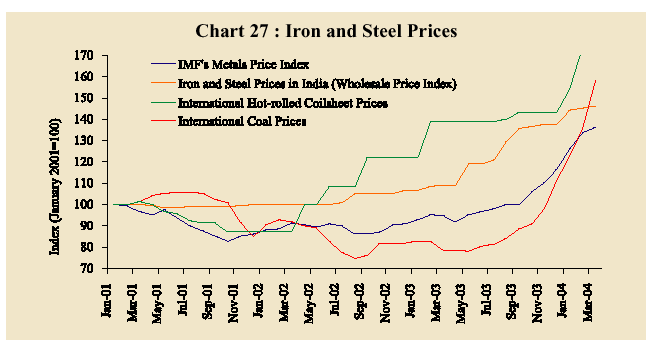
iron and steel prices increased by 34.2 per cent in 2003-04 and contributed almost
a fourth of headline inflation. This was associated with the improvement
in industrial activity and exports. It also reflected the movements in international
prices which were driven up by increased Chinese demand for metals and rising
input costs (Chart 27). During the last quarter of 2003-04, fiscal measures comprising
cuts in customs and excise duties on inputs as well as finished products supported
by freezing of benefits under the Duty Entitlement Pass Book and duty drawback
schemes also helped in reining in inflationary pressures.
The
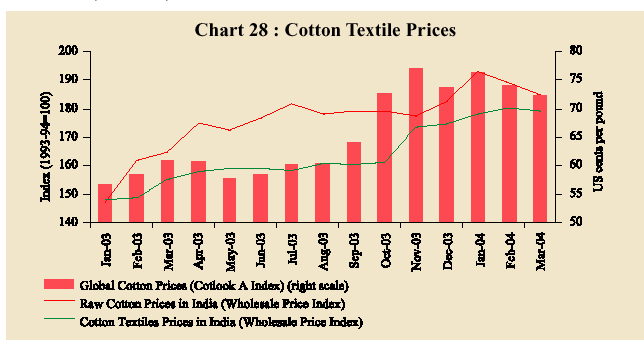
increase in cotton textile prices was mainly on account of the rise in domestic
raw cotton prices. Despite a satisfactory domestic cotton crop, raw cotton prices
remained firm in consonance with international price movements. Global cotton
prices increased during 2003, mainly reflecting higher Chinese demand and low
stocks (Chart 28).
Domestic
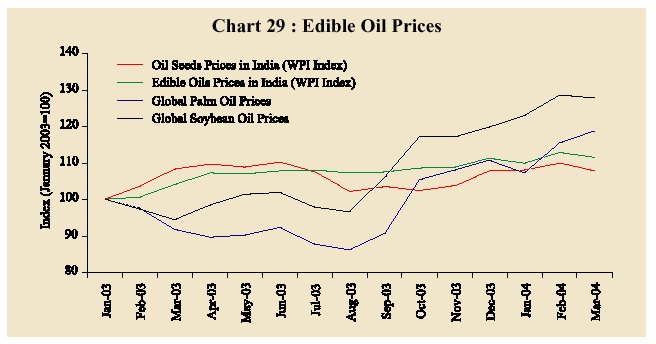
oilseeds prices were largely unchanged from their end-March 2003 level, reflecting
a rebound in domestic oilseeds production. The prices of edible oils were, however,
held up by import costs due to depleting Malaysian palm oil stocks and shortfalls
in the production of soybean in the US (Chart 29).
The
manufactured products group contributed 78.7 per cent to inflation in 2003-04
as compared with 44.3 per cent during 2002-03 (Table 14). This was primarily due
to the spurt in global commodity prices, given the near exhaustion of excess capacities
in major industries alongside the revival in economic activity.
Table
14 : WPI Inflation Rate (Year-on-year)
| (Per
cent) |
|
| | |
Inflation Rate | |
Weighted Contribution |
| Commodity |
Weight |
2001- |
2002- |
2003- |
2001- |
2002- |
2003- |
| | | | |
02 |
03 |
04P |
02 |
03 |
04P |
|
1 | 2 |
3 |
4 |
5 |
6 |
7 |
8 |
|
| | All
Commodities | 100.0 |
1.6 |
6.5 |
4.5 |
100.0 |
100.0 |
100.0 |
|
1. |
Primary Articles |
22.0 |
3.9 |
6.1 |
1.7 |
53.4 |
21.6 |
8.6 |
| |
Food Articles | 15.4 |
5.2 | 0.8 |
0.7 | 51.5 |
2.2 | 2.4 |
| | i. |
Cereals | 4.4 |
0.8 | 4.0 |
-0.2 | 2.4 |
2.9 | -0.2 |
| | ii. |
Pulses | 0.6 |
-3.3 | 0.3 |
-2.8 | -1.4 |
0.0 | -0.4 |
| | iii. |
Vegetables | 1.5 |
23.4 | -15.7 |
8.0 | 14.8 |
-3.0 | 1.8 |
| | iv. |
Fruits | 1.5 |
9.5 | 7.6 |
-7.1 | 11.2 |
2.4 | -3.3 |
| | v. |
Milk | 4.4 |
4.7 | 0.6 |
7.5 | 12.9 |
0.5 | 7.3 |
| | vi. |
Eggs, Fish and Meat |
2.2 | 9.3 |
-4.0 | -6.3 |
14.3 | -1.7 |
-3.4 |
| |
Non-Food Articles | 6.1 |
0.6 | 22.1 |
4.3 | 2.1 |
19.3 | 6.2 |
| | i. |
Raw Cotton | 1.4 |
-21.3 |
34.3 | 12.3 |
-17.3 |
5.4 | 3.6 |
| | ii. |
Oilseeds | 2.7 |
6.8 | 30.0 |
-0.5 | 9.0 |
10.6 | -0.3 |
| | iii. |
Sugarcane | 1.3 |
6.2 | 11.5 |
6.5 | 5.7 | 2.8 | 2.4 |
| 2. |
Fuel, Power, Light and Lubricants |
14.2 |
3.9 |
10.8 |
2.7 |
47.1 |
33.9 |
12.7 |
| |
i. | Mineral
Oils | 7.0 |
1.2 | 18.4 |
0.2 | 7.8 |
29.7 | 0.5 |
| | ii. |
Electricity | 5.5 |
9.2 | 3.4 |
4.9 | 41.3 |
4.2 | 8.4 |
| | iii. |
Coal Mining | 1.8 |
-1.9 | 0.0 |
9.2 | -2.4 |
0.0 | 3.8 |
| 3. |
Manufactured Products |
63.7 |
0.0 |
5.1 |
6.3 |
0.0 |
44.3 |
78.7 |
| |
i. | Food
Products | 11.5 |
0.3 | 8.7 |
9.2 | 1.8 |
14.0 | 21.7 |
| | | Sugar |
3.6 | -3.8 |
-15.0 |
16.8 | -7.4 |
-7.0 | 9.0 |
| | | Edible
Oils | 2.8 |
12.5 | 27.4 |
7.1 | 14.0 |
8.5 | 3.8 |
| | | Oil
Cakes | 1.4 |
15.0 | 40.3 |
-1.0 | 11.5 |
8.8 | -0.4 |
| | ii. |
Cotton Textiles | 4.2 |
-6.7 | 8.3 |
15.3 | -16.7 |
4.8 | 13.0 |
| | iii. |
Man-made Fibre | 4.4 |
-5.0 | 17.4 |
-1.0 | -7.1 |
5.8 | -0.5 |
| | iv. |
Leather and Leather Products |
1.0 | -8.2 |
-1.1 | 15.1 |
-4.6 | -0.1 |
2.6 |
| |
v. | Rubber
and Plastic Products | 2.4 |
0.8 | 6.0 |
1.5 | 0.9 |
1.7 | 0.6 |
| | vi. |
Chemicals and Chemical Products |
11.9 | 2.5 |
4.2 | 0.1 |
19.3 | 8.2 |
0.3 |
| | |
Fertilisers | 3.7 |
3.6 | 2.1 |
-0.1 | 8.1 |
1.2 | -0.1 |
|
vii. |
Basic Metals, Alloys and Metal Products |
8.3 | -0.9 |
6.6 | 20.3 |
-4.2 | 7.3 |
32.8 |
| |
Iron and Steel |
3.6 | 0.0 |
9.2 | 34.2 |
0.0 | 4.4 |
24.3 |
| |
viii. | Non-Metallic
Mineral Products | 2.5 |
-2.8 | 3.3 |
3.0 | -4.0 |
1.1 | 1.4 |
| | | Cement |
1.7 | -4.7 |
1.1 | 1.3 |
-4.7 | 0.3 |
0.4 |
| |
ix. | Machinery
and Machine Tools | 8.4 |
2.0 | 0.5 |
3.0 | 8.0 |
0.5 | 4.2 |
| | | Non-Electrical
Machinery and Parts | 3.4 |
5.4 | 2.5 |
3.4 | 10.4 |
1.2 | 2.4 |
| | | Electrical
Machinery | 5.0 |
-1.1 | -1.3 |
2.6 | -2.5 |
-0.7 | 1.9 |
| | x. |
Transport Equipment and Parts |
4.3 | 1.3 |
-0.9 | 1.2 |
3.1 | -0.6 |
0.9 |
|
| PProvisional. |
Domestic mineral
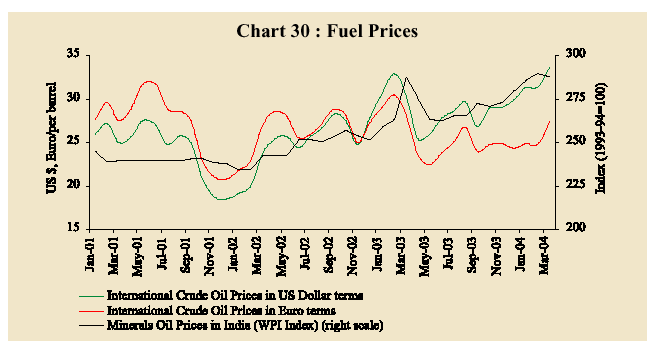
oil prices largely mirrored movements in international crude prices in 2003-04
with some cushion provided by the appreciation of the rupee against the US dollar.
In the last quarter of 2003-04, however, domestic diesel and petrol prices remained
largely unchanged even as international crude prices hardened due to depleting
inventories in advanced economies, geopolitical uncertainties and concerns about
production cut decisions by the OPEC.
International average
crude oil prices increased by 5.6 per cent to US $ 29.1 per barrel in 2003-04,
ruling well above the upper ceiling of the OPEC band (Chart 30).
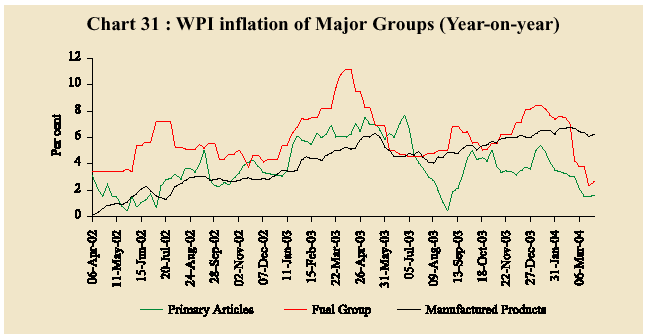
The
strong rebound in agricultural production in 2003-04 generally dampened inflationary
pressures in primary commodities (Chart 31). Vegetable prices, however, increased
due to the impact of localised droughts in various parts of the country.
Consumer
Price Inflation
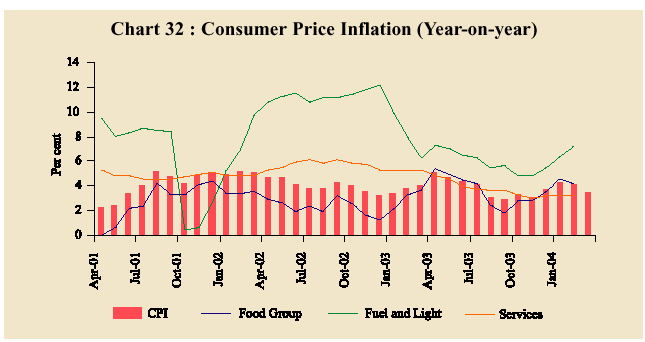
Retail
price inflation, measured by y-o-y variation in the consumer price index for industrial
workers (CPI-IW), decelerated to 3.5 per cent in 2003-04 from 4.1 per cent a year
ago. On an annual average basis also, CPI inflation at 3.9 per cent in 2003-04
was lower than 4.0 per cent in the previous year (Chart 32).
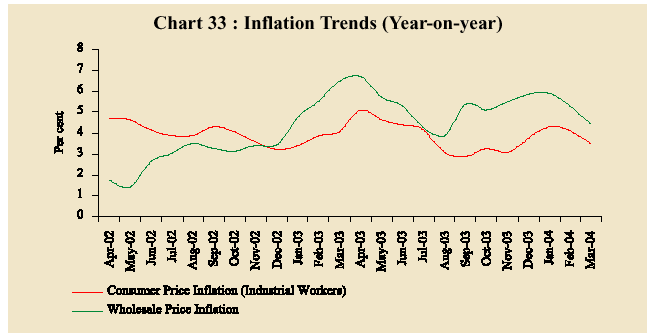
In
contrast to WPI inflation, retail price inflation remained benign during 2003-04,
reflecting the almost negligible weightage of iron and steel and lower weightage
of fuel items - the two key movers of WPI inflation - in the CPI basket (Chart
33).
Asset
Prices and Inflation
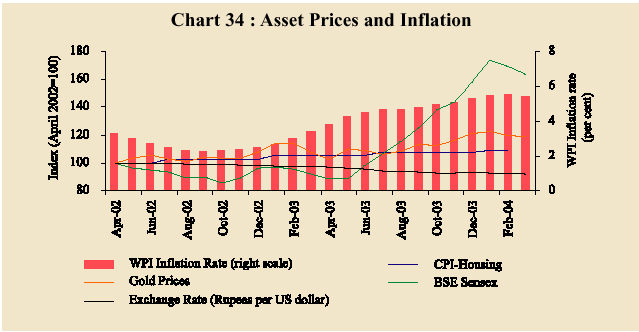
Asset
prices contain information on how markets assess the benefits and risks of future
macroeconomic developments. These expectations impact the current level of interest
rates. Thus, asset prices provide a mechanism for a forward-looking monetary policy
to be transmitted through financial markets to the real sector. Housing prices,
exchange rates, stock prices and even prices of bullion have been identified as
forming part of this transmission mechanism by generating wealth and competitiveness
effects. Asset prices also affect balance sheets of banks as well as corporates
and reinforce the credit channel of monetary policy transmission. During 2003-04,
movements in equity and gold prices in India indicated a firming up of inflation
expectations, partly offset by exchange rate appreciation and relatively stable
housing prices (Chart 34).
Outlook
Inflation
remains low and stable worldwide. Deflation risks have receded with the strengthening
of global recovery and a number of commodity prices have risen in recent months.
Indeed, the outlook is now fraught with the upward risk emanating from commodity
markets, although there are also prospects of commodity prices levelling off in
the medium term. Considerable uncertainty surrounds the prospects of international
crude oil prices. The depreciation of the US dollar could be indicative of incipient
inflation, however benign it may be in the current phase of the business cycle.
Prices of key agricultural commodities will depend upon weather conditions.
In
India, as domestic economic activity strengthens, inflation is likely to respond,
with specific demand-supply conditions in key movers – iron and steel, cotton
and fuel – dominating intra-year movements. A potential inflexion in inflation
ahead would be triggered by the timing of adjustments in the prices of administered
items, as also the possibility of a further spurt in global commodity prices.