Monetary Trends
Credit
Behaviour
Reserve Money
Liquidity Adjustment
Facility
Monetary
Trends Monetary conditions continued
to ease during 2003-04. Reserve money expansion was higher than in 2002-03 even
though large and persistent capital inflows were substantially sterilised by outright
open market operations (OMOs) and repos under the Liquidity Adjustment Facility
(LAF). Overall monetary expansion was also higher than in the preceding year,
albeit in consonance with higher output growth. Money supply accelerated
to 15.3 per cent as on April 16, 2004 from 13.3 per cent as on April 18, 2003.
In terms of the residency-based broad money (NM3),which, inter alia, excludes
the impact of the redemption of Resurgent India Bonds (RIBs) during the year,
monetary expansion was even higher. Non-food credit started picking up from August
2003 onwards with the firming up of industrial activity and consumer demand. Liquidity
in the financial system continued to be ample, even as substitution occurred between
time deposits in the banking system and small savings. As a consequence, the liquidity
aggregates(L1,L2,L3) recorded a higher order of expansion in 2003-04 (Table 10). Table
10 : Monetary Indicators
| (Amount
in Rupees crore) |
|
| Item | |
Outstanding | |
Variation | |
| | | |
as on March |
2002-03 |
2003-04 | | | | |
31, 2004 |
Absolute |
Per cent |
Absolute |
Per cent | | |
1 | |
2 |
3 |
4 |
5 |
6 |
|
| I. |
Reserve Money | 4,36,429 |
31,091 |
9.2 | 67,368 |
18.3 | |
II. | | |
20,00,349 |
1,91,177 |
12.8 | 2,81,147 |
16.4 | | |
Broad Money (M3) | | | | | |
| | a. |
Currency with the Public |
3,16,758 |
30,587 |
12.7 | 45,376 |
16.7 | | |
b. | Aggregate
Deposits | 16,78,550 |
1,60,197 |
12.8 | 2,33,972 |
16.2 | | | |
i. Demand Deposits | 2,51,371 |
18,591 |
10.4 | 53,581 |
27.1 | | | |
ii. Time Deposits | 14,27,179 |
1,41,606 |
13.2 | 1,80,391 |
14.5 | | | |
Of which:
Non-Resident Foreign | | | | | |
| | | Currency
Deposits | 75,419 |
1,421 |
1.6 | -16,852
@ | -18.3
@ | | III. |
NM | 3 |
19,53,960 |
1,95,951 |
13.8 | 3,08,498 |
18.7 | |
IV. | a. | L1 |
20,23,153 |
2,07,300 |
14.2 | 3,22,416 |
19.0 | | | |
Of which :Postal
Deposits | 69,193 |
11,349 |
25.8 | 13,918 |
25.2 | | |
b. | L2 |
20,29,665 |
2,08,455 |
14.2 | 3,22,632 |
18.9 | | | |
Of which :FI
Deposits | 6,512 |
1,155 |
22.5 | 216 |
3.4 | | |
c. | L3 |
20,49,966 |
2,08,604 |
14.0 | 3,23,359 |
18.7 | | | |
Of which :NBFC
Deposits | 20,301 |
148 | 0.8 |
727 | 3.7 |
| V. |
Major Sources of Broad Money | | | | | |
| | a. |
Net Bank Credit to the Government (i+ii) |
7,44,616 |
84,865 |
14.4 | 70,186 |
10.4 | | | |
i. Net Reserve Bank Credit to Government |
47,555 |
-31,499 |
-20.7 |
-73,125 |
-60.6 | | | |
Of which :Centre |
43,806 |
-28,399 |
-20.1 |
-69,179 |
-61.2 | | | |
ii. Other Banks’ Credit to Government |
6,97,061 |
1,16,364 |
26.6 | 1,43,310 |
25.9 | | |
b. | Bank
Credit to Commercial Sector | 10,11,074 |
87,897 |
11.6 | 1,18,986 |
13.3 | | | |
Of which :Scheduled
Commercial Banks’ | | | | | |
| | | Non-food
Credit | 7,99,420 |
99,448 |
18.6 | 1,19,684 |
17.6 | | |
c. | Net
Foreign Exchange Assets of the | | | | | |
| | | Banking
Sector | 5,15,304 |
82,680 |
26.6 | 1,21,589 |
30.9 |
|
| Data are
provisional.
@Reflects RIB redemption effect. FI : Financial Institution
NBFC
: Non-banking Financial Company
Notes:1 Variations in. M3,
NM3, L1, L2, L3and deposits during 2002-03
are adjusted for the full impact of mergers
and for the initial impact of
mergers under bank credit.
2. Government balances as on March 31, 2004 are
before closure of accounts. |
Currency demand accelerated in 2003-04 reflecting the strong
recovery in agricultural performance. The growth of banks’ time deposits, though
higher than in 2002-03, was compressed by the bullet redemption of RIBs in October
2003. Postal deposits recorded substantially higher expansion than time deposits
as bank deposit rates were moderated during the year while interest rates and
fiscal concessions on small savings remained unchanged (Chart 19). 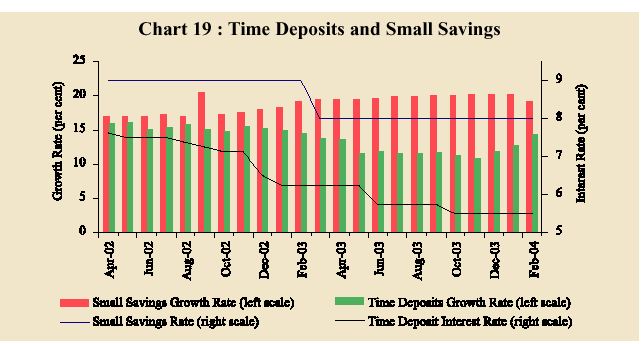
Credit
Behaviour Non-food
credit demand shrugged off an initial sluggishness and recorded an upsurge from
mid-August 2003. Housing credit continued to be an important driver of credit
growth, benefiting from tax incentives and lower interest rates. Retail credit
was also strong, buoyed by reviving consumer demand. Credit to industry also picked
up in the latter half of the year. During the year, there was increased recourse
by corporates to internal sources of financing as well as to external commercial
borrowings (ECBs) (Table 11). Food credit experienced a contraction on account
of a steady decline in food stocks. Table
11 : Key Sources of Funds to Industry
| (Rupees
crore) |
|
| Component |
2002-03 |
2003-04 | |
1 |
2 |
3 |
|
| 1. |
Bank Credit to Industry # |
24,189 |
10,307 | |
2. | External
Commercial Borrowings (including short-term trade credits) # # |
-8,007 |
16,646 | |
3. | Net
Profits @ | 9,445 |
14,086 | |
4. | Depreciation
Provision @ | 8,860 |
9,525 |
|
| # Data
relate to April-February and are inclusive of small-scale industries.
## Data
pertain to April-December and exclude RIB redemption effect.
@ Data relate
to April-September period of each year and are based on the performance of
1,150
non-financial non-government companies. |
The growth of net bank credit to the Government, at 10.4 per
cent during 2003-04, was the lowest since 1994-95. A number of factors such as
disinvestment proceeds, receipts under the Debt Swap Scheme, higher revenue buoyancy
and higher mobilisation on account of Savings Bonds enabled a build-up of cash
balances of the Central Government, which contributed to neutralising liquidity.
Commercial banks’ holdings of statutory liquidity ratio (SLR) securities, at 41.5
per cent of their net demand and time liabilities (NDTL) as at end-March 2004,
remained far in excess of the statutory requirement (Chart 20). 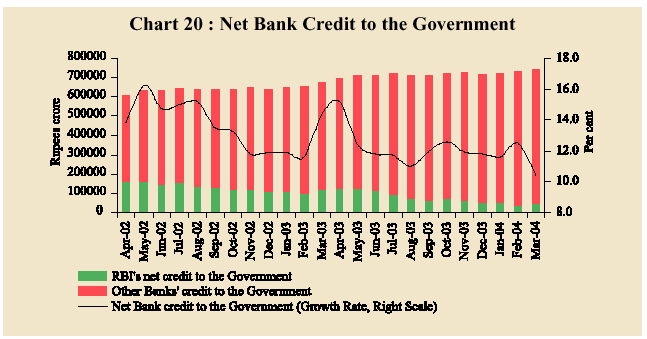
Reserve
Money Reserve money
was driven up by a record accretion to the net foreign exchange assets (NFEA)
of the Reserve Bank during 2003-04 (Table 12). The expansion in the RBI’s NFEA
in the first quarter (ending June 2003) was largely unsterilised although the
Centre’s market borrowing programme was the heaviest in the quarter. Reserve money
declined in the second quarter with the demand for currency exhibiting the usual
seasonal contraction. A reduction in bankers’ deposits with the Reserve Bank also
occurred on account of a 25 basis point cut in the cash reserve ratio (CRR), effective
June 14, 2003. With the relentless expansion in NFEA in the second quarter, sterilisation
operations were undertaken in the form of open markets sales (Rs.16,671 crore)
and primary auctions of the Centre’s dated securities which pushed up the Centre’s
cash balances by Rs.24,395 crore. The Reserve Bank's NFEA accretion continued
in the third quarter notwithstanding sales on account of the RIB redemptions and
pre-payments of external debt. Sterilisation operations were stepped up (net OMO
sales of Rs.14,225 crore and LAF repos of Rs.3,580 crore) but were lower than
the expansionary effect of the massive NFEA accretion on reserve money. This
was also coincident with a pick-up in currency demand. Reserve money expansion
continued in the fourth quarter with NFEA accretion unabated and accompanied by
a further pick-up in currency demand. Sterilisation operations in the fourth quarter
were through LAF repos (Rs.5,155 crore) and OMO sales (Rs. 5,332 crore). Reserve
money expansion during the year was amplified also by a build up of bank reserves
of Rs.19,662 crore during March 26-31, 2004, reflecting year-end considerations.
The increase in reserve money has continued to remain higher at 12.7 per cent,
on a year-on-year basis on April 30, 2004, than 11.6 per cent a year ago. Table
12 : Reserve Money
| (Rupees
crore) |
|
| Item |
2002-03 | 2003-04 | |
2002-03 | | |
2003-04 | |
| | | |
Q1 |
Q2 |
Q3 |
Q4 |
Q1 |
Q2 |
Q3 |
Q4 | |
1 | 2 |
3 |
4 |
5 |
6 |
7 |
8 |
9 |
10 |
11 |
|
| Reserve Money |
31,091 |
67,368 |
-8,850 |
6,791 |
7,917 |
25,233 |
16,342 |
-18,239 |
23,983 |
45,282 | | | |
(9.2) |
(18.3) | | | | | | | | |
| Components | | | | | | | | | | |
| 1. |
Currency in circulation |
31,499 |
44,550 |
14,633 |
-5,901 |
11,205 |
11,561 |
17,882 |
-5,955 |
17,986 |
14,636 | | | |
(12.6) |
(15.8) | | | | | | | | |
| 2. |
Bankers’ Deposits | | | | | | | | | | |
| | with
the RBI | -801 |
21,019 |
-23,873 |
12,451 |
-2,427 |
13,048 |
-1,606 |
-12,633 |
5,961 |
29,297 | |
3. | ‘Other’
Deposits | | | | | | | | | | |
| | with
the RBI | 393 |
1,799 |
389 | 241 |
-861 | 625 |
65 | 349 |
36 | 1,349 |
| Sources | | | | | | | | | | |
| 1. |
RBI’s net credit to | | | | | | | | | | |
| | Government |
-31,499 |
-73,125 |
-4,212 |
-19,779 |
-17,427 |
9,919 |
-4,451 |
-53,146 |
-12,506 |
-3,021 | | |
Of which :
to Centre | -28,399 |
-69,179 |
1,455 |
-19,555 |
-17,882 |
7,583 |
434 | -53,744 |
-15,844 |
-25 | | | |
(-20.1 ) |
(-61.2) | | | | | | | | |
| 2. |
RBI’s credit to Banks | | | | | | | | | | |
| | and Commercial
Sector | -6,468 |
-2,728 |
-6,537 |
-784 | 8 |
844 | -1,564 |
-2,525 |
-796 | 2,156 |
| 3. |
NFEA of the RBI | 94,275 |
1,26,169 |
19,279 |
19,619 |
34,766 |
20,611 |
22,710 |
25,720 |
51,931 |
25,808 | | | |
(35.7) |
(35.2) | | | | | | | | |
| 4. Government’s Currency | | | | | | | | | | |
| | Liabilities
to the Public | 705 |
220 | 168 |
256 | 157 |
124 | 84 |
74 | 43 |
19 | |
5. | Net
Non-Monetary | | | | | | | | | | |
| | Liabilities
of RBI | 25,922 |
-16,831 |
17,548 |
-7,479 |
9,587 |
6,265 |
437 | -11,639 |
14,689 |
-20,319 | |
Memo: | | | | | | | | | | |
| 1. |
Net Domestic Assets |
-63,184 |
-58,801 |
-28,130 |
-12,829 |
-26,849 |
4,622 |
-6,368 |
-43,959 |
-27,948 |
19,473 | |
2. | FCA,
adjusted for | | | | | | | | | | |
| | revaluation |
82,090 |
1,41,428 |
8,145 |
22,881 |
31,060 |
20,004 |
23,943 |
31,832 |
37,560 |
48,093 | |
3. | Net
Purchases from | | | | | | | | | | |
| | Authorised
Dealers | 75,661 |
1,40,650 |
3,929 |
18,958 |
25,165 |
27,608 |
22,237 |
29,899 |
40,669 |
47,845 | |
4. | NFEA/
Reserve Money | | | | | | | | | | |
| | (per
cent) (end-period) | 97.1 |
111.0 |
86.1 | 90.2 |
98.2 | 97.1 |
98.8 | 110.8 |
117.2 |
111.0 | |
5. | NFEA/Currency | | | | | | | | | | |
| | (per
cent) (end-period) | 126.8 |
148.1 |
106.6 |
116.6 |
124.6 |
126.8 |
126.8 |
138.1 |
146.8 |
148.1 |
|
| NFEA :
Net Foreign Exchange Assets; FCA : Foreign Currency Assets. Notes: 1.Data
based on March 31 for Q4 and last reporting Friday for all other quarters.
2.
Government balances as on March 31, 2004 are before closure of accounts.
3.
Figures in brackets are percentage variations during the year. |
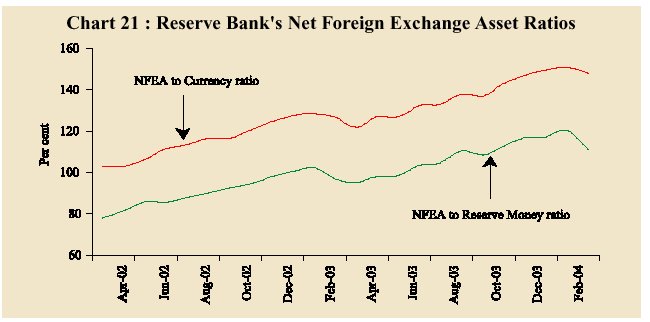
The Reserve Bank’s
foreign currency assets increased by Rs.1,41,428 crore, net of revaluation, in
2003-04, with the NFEA/currency (150.8 per cent) and NFEA/ reserve money (120.7
per cent) ratios peaking in February 2004 (Chart 21).
The
Reserve Bank’s primary support by way of its own subscriptions to the Centre’s
fresh dated securities (including Rs.5,000 crore to fund the Centre’s prepayment
of external debt) during 2003-04 was lower than in 2002-03 (Table 13). Table
13 : Net Reserve Bank Credit to the Centre
|
(Rupees crore) |
|
| Item |
2002-03 |
2003-04 | |
2002-03 | | |
2003-04 | |
| | | |
Q1 |
Q2 |
Q3 |
Q4 |
Q1 |
Q2 |
Q3 |
Q4 | |
1 |
2 |
3 |
4 |
5 |
6 |
7 |
8 |
9 |
10 |
11 |
|
| Net Reserve Bank
Credit | | | | | | | | | | |
| to the Centre
(1+2+3+4-5) | -28,399 |
-69,179 |
1,455 |
-19,555 |
-17,882 | 7,583 |
434 |
-53,744 |
-15,844 |
-25 | |
1. | Loans
and Advances | -5,176 |
0 |
2,472 |
-7,648 |
0 |
0 |
8,145 |
-8,145 |
0 |
0 | |
2. | Treasury
Bills held by | | | | | | | | | | |
| | the
Reserve Bank | -15 |
-3 |
-18 |
0 |
0 |
3 |
-3 |
0 |
0 |
0 | |
3. | Reserve
Bank’s Holdings | | | | | | | | | | |
| | of
Dated Securities | -24,731 |
-72,227 |
-6,107 |
-11,761 |
-17,979 |
11,116 |
-11,300 |
-45,530 |
-15,795 |
398 | |
4. | Reserve
Bank’s Holdings | | | | | | | | | | |
| | of
Rupee Coins | -92 |
20 |
64 |
-146 |
97 |
-106 |
163 |
-68 |
-51 |
-24 | |
5. | Central
Government | | | | | | | | | | |
| | Deposits |
-1,614 |
-3,030 |
-5,044 |
0 |
0 |
3,431 |
-3,430 |
0 |
-1 |
401 | | |
Memo Items* | | | | | | | | | | |
| 1. |
Market Borrowings of | | | | | | | | | | |
| | Dated
Securities by | | | | | | | | | | |
| | the
Centre # | 1,25,000 |
1,21,500 |
49,000 |
35,000 |
23,000 |
18,000 |
44,000 |
36,000 |
15,000 |
26,500 | |
2. | Reserve
Bank’s Primary | | | | | | | | | | |
| | Subscription
to Dated | | | | | | | | | | |
| | Securities |
36,175 |
21,500 |
22,018 |
1,157 |
0 |
13,000 |
5,000 |
0 |
0 |
16,500 | |
3. | Repos
(-) / Reverse | | | | | | | | | | |
| | Repos
(+) (LAF), | | | | | | | | | | |
| | net
position £ | 1,940 |
-32,230 |
-20,355 |
8,845 |
10,371 |
3,079 |
-25,052 |
1,557 |
-3,580 |
-5,155 | |
4. | Centre’s
Surplus | | | | | | | | | | |
| | Investment |
8,905 |
17,764 |
0 |
2,005 |
12,624 |
-5,724 |
-8,905 |
24,395 |
-2,355 |
4,629 | |
5. | Net
Open Market Sales # | 53,781 |
41,849 |
7,020 |
19,918 |
15,693 |
11,150 |
5,620 |
16,671 |
14,225 |
5,332 | |
6. | Primary
Operations $ | 23,616 |
6,786 |
29,598 |
-8,642 |
-12,527 |
15,187 |
25,643 |
-32,608 |
2,304 |
11,446 |
|
| * At face
value. # Excludes Treasury Bills. £ Includes fortnightly repos. $ Adjusted for
Centre’s surplus investment. Notes : 1. Quarterly variations are
based on March 31 for Q4 and last reporting Fridays for other quarters.
2.
Government balances as on March 31, 2004 are before closure of accounts. |
Consequent upon the
building of cash balances by the Centre and sizable sterilisation operations,
the Reserve Bank’s net credit to the Centre declined sharply and net domestic
assets of the Reserve Bank registered a corresponding decline. The net Reserve
Bank credit to the Centre declined by Rs. 1,18,975 crore, on a year-on-year basis,
on April 30, 2004, as a result of sterilisation operations to nuetralise the monetary
impact of the accretion of Rs. 1,66,472 crore (adjusted for revaluation) to foreign
currency assets.
Liquidity
Adjustment Facility The
Liquidity Adjustment Facility (LAF) remained the most important instrument of
liquidity management during 2003-04. In the face of a high order of capital inflows,
the LAF operated predominantly in an absorption mode with the repo rate emerging
as an anchor for the spectrum of interest rates. The average daily repos outstanding
was consistently higher than in 2002-03. There were, however, a few reverse repo
bids at the beginning of the financial year to smoothen liquidity during primary
auctions. Heavy repo bidding in April 2003 (average daily
repo outstanding at Rs.27,372 crore) ebbed in the subsequent months as the Centre’s
market borrowing programme gathered momentum. On June 14, 2003, tightening of
restrictions on non-bank call lending was synchronised with a cut in the CRR to
ensure a smooth transition. With the easing of liquidity conditions in July on
account of the return flow of advance tax payments, repo bids soared again with
a sharp increase in both the number and average size of bids. On August 23, 2003,
the repo rate was lowered by 50 basis points to 4.5 per cent causing a temporary
lull in repo biddings. Uncertainty in October on account of parallel open market
sales and a series of 28-day repos to mop up excess liquidity was reflected in
some volatility in the call money market. Activity in the LAF repos picked up
again from November 2003. Limits on the lending of non-bank participants in the
call money market were lowered in December. In March 2004, the average daily repo
outstanding increased to a high of Rs.54,915 crore with progressive diminution
of open market sales and sustained external inflows (Chart 22). 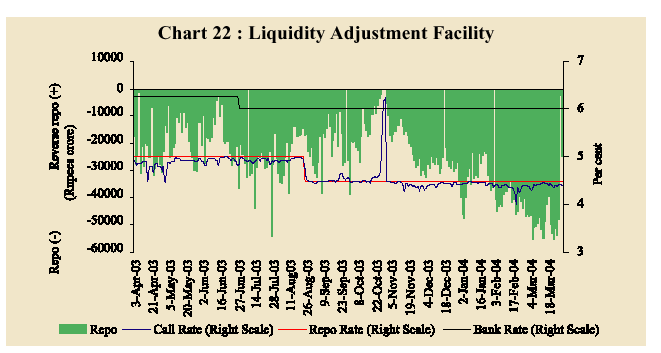
With
the introduction of daily 7-day repo and daily overnight fixed rate reverse repo
on March 29, 2004, the spread between the repo rate and reverse repo rate has
been reduced from 200 basis points to 150 basis points, with the 7-day fixed rate
repo rate at 4.5 per cent and overnight reverse repo rate at 6.0 per cent. Taking
into account both the 7-day and 14-day repos, the average daily repo amount outstanding
during April 2004 was Rs. 75,218 crore (as compared with Rs. 27,372 crore during
April 2003), reflecting the strong capital flows. In pursuance
of the recommendations of the Reserve Bank’s Working Group on Instruments of Sterilisation,
the Market Stabilisation Scheme (MSS) was introduced in April 2004 to strengthen
the monetary authority’s ability to conduct exchange rate and monetary management
operations. Under the Memorandum of Understanding signed between the Government
of India and the Reserve Bank on March 25, 2004, securities under the MSS are
being issued with an initial overall ceiling of Rs.60,000 crore for the year 2004-05.
An indicative schedule for issuance of MSS securities with a total auction amount
of Rs.35,500 crore covering the first quarter of 2004-05 was announced on March
25, 2004. Treasury Bills and/or dated securities issued under the MSS would be
the same as those issued for normal market borrowings and as such they would fortify
the conduct of sterilisation operations without segmenting the government securities
market. Paper issued under the MSS Scheme amounted to Rs. 23,000 crore by April
30, 2004.
|