Today, the Reserve Bank released the results of March 2023 round of its bi-monthly consumer confidence survey (CCS)1 The survey obtains current perceptions (vis-à-vis a year ago) and one year ahead expectations on general economic situation, employment scenario, overall price situation and own income and spending across 19 major cities. The latest round of the survey was conducted during March 2-11, 2023, covering 6,075 respondents. Female respondents accounted for 52.3 per cent of this sample. Highlights: -
Consumer confidence continues to recover from the historic low recorded in mid-2021, though it remained in the pessimistic zone; the current situation index (CSI)2 rose by 2.2 points on account of improved perception on general economic situation, employment, and household income (Chart 1 and Tables 1, 2 and 5). -
Households’ overall outlook for the year ahead remained in positive terrain despite marginally lower optimism (Chart 1). -
With an uptick in current perception, the sentiments on employment are nearing the levels seen around mid-2019; consumers are also optimistic about the employment outlook as more than half of the respondents expect employment scenario to improve over the next one year (Table 2). -
Household assessment of inflation conditions improved for the current period reflecting more confidence on economic conditions; notwithstanding a marginal uptick in the latest round, inflationary expectations improved over their average level since September 2021. -
Household spending was buoyant on the back of higher essential and non-essential spending; more than a third of the households expect a rise in non-essential outlay over the next year (Tables 6, 7 and 8). 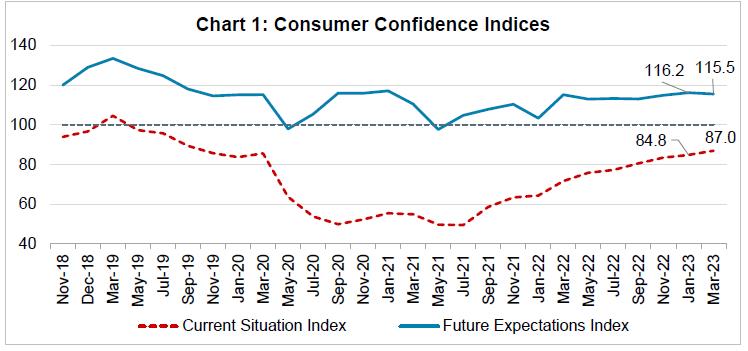 Note: Please see the excel file for time series data.3
| Table 1: Perceptions and Expectations on the General Economic Situation | | (Percentage responses) | | Survey Round | Current Perception | One year ahead Expectation | | Improved | Remained Same | Worsened | Net Response | Will Improve | Will Remain Same | Will Worsen | Net Response | | Mar-22 | 21.7 | 16.2 | 62.2 | -40.5 | 49.2 | 15.2 | 35.7 | 13.5 | | May-22 | 22.5 | 14.9 | 62.7 | -40.2 | 45.4 | 15.3 | 39.4 | 6.0 | | Jul-22 | 21.6 | 15.4 | 63.0 | -41.5 | 46.4 | 14.9 | 38.8 | 7.6 | | Sep-22 | 26.2 | 14.6 | 59.2 | -33.0 | 46.5 | 15.4 | 38.1 | 8.4 | | Nov-22 | 28.0 | 16.3 | 55.7 | -27.8 | 48.0 | 15.6 | 36.4 | 11.6 | | Jan-23 | 28.3 | 19.6 | 52.1 | -23.7 | 50.2 | 16.6 | 33.2 | 17.0 | | Mar-23 | 31.4 | 16.9 | 51.7 | -20.4 | 49.9 | 15.1 | 35.0 | 15.0 |
| Table 2: Perceptions and Expectations on Employment | | (Percentage responses) | | Survey Round | Current Perception | One year ahead Expectation | | Improved | Remained Same | Worsened | Net Response | Will Improve | Will Remain Same | Will Worsen | Net Response | | Mar-22 | 23.6 | 17.0 | 59.5 | -35.9 | 52.9 | 17.0 | 30.2 | 22.7 | | May-22 | 27.3 | 17.8 | 54.9 | -27.6 | 51.3 | 16.7 | 32.1 | 19.2 | | Jul-22 | 28.1 | 17.3 | 54.6 | -26.5 | 50.7 | 17.2 | 32.0 | 18.7 | | Sep-22 | 28.4 | 17.6 | 54.0 | -25.7 | 49.4 | 17.3 | 33.3 | 16.1 | | Nov-22 | 31.8 | 18.6 | 49.6 | -17.8 | 51.5 | 18.3 | 30.3 | 21.2 | | Jan-23 | 30.0 | 20.1 | 49.9 | -19.9 | 51.8 | 18.0 | 30.2 | 21.6 | | Mar-23 | 32.2 | 19.9 | 47.9 | -15.7 | 52.9 | 17.1 | 30.1 | 22.8 |
| Table 3: Perceptions and Expectations on Price Level | | (Percentage responses) | | Survey Round | Current Perception | One year ahead Expectation | | Increased | Remained Same | Decreased | Net Response | Will Increase | Will Remain Same | Will Decrease | Net Response | | Mar-22 | 93.3 | 5.6 | 1.2 | -92.1 | 79.1 | 10.4 | 10.5 | -68.6 | | May-22 | 95.4 | 4.1 | 0.5 | -94.9 | 80.0 | 11.1 | 8.9 | -71.1 | | Jul-22 | 95.2 | 4.0 | 0.9 | -94.3 | 80.4 | 10.9 | 8.8 | -71.6 | | Sep-22 | 94.6 | 4.3 | 1.1 | -93.6 | 79.9 | 11.0 | 9.1 | -70.8 | | Nov-22 | 94.9 | 4.1 | 1.0 | -93.9 | 82.2 | 9.3 | 8.6 | -73.6 | | Jan-23 | 93.6 | 5.0 | 1.3 | -92.3 | 83.0 | 10.1 | 7.0 | -76.1 | | Mar-23 | 93.8 | 5.2 | 1.0 | -92.9 | 84.3 | 9.0 | 6.7 | -77.5 |
| Table 4: Perceptions and Expectations on Rate of Change in Price Level (Inflation)* | | (Percentage responses) | | Survey Round | Current Perception | One year ahead Expectation | | Increased | Remained Same | Decreased | Net Response | Will Increase | Will Remain Same | Will Decrease | Net Response | | Mar-22 | 88.5 | 9.3 | 2.2 | -86.2 | 83.9 | 12.4 | 3.7 | -80.2 | | May-22 | 91.3 | 7.0 | 1.7 | -89.7 | 81.7 | 14.2 | 4.1 | -77.6 | | Jul-22 | 88.5 | 8.9 | 2.6 | -85.9 | 81.8 | 13.6 | 4.6 | -77.3 | | Sep-22 | 89.6 | 7.8 | 2.6 | -87.0 | 80.6 | 14.5 | 4.9 | -75.7 | | Nov-22 | 87.5 | 9.2 | 3.3 | -84.2 | 82.9 | 13.2 | 3.9 | -79.1 | | Jan-23 | 86.5 | 10.5 | 3.0 | -83.6 | 80.3 | 15.5 | 4.1 | -76.2 | | Mar-23 | 86.5 | 10.0 | 3.5 | -82.9 | 81.4 | 14.0 | 4.6 | -76.8 | | *Applicable only for those respondents who felt price has increased/price will increase. |
| Table 5: Perceptions and Expectations on Income | | (Percentage responses) | | Survey Round | Current Perception | One year ahead Expectation | | Increased | Remained Same | Decreased | Net Response | Will Increase | Will Remain Same | Will Decrease | Net Response | | Mar-22 | 16.0 | 42.1 | 42.0 | -26.0 | 52.9 | 38.5 | 8.6 | 44.3 | | May-22 | 17.6 | 46.0 | 36.4 | -18.9 | 52.4 | 39.2 | 8.4 | 44.0 | | Jul-22 | 18.2 | 46.0 | 35.9 | -17.7 | 51.6 | 40.0 | 8.4 | 43.3 | | Sep-22 | 20.2 | 45.5 | 34.4 | -14.2 | 51.3 | 39.8 | 8.9 | 42.4 | | Nov-22 | 20.9 | 46.1 | 32.9 | -12.0 | 52.5 | 39.9 | 7.6 | 44.9 | | Jan-23 | 21.4 | 49.0 | 29.6 | -8.3 | 54.5 | 38.7 | 6.9 | 47.6 | | Mar-23 | 22.2 | 49.7 | 28.1 | -5.9 | 54.1 | 38.4 | 7.5 | 46.7 |
| Table 6: Perceptions and Expectations on Spending | | (Percentage responses) | | Survey Round | Current Perception | One year ahead Expectation | | Increased | Remained Same | Decreased | Net Response | Will Increase | Will Remain Same | Will Decrease | Net Response | | Mar-22 | 64.1 | 24.8 | 11.1 | 53.0 | 70.4 | 23.2 | 6.4 | 64.1 | | May-22 | 69.4 | 22.1 | 8.5 | 60.9 | 72.5 | 21.7 | 5.8 | 66.7 | | Jul-22 | 72.6 | 21.1 | 6.3 | 66.3 | 73.0 | 22.4 | 4.6 | 68.3 | | Sep-22 | 75.9 | 17.5 | 6.6 | 69.2 | 74.2 | 20.7 | 5.2 | 69.0 | | Nov-22 | 74.9 | 19.2 | 5.9 | 69.0 | 75.0 | 20.3 | 4.7 | 70.2 | | Jan-23 | 73.9 | 20.6 | 5.5 | 68.4 | 75.5 | 19.8 | 4.7 | 70.8 | | Mar-23 | 75.0 | 19.6 | 5.4 | 69.6 | 75.4 | 19.9 | 4.6 | 70.8 |
| Table 7: Perceptions and Expectations on Spending- Essential Items | | (Percentage responses) | | Survey Round | Current Perception | One year ahead Expectation | | Increased | Remained Same | Decreased | Net Response | Will Increase | Will Remain Same | Will Decrease | Net Response | | Mar-22 | 76.6 | 15.7 | 7.7 | 68.9 | 78.6 | 16.2 | 5.2 | 73.5 | | May-22 | 81.7 | 12.8 | 5.5 | 76.2 | 79.9 | 15.7 | 4.4 | 75.4 | | Jul-22 | 82.0 | 13.7 | 4.3 | 77.7 | 80.0 | 16.5 | 3.6 | 76.4 | | Sep-22 | 85.2 | 10.7 | 4.1 | 81.1 | 80.9 | 15.4 | 3.7 | 77.3 | | Nov-22 | 84.7 | 11.6 | 3.7 | 81.0 | 81.1 | 15.4 | 3.5 | 77.7 | | Jan-23 | 84.1 | 12.3 | 3.6 | 80.5 | 81.3 | 15.2 | 3.5 | 77.8 | | Mar-23 | 85.3 | 11.5 | 3.2 | 82.1 | 81.7 | 14.8 | 3.5 | 78.2 |
| Table 8: Perceptions and Expectations on Spending- Non-Essential Items | | (Percentage responses) | | Survey Round | Current Perception | One year ahead Expectation | | Increased | Remained Same | Decreased | Net Response | Will Increase | Will Remain Same | Will Decrease | Net Response | | Mar-22 | 16.1 | 31.6 | 52.2 | -36.1 | 28.9 | 36.7 | 34.4 | -5.5 | | May-22 | 16.6 | 34.1 | 49.3 | -32.7 | 27.5 | 38.4 | 34.1 | -6.6 | | Jul-22 | 18.7 | 35.9 | 45.5 | -26.8 | 29.3 | 38.5 | 32.2 | -2.9 | | Sep-22 | 20.9 | 32.5 | 46.7 | -25.8 | 29.5 | 37.6 | 33.0 | -3.6 | | Nov-22 | 22.4 | 33.8 | 43.8 | -21.4 | 32.8 | 35.1 | 32.2 | 0.6 | | Jan-23 | 22.1 | 35.2 | 42.8 | -20.7 | 31.9 | 38.4 | 29.8 | 2.1 | | Mar-23 | 25.2 | 34.8 | 40.0 | -14.8 | 34.5 | 36.8 | 28.8 | 5.7 |
|