Press Release RBI Working Paper Series No. 11 SME Exchanges in India: Empirical Analysis of Firm Attributes and IPO Characteristics Shromona Ganguly@ Abstract 1Using the initial public offering (IPO) data of SME-dedicated exchanges, this study throws light on some of the characteristics of SME exchanges in India in terms of underpricing, aftermarket liquidity and long-run abnormal returns. It was found that firms listed in SME exchanges have higher profitability, liquidity and asset utilisation ratio as compared with other unlisted SMEs as well small firms listed in main boards. SME IPOs preceded by a boom market period are more underpriced. Further, lack of aftermarket liquidity remains a problem in SME exchanges with the turnover ratios declining significantly even within the first 60 trading days after listing. JEL Classifications: G18, G23, G29 Keywords: Small and medium enterprises, initial public offering, underpricing, institutional investors Introduction Small and medium enterprises (SMEs) play a vital role in the Indian economy due to their importance in job creation, export and balanced regional development. MSMEs account for 29 per cent of the country’s GDP and provide jobs to 11.13 crore people (Annual Report, Ministry of MSME, 2018-19 and 2019-20). Though the MSME sector continues to play a critical role in India’s growth, these enterprises, often do not have timely and adequate access to formal finance, due to the high information asymmetry resulting from lack of hard information and higher per unit cost of monitoring (Saito & Villanueva 1981, Tendulkar & Bhavani 1997, Berger & Udell, 2006; RBI, 2019). According to a research report by the World Bank (IFC, 2018), the overall demand for both debt and equity finance by MSMEs in India is estimated to be INR 87.7 trillion (USD 1.4 trillion), which comprises 69.9 trillion debt demand and 18.4 trillion equity demand. Out of the total debt demand, only 16 per cent is met by formal sources. Though worldwide SMEs are largely dependent on debt finance, equity financing plays an increasingly important role especially for relatively young, high-growth and technology-based SMEs (OECD, 2016). In addition to the information asymmetry, the technology-based MSMEs/startups face challenges to secure bank finance due to limited tangible assets and more intangible assets like patents, trademarks in their portfolio, coupled with uncertainty related to the financing of innovative activities (Timons & Bygrave,1986; Hall, 2002; Kerr & Nanda, 2015). Empirical research finds that equity financing is more suited as compared to bank financing for the growth of such technology intensive sectors (Rajan & Zingales, 2001). India’s effort to create an alternative exchange dedicated to SMEs dates back to 1989, when the Over the Counter (OTCEI) exchange was set up specifically for the SMEs, followed by the INDO NEXT Platform of BSE in 2005. Since these initial efforts did not achieve much success, a more comprehensive step towards the same was taken with the establishment of the BSE SME platform in March 2012 and the NSE SME platform (also known as NSE Emerge) in September 2012. Although in recent years, the two SME exchanges have seen a substantial rise in the number of initial public offering (IPOs), cross-country comparison reveals that the ratio of SME market capitalisation to main market capitalisation remains low in India (around 0.07 per cent) as compared with some other developing economies like Korea (10.96 per cent), Turkey (0.16 per cent), Egypt (0.33 per cent), South Africa (0.21 per cent) and Malaysia (0.75 per cent) (IOSCO, 2015). Even though creating a market for risk capital remains crucial for building an entrepreneurial ecosystem, there are a few academic works on understanding the nature of such nascent markets. Though some studies and research reports highlight the challenges of creating and sustaining separate SME exchanges (OECD, 2015; WFE, 2017; 2018), most of these rely on cross-country data, which, though informative, does not provide enough avenue to look into country specific factors. In recent years, India’s national policy objective of job creation and boosting productivity has given special importance to the start-up ecosystem of the country. Despite a reinvigorated focus on boosting entrepreneurial finances in the last few years, few studies so far attempted to put together SME exchange related statistics and listed SMEs’ financial results to gain insights into such markets in India. The present study attempts to fill this gap in literature by analysing the market microstructure of the SME exchanges in India, mainly in terms of three crucial parameters, viz., extent of underpricing, aftermarket liquidity and long run abnormal returns. The remaining part of the article is divided into four sections. Section II provides a brief description of listing criteria and distinctive regulatory features of SME exchanges in India, followed by a trend in recent performances and an analysis of salient firm characteristics listed in Indian SME exchanges. Section III delineates theoretical underpinning of market microstructure in the context of IPOs based on the literature, followed by the description of data, variables and empirical models. Section IV is dedicated for the empirical results and implications therein. Finally, section V concludes the article with a summary of major observations, policy implications and some avenues for future research. II. Overview of SME Exchanges in India II.1. Distinct Regulatory Features The listing criteria in both SME exchanges in India are designed to facilitate SME fundraising process while at the same time protecting investors’ interest. In order to make the process of fundraising easier and faster for the SMEs, Both the BSE SME exchange and NSE Emerge have certain relaxations in listing criteria (Table 1). To make the process of IPO faster for SMEs, the requirement of obtaining approval of the SEBI and filing a draft red herring prospectus (DRHP) have been waived. Further, relaxation is also given in terms of post-issue reporting requirements. While for firms listed in main board, submission of comprehensive quarterly financial results is mandatory, SMEs listed in SME exchanges are required to submit their abridged financial results on a half-yearly basis. In order to ensure guaranteed subscription even if the market response is poor, both the BSE and NSE SME exchanges in India mandate 100 per cent underwriting by the investment bank managing the IPO listing. In addition, mandatory market making by the investment banker during the initial three years has been put in place to ensure minimum liquidity in the secondary market. The allotment in the market making segment of SME IPO is discretionary. The minimum application amount and a trading lot are kept higher in the SME exchanges as compared with the main boards to ensure that only informed investors invest in these stocks due to their high risk and information asymmetry. The BSE SME Exchange uses the BSE on-line trading (BOLT) platform as its trading system, with normal trading hours between 09:00:00 and 15:30:00. The risk management system is similar to that of the main board in terms of all mark to market margin, VAR margin, extreme loss margin and special margins. The trade settlement cycle is also the same as the main board (T+2 days). However, unlike the purely order driven trading system in BSE main board, the BSE SME exchange trading can be either quote -driven or hybrid. | Table 1: Listing Requirement in BSE and NSE: Comparison between SME Platform and Main Board | | Attributes | BSE SME Platform | BSE Main Board | NSE SME Platform | NSE Main Board | | IPO Application Size | Not less than Rs.1 lakh | Rs.10,000-15,000 minimum | Not less than Rs.1 lakh | Rs.5000-Rs.7000 | | Post issue paid up capital (face value) | Not more than Rs.25 crores | Minimum Rs.10 crores | Less than Rs.25 crore | Not less than Rs.10 crore and the capitalization of the applicant's equity shall not be less than Rs.25 crores | | Minimum pre-tax operating profit | No such requirement | At least Rs.15 crores for preceding three years | At least three years. The company/entity should have positive cash accruals (earnings before depreciation and tax) from operations for at least 2 financial years preceding the application | Three years track record of positive net worth | | IPO grading | Not mandatory | Mandatory | Not mandatory | Mandatory | | Market capitalisation/ issue size | No restriction | No restriction | No restriction | No restriction | | IPO underwriting | 100 per cent (at least 15 per cent of the issue size on the book of the merchant banker) | Mandatory (not required when 75 per cent of the issue is offered for QIBs | 100 per cent (at least 15 per cent of the issue size on the book of the merchant banker) | Mandatory (not required when 75 per cent of the issue is offered for QIBs | | Minimum number of allotees in IPO | At least 50 | At least 1000 | At least 50 | At least 1000 | | Post issue reporting requirement | Half yearly (abridged) | Quarterly (comprehensive) | Half yearly (abridged) | Quarterly (comprehensive) | | Market making | Mandatory | Not mandatory | Mandatory | Not mandatory | | Vetting of DRHP | By the exchange | By SEBI | By the exchange | By SEBI | Note: In addition, SMEs need to have positive net worth and net tangible assets of a minimum of Rs 1.5 crore for new listing in BSE SME exchange.
Source: BSE and NSE. | II.2. Recent Trends and Performances Since its inception in 2012, an increasing number of SMEs got listed each year in BSE SME exchange till 2017-18. However, the trend reversed after that with the number of SME IPOs falling from 62 in 2017-18 to only 11 in 2020-21 (till January 2021). The same trend is observed in NSE emerge, where the number of IPOs registered a sharp increase from 8 in 2015-16 to 92 in 2017-18 and has fallen thereafter. These trends partly reflect the slowdown in number of IPOs in the main boards as well after 2017. The ratio of median issue size in SME board to main board also came down during past three years, reflecting muted market conditions, especially in the wake of Covid-19 pandemic (Table 2). Though the pace of recovery was also slower in this segment when compared with the rebound of the Indian equity market since March 2020 (Chart 1), a significant rebound is observed in IPO activity in both the main board as well as SME exchanges in Q4, 2020-21 (IPO trend report, Q4 2020, Ernst & Young). | Table 2: IPOs in Recent Years | | Year | Exchange | Number of issues | Median issue size
(Rs in lakhs) | | 2018-19 | Main board | 14 | 86264.705 | | SME Exchanges | 106 | 1001.82 | | 2019-20 | Main board | 13 | 63797.23 | | SME Exchanges | 45 | 624.64 | | 2020-21* | Main board | 16 | 59999.99 | | SME Exchanges | 16 | 467.86 | Note: *: till January 2021.
Source: Prime database. |
II.3. Sectoral Presence and Firm Attributes During the last few years, a sectoral breakup of companies listed in BSE and SME stock exchanges shows a majority of the listed firms belong to manufacturing, wholesale and retail trade and services (Chart 2). During the last three years, textile, trading (including exports), steel and electronics are some of the top sectors in terms of their share in total IPO issuance in SME exchanges during the last three years (Appendix Table 1). 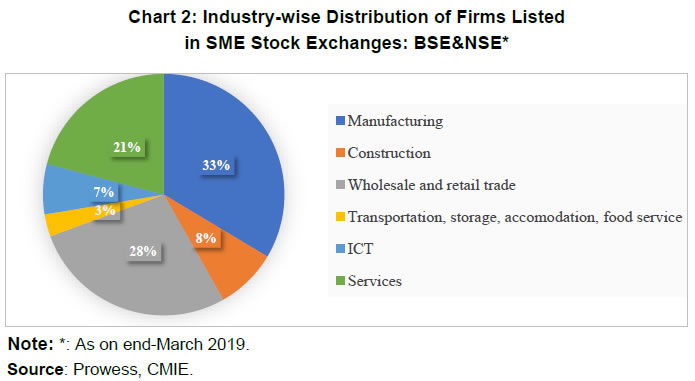 It is found that BSE and NSE SME exchanges have a greater proportion of new firms (firms in the age group 12 and below) as compared with the main board where firms in the age group 20 years and above constitute almost 85 per cent of all listed firms. This is in expected lines as worldwide, SME exchanges cater to young firms or gazelles i.e., firms that are into product or process innovation, are in a growth stage of their life cycle and lack access to equity financing. However, in terms of asset size, SME exchanges are dominated by midsize firms (Appendix Chart A1)2. The SME exchanges have a dominance of growth companies which is visible in terms of higher annual average sales growth and higher price-earning ratios of these companies as compared to companies listed in the main boards (Appendix Charts A2 and A3). In order to understand the key features of SMEs listed in SME dedicated exchanges, key financial attributes of these firms are compared with firms which are at the bottom 25 per cent in terms of asset size among all firms listed in BSE and/or NSE main board. SMEs listed in SME exchanges have better profitability ratios and higher return on assets and asset utilisation ratios as well as debt-equity ratio as compared with smallest 25 per cent of firms listed in main board. However, SMEs listed in BSE/NSE SME exchanges have lower liquidity as reflected in a lower quick ratio, current ratio and cash to current liabilities. There was no significant difference found in composition of debt between these two groups of firms, with formal borrowing (borrowing from banks and other financial institutions as well as market borrowing in the form of corporate debt, fixed deposits/debentures, etc.) accounting for close to 90 per cent of total borrowings in both groups (Table 3). | Table 3: Comparison of Key Financial Attributes | | Balance Sheet Indicators | 2019 | 2020 | | Smallest 25% listed firms in main boards | SMEs listed in BSE/ NSE SME exchanges | Smallest 25% listed firms in main boards | SMEs listed in BSE/ NSE SME exchanges | | PAT/Total Income | 0.691 | 2.819 | 0.000 | 2.192 | | Net profit margin | 0.236 | 2.791 | 0.000 | 2.187 | | Return on Capital Employed (ROCE) | 0.024 | 3.290 | -0.508 | 2.394 | | Return on Assets (RoA) | 0.000 | 2.402 | -0.621 | 1.779 | | Debt to Equity | 0.006 | 0.292 | 0.011 | 0.314 | | Proportion of formal borrowings | 89.56 | 87.57 | 91.19 | 87.69 | | Proportion of informal borrowings | 0.4 | 0.53 | - | 0.67 | | Quick Ratio | 1.220 | 1.031 | 1.172 | 0.962 | | Current Ratio | 2.135 | 1.728 | 2.377 | 1.756 | | Cash to Current Liabilities | 0.184 | 0.065 | 0.143 | 0.047 | | Asset Utlisation Ratio | 0.537 | 3.451 | 0.474 | 3.020 | Note: “-“: nil/negligible
Source: Author’s calculation based on data from Prowess, CMIE. | Further, key financial attributes of SMEs which are not listed yet but fulfill the eligibility criteria as set out by BSE and NSE is compared with the listed SMEs for the year 2019 and 2020. Since larger and more profitable SMEs typically tap the IPO market, this comparison could suffer from sample selection bias. To mitigate the sample selection bias, propensity score matching technique, pioneered by Rosenbaum and Rubin (1983) is applied. Propensity score matching is a statistical technique by which the impact of a policy intervention can be analysed, by comparing the outcomes of the treatment and control group. While the treatment group consists of units which receive the policy intervention, the control group consists of the units which did not receive the treatment but are equally likely to receive the same. This is done by ensuring similar distribution of covariates across the treatment and control groups. Though propensity score matching has been widely used in medical sciences, later it became popular in other disciplines for analysing observational data. In this context, the present paper follows the method adopted by Aggarwal and Thomas (2014), which uses propensity score matching to identify firms for analysing the impact of listing on SMEs’ performance. Based on the existing literature, the covariates chosen for matching are log (asset size) and log (PBDITA as a per cent to total income) of the firms. In the present case, treatment group consists of select firms listed in either of the two SME exchanges and control group firm consists of select firms which fulfill the listing criteria but are not listed. After matching using a Caliper of 0.2, a total of 45 matches were found between the treatment and control group firms3. Key financial attributes pertaining to the firms’ profitability, liquidity, efficiency and access to institutional finance are compared between the two groups to understand the nature of firms listed in SME exchanges (Table 4). | Table 4: Key Financial Attributes: Listed and Non-listed SMEs | | Balance Sheet Indicators | 2019 | 2020 | | Treatment group | Control group | Treatment group | Control group | | PAT/Total Income | 4.376 | 2.915 | 4.546 | 3.653 | | Net profit margin | 4.044 | 2.362 | 5.254 | 3.407 | | Return on Capital Employed (ROCE) | 4.885 | 2.362 | 7.089 | 3.085 | | Return on Assets (RoA) | 3.281 | 1.344 | 5.376 | 2.650 | | Debt to Equity | 0.293 | 0.357 | 0.249 | 0.341 | | Proportion of debt from formal sources | 88.810 | 61.611 | 89.604 | 78.265 | | Proportion of debt from informal sources | 10.376 | 23.408 | 11.837 | 27.014 | | Quick Ratio | 0.817 | 0.938 | 1.009 | 0.839 | | Current Ratio | 1.534 | 1.380 | 1.664 | 1.330 | | Cash to Current Liabilities | 0.069 | 0.046 | 0.134 | 0.080 | | Asset Utlisation Ratio | 3.301 | 1.502 | 2.835 | 2.720 | Note: Treatment group comprises select listed SMEs and control group comprises select SMEs which are not listed but fulfills all listing criteria. Selection of firms in both groups has been done following propensity score matching, to avoid selection bias.
Source: Author’s calculation based on data from Prowess, CMIE. | Table 4 shows treatment group firms have better profitability as compared to the control group firms as indicated by higher profit after tax as a percentage of their total income, net profit margin, return on capital employed (ROCE) and return on assets (RoA). These firms also have better liquidity as captured in their higher quick ratio (except in 2019) and current ratios and higher cash to current liabilities as compared to the control group firms. A higher asset utilisation ratio for the treatment group also indicates higher efficiency. Further, it is also found that treatment group firms, on average, have lower leverage compared with control group firms which are reflected in their lower debt-equity ratio. However, the nature of debt varies between these two groups. The proportion of formal sources such as banks and other financial institutions as well as other market-based sources (mainly in the form of fixed deposits, debentures, commercial papers and corporate debt) was found to be higher in the case of treated (listed) SMEs whereas the proportion of informal sources such as loans from promoters and inter-corporate loans was higher in case of control group firms. This essentially indicates that listed SMEs have better profitability and liquidity, lower leverage and perhaps better access to formal/institutional sources of funding as compared with a set of SMEs which are not listed in any of the exchanges, but possess somewhat similar characteristics, as these firms fulfill eligibility criteria for listing in exchanges. III. Underpricing, Liquidity and Returns in Indian SME IPO Market III.1. Theoretical Underpinning from Literature The empirical literature in finance identifies underpricing (whereby the IPO issuing company prices its share at a lower level as compared with the market value), aftermarket liquidity (measured in terms of turnover ratios after listing) and long run abnormal returns (measured in terms of buy and hold abnormal return or cumulative abnormal return) as three major elements of IPO market structure. There is a growing body of literature examining the IPO market in India mainly due to its importance in emerging as well as global IPO markets (Chakrabarti 2018, Hawaldar et al., 2018, Clarke et al., 2016, Ghosh 2005, Loughran et al., 1995). Most of these studies, particularly focus on IPO underpricing, a phenomenon observed frequently in global IPO markets. There are alternative theories, which explains the presence of underpricing in IPO markets. Rock (1986) proposed a winners’ curse hypothesis according to which issuers deliberately underprice their IPOs to woo uninformed investors. An alternative explanation proposed by Allen and Faulhaber (1989) and Grinblatt and Hwang (1989) suggested that underpricing is used as a signalling method by high quality firms. By offering a discount on its investments and growth, the firm creates a positive impression on investors’ mind and increases the chances of success of subsequent follow-on public offerings (FPOs). The existing IPO literature in the context of the Indian equity market finds significant evidence of underpricing among firms listed in BSE/NSE main boards, though there are only a few studies which examine the SME IPO market in India. A summarised review of the empirical literature of IPOs underpricing and long run performance in the Indian equity market is provided in Table 5, which mainly deals with extent, determinants of underpricing, and policy suggestions emanating from the empirical analysis for improving information asymmetry in the IPO market. In addition to broad-based empirical studies mentioned in Table 5, in recent years, a number of studies have also focused on the impact of more specific issues, such as corporate governance practices (Anand & Singh 2019; Singh et al., 2019), IPO grading (Deb & Marisetty, 2010; Dhamija & Arora, 2017; Tripathi & Pandey, 2018), role of underwriters/ investment bankers managing the IPOs and specific regulatory changes therein (Sahoo & Rajib, 2009; Clarke et al., 2016) and market timing (Ghosh 2004; Wadhwa & Syamala, 2018). | Table 5: Empirical Evidences of Underpricing and Long-Run Performance in Indian IPO Market: Review of Literature | | Author/s | Period of study | Sample of IPOs | Main conclusion | | Madhusoodan and Thiripalraju (1997) | 1992-1995 | Sample of 1922 companies which came out with IPO in BSE during 1992-95. | The return from Indian IPOs during 1-3 years after listing is significantly better than other countries. Par issues had given higher returns than the premium issues. IPOs managed by top 12 merchant bankers did not show any significant difference in return when compared to a broader set of IPOs. Reduction in listing delay did not improve the return significantly. Issues with some amount of firm allotment to mutual funds and NRIs performed worse as compared with IPOs without firm allotment. | | Krishnamurti and Kumar (2002) | 1992-1994 | 386 IPOs | Par-value issues and issues with lower offer value are more underpriced. Lack of a formal mechanism for gauging the extent of demand from potential investors, the regulatory restrictions on pricing of new firms without a track record, and the large delay between the approval date and the actual opening date of the public issue are some of the factors which explains underpricing of IPOs in Indian equity market. | | Ghosh (2005) | 1993-2001 | 1842 IPOs in BSE | IPOs with a large issue size and those that went for seasoned offerings had less underpricing. Contrary to the international evidence, underpricing was less during the high volume (hot) period, with significant differences observed between group companies and standalone companies. Larger firms underprice more during hot market timing and come back with FPOs in subsequent years while small, standalone firms underprice less and rarely come with FPO. | | Marisetty and Subrahmanyam (2010) | 1990-2004 | 2713 IPOs in BSE/NSE main board during the period 1990-2004 | Group affiliated companies experience more underpricing. Companies controlled by the government are the least underpriced. The long-run stock market performance, in general, is negative for all IPO. Results support the tunneling hypothesis rather than the certification hypothesis, whereby group firms exhibit more information asymmetry due to more family control. | | Sahoo and Rajib (2010) | 2002-2006 | 129 IPOs | underperformance is most pronounced during the initial year of trading, i.e., up to 12 months from the listing date followed by over–performance. Initial day return, offer size, leverage at IPO date, ex-ante uncertainty, and timing of issue are statistically significant in influencing underperformance. No significant influence of age of the IPO firm, rate of subscription, promoter group’s retention, and price-to-book value was found on the long-run underperformance. | | Jain and Padmavathi (2012) | 2004-2009 | 227 book-built IPOs | Underpricing is the result of investors’ high willingness to pay (high return on opening), high demand of the issue (high subscription), high firm value (low pre-IPO leverage), and high fluctuations in the market returns (high index volatility). The IPOs of high value firms (with lower Pre-IPO leverage) are more underpriced in India. At the time of high-index volatility, underpricing is high; therefore, during low index volatility, IPOs should be encouraged to reduce underpricing. | | Bora et al. (2012) | 2001-2011 | 303 IPOs listed in BSE | The Book-Building mechanism is preferred to Fixed Price method for efficient pricing. However, Fixed Price method is relatively more promising in long term as compared to the issues made through Book-Building process. The study also concludes that most of the smaller issue sizes companies opted for fixed price mechanism and companies with bigger issue sizes had opted for book building mechanism and that Book Building has encountered less under-pricing when compared with Fixed Price offer. | | Mayur and Mittal (2014) | 2000-2010 | 306 IPOs | Overall performance of firms deteriorates significantly in post IPO period, even after adjusting for industry effect. These results hold true for sub-samples with low as well as high underpricing, thus lending support to the view that there is no significant association between the level of underpricing and post-issue performance. | | Hawaldar et al. (2018) | 2001-2011 | 464 (365 book-built IPOs and 99 fixed-price IPOs) Indian IPOs that went public between 2001 and 2011. | Fixed-price IPOs are more underpriced as compared to book-built IPOs, as book building leads to better price discovery. Moreover, book-built IPOs are associated with negative cumulative average abnormal returns (CAARs) up to five years and beyond, the negative CAARs associated with fixed-price IPOs turn positive after one and one-half years and continue to be positive thereafter. | Among the few available studies which exclusively focus on SME IPO markets in India, Bhattacharya (2017) examined the underpricing and liquidity of SME IPOs in BSE for the period 2012-15 and found evidence of timed-to-market IPOs4 being more underpriced as compared to other IPOs because of initial price run-ups, while there was a significant drop in liquidity in most of the SME IPOs in BSE in the longer time horizon. Further, the study found that SME IPO market in BSE in most cases generated negative buy and hold return to investors, indicating a significant presence of adverse selection risk to the retail investors. The problem of illiquidity in SME stocks is also highlighted by Jain et al. (2013). Ghalke et al. (2018) found that on average IPO-bound firms in Indian SME exchanges resorted to a higher degree of earnings management as compared to main board IPO firms, which reduced investor protection and was thus detrimental to the sustainable development of SME exchanges in India. Dhamija and Arora (2017) found that IPO grading in the Indian SME market reduced the information asymmetry in general and the instances of underpricing were more severe in lower graded IPOs. Bhattacharya (2017) and Arora and Singh (2019) found empirical evidence of the strong impact of underwriter reputation in mitigating the information asymmetry in SME IPO market in India. Using the data of 403 SME IPOs listed between 2012-2018 in India, Arora and Singh (2020) found that while issue price, pricing mechanism, listing delay negatively influenced oversubscription; firm size, underwriter reputation, hot market and underpricing positively influenced oversubscription in Indian SME IPO market. The present paper extends the above strand of empirical literature to IPOs listed in SME exchanges in India during the last three years, i.e., 2017-18, 2018-19 and 2019-20. Based on the above literature, the following sections examine the trend, interrelationships and determinants of underpricing, liquidity and the buy and hold abnormal return (BHAR) / cumulative abnormal return (CAR) in Indian SME IPO market in a multivariate regression framework, controlling for various firm characteristics and market return variables. IPOs covered in the present study pertain to both the SME exchanges, as compared with only IPOs in BSE SME exchange in Bhattacharya (2017). III.2. Data, Variables and Empirical Model For analysis in this section, data were collected from two sources: all IPO related statistics such as listing day prices, IPO demand statistics and daily volume traded were obtained from the Prime database, while firms’ balance sheet information were obtained from Prowess database, CMIE. Daily Sensex returns were calculated based on historical values of the indices as available in BSE/NSE websites. Table 6 provides a detailed description of all variables used in analysis in subsequent sections of this paper. | Table 6: Variable Definitions | | Indicator | Unit | Description | | IPO Characteristics | | iu_raw | % | (First day closing price-offer price)/offer price | | iu_adj | % | Raw initial underpricing adjusted for market return during IPO listing day | | Premium (Prm) | Rs | Issue price-Face value | | rii_allot | % | Percentage of shares in IPO allotted to retail investor category | | ipo_proceed | Rs | Issue price*number of shares in IPO | | Premium | Rs | Difference between offer price and face value | | Market Variables | | Sensex_rtn_lag | % | BSE/NSE return during 60 days preceding the IPO | | VIX_lag | % | Average India VIX during 60 days preceding the IPO | | IPO Liquidity Measures | | tor_avg | % | Average daily turnover ratio, given by volume of share traded/number of share outstanding | | tor_avg_20 | % | tor over 20 trading days after IPO | | tor_avg_60 | % | tor over 60 trading days after IPO | | IPO Long Run Performance Measures | | bhar_260 | % | Buy and hold abnormal return during the first 260 days of IPO listing | | car_260 | % | Cumulative abnormal return during first 260 days of IPO listing | | Firm Characteristics | | Total Assets (TA) | Rs million | Total asset of the firm on March 31st of the previous year of IPO listing | | Age | No of years | Age of the firm at the time of IPO, given by year of incorporation-IPO listing year | | Current ratio (C-R) | Times | Current assets/current liabilities in the year preceding IPO | | Debt to equity ratio (DER) | Times | Total debt/shareholders' equity in the year preceding IPO | | Return on assets (RoA) | % | PAT/average total assets in the year preceding IPO | Empirical studies find that IPO underpricing mainly depends on three sets of variables: the IPO specific variables such as IPO size and premium, market variables such as lagged market return and volatility and finally various firm attributes such as age, size, industry, liquidity and profitability indicators (Ritter, 1984; 1991; Loughran & Ritter, 1995; Ghosh, 2005; Butler et al., 2014; Bhattacharya, 2017). Following the literature, the regression model below is estimated for analysing the determinants of IPO underpricing in SME segment.  In regression model 1, the dependent variable is adjusted underpricing of ith SME IPO at time t, defined as raw initial underpricing adjusted for market return on IPO listing day (Lin & Hsu, 2008). The market return is taken as BSE Smallcap Index return on IPO listing day for SME IPOs listed in BSE and Nifty Smallcap 50 for IPOs listed in NSE Emerge5. Following the method in Butler et al. (2014) and Bhattacharya (2017), the market return of BSE Sensex/Nifty 50 during 60 days prior to the IPO listing date is taken as a measure of lagged market return and the average VIX6 for the same window is taken as a measure of market volatility. While there is some evidence, which suggests higher underpricing occurs in IPOs which are issued at a hot time, i.e., market boom, some studies also find that timed-to-market IPOs have lesser underpricing if issued by larger firms, as cheaper equity is used as a measure to signal firm value to investors (Welch, 1996; Allen & Faulhaber, 1989). Further, Ghosh (2005) found that hot issues belonging to small firms which did not come back subsequently to raise funds, are less underpriced as compared to larger firms which came back with FPO. To examine the role of signalling, a dummy variable premium is included to identify the extent of premium in IPOs. The above regression controls for several firm characteristics such as age, firm size measured by log (total assets), liquidity measured by the current ratio, profitability measured by the return on assets and leverage measured by the debt to equity ratio. Since small and younger firms are generally considered to be riskier by the investors, the extent of underpricing is expected to be more for these firms. The profitability, leverage and liquidity indicators are used by the investors as available information to gauge the financial health of the firm prior to investing. The regression model also controls for industry and year by incorporating dummies. The following model (2) is estimated for understanding what determines the aftermarket liquidity in SME exchanges in India. The dependent variable is liquidity measured by average turnover ratio over 7, 20 and 60 trading days immediately after the IPO7. While the model controls for the same firm characteristics, industry and year effects, it also includes IPO size measured by total IPO proceeds, retail investors’ share and underpricing on the right-hand side. The impact of underpricing on liquidity is established in the literature through three links, i.e., (1) a positive relation between underpricing and oversubscription for the new issues; (2) a positive relation between oversubscription and ownership dispersion; and (3) a positive relation between ownership dispersion and market liquidity (Koh & Walter, 1989; Booth & Chua 1996; Brennan & Franks, 1997).  Finally, model (3) is estimated to understand the determinants of long-run abnormal returns8 in SME IPO market. BHAR as well as the CAR of the stock for over a duration of T days is calculated as follows, following Ritter (1991). Model (3) explains both BHAR and CAR of SME IPO for the 260 days’ time horizon immediately after the IPO in terms of firm information which are publicly available to the investors such as age, industry, size, profitability and liquidity. In a market where investors are informed, the long run performance of the stocks should be positively related to the firm fundamentals. In contrast, if investors are mostly moved by the market sentiment, then it is expected that IPOs issued at a hot time should underperform more in the long run as compared to other IPOs.  All the above three equations are estimated on a total 37 IPOs listed in NSE Emerge and 33 in BSE SME exchange during last three years, i.e., 2019-20, 2018-19 and 2017-18, which features in the top 25 SME IPOs in terms of IPO amount issued during the year9. In the sample, the average age of the firm at the time of listing is 13 years with average debt to equity ratio of 1.37 (Appendix Table 2). Further, to compare the individual investor experience, average BHAR/CAR is calculated for various portfolios according to their time-to-market and participation of retail investors (Table 12). IV. Empirical Results During 2012-2020, median underpricing in the two SME exchanges were lower than the median underpricing observed in IPOs in the BSE/SME main boards for most of the period except 2017 and 2018 (Chart 3). Notably, very few of the SMEs came back later to raise funds through follow-on public offers (FPOs)10; thus lending support to the hypothesis that firms, which do not come up with FPOs have lesser voluntary underpricing (Ghosh, 2005). 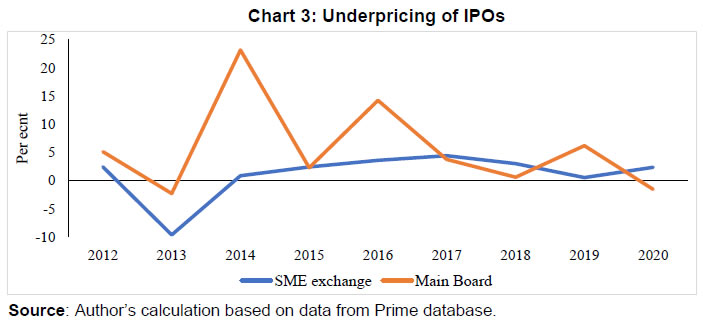 A more detailed exchange-wise analysis of underpricing reveals some interesting facts. The number of IPOs in BSE SME exchange witnessed a significant increase and surpassed the total number of IPOs in BSE main board during the same period. The average underpricing in BSE SME exchange is found to be much lower than that in BSE main board during the period 2012-2020 (Appendix Table 3). NSE Emerge experienced a surge in the number of IPOs since 2017. A similar trend is observed in the case of NSE Emerge with mean adjusted underpricing found to be lower as compared to the NSE main board for all the years except 2020 (Appendix Table 4). In addition, there is a steady decline in average underpricing in both the SME exchanges over the years, while the main boards do not exhibit a similar trend. Little correlation is found between the trend in mean adjusted underpricing in the main board and the SME exchanges, suggesting the underlying reasons for underpricing could be substantially different in the SME segments as compared to their respective main boards. The activity group wise statistics in Table 7 provides some useful information about the significant variation in IPO characteristics within industries and justify the inclusion of industry dummies in the regression. Though no significant difference is seen in IPO issue size across industries, it is found that activity group ‘electricity, gas, steam and air condition supply commands a high premium in its IPOs, followed by financial and insurance services. Further, retail participation is found to be much higher in this industry along with financial and insurance services. Adjusted underpricing is highest in the information and communication technology sector followed by administration and support services and construction; IPOs from all these industries exhibit highest turnover ratios, supporting the finding of some studies that underpricing of IPOs facilitate aftermarket liquidity. Finally, the long term returns of most of the industries are found negative, except for financial and insurance services. This indicates the high risk associated with investing in SME exchange markets for retail investors. It is also found that aftermarket liquidity keeps on declining for all the industries since the launch of IPO till the next 60 day period, indicating paltry trading in the SME exchanges in India (Table 7). | Table 7: Summary Statistics in Sample by Industry: IPO Characteristics | | Industry | Logissue | Premium | RI_allot | iu_adj | BHAR | CAR | TOR7 | TOR20 | TOR60 | | Admin & support | 3.455393 | 63 | 50 | 7.861417 | -25.10526 | -15.79352 | 15.66498 | 9.509039 | 4.189502 | | Construction | 3.483498 | 51 | 42.695 | 6.316173 | -28.75208 | -33.00447 | 7.556698 | 3.293431 | 1.695032 | | Electricity, gas, steam & air condition supply | 3.484664 | 151 | 82.03 | -1.271524 | -53.06624 | -96.2318 | 5.497288 | 5.511881 | 2.247226 | | Financial & insurance services | 3.398683 | 31 | 50.39 | 2.234212 | 95.46632 | 74.73257 | 8.118159 | 3.702794 | 1.65266 | | Information & communication | 3.562204 | 63.5 | 42.525 | 17.7332 | -5.394667 | 1.346547 | 6.48142 | 3.518037 | 1.640806 | | Manufacturing | 3.439396 | 55 | 35 | 1.36482 | -4.951144 | 1.589722 | 3.724519 | 2.285396 | 1.359033 | | Professional, scientific & technical activities | 3.124376 | 35 | 29.82 | -.6578463 | -11.31366 | .9649308 | 3.72053 | 2.259573 | 1.266509 | | Transportation & storage | 3.497021 | 74 | 35 | 2.709414 | -1.71897 | 4.334709 | 0 | 2.689437 | 1.096081 | | Wholesale & retail trade | 3.231087 | 47 | 33.91 | -.4326568 | -29.64075 | -21.59376 | 1.826484 | 1.583691 | 1.144737 | | Total | 3.437325 | 55.5 | 35.045 | 2.295787 | -14.63034 | -4.16656 | 3.732324 | 2.781939 | 1.445691 | Note: Table 7 reports median values for each industry. Industry classification is as per activity groups defined in National Industrial Classification (2008).
Source: Author’s calculation based on data from Prime database. | The estimation results of model 1 are provided in Table 8. It is found that lagged market return is positively related to underpricing suggesting that IPOs issued in relatively boom period witness more underpricing as compared to other IPOs and supports the finding of previous studies (Bhattacharya, 2017). The above relation is statistically significant. Though the coefficient of VIX_lag is positive as expected, it is not statistically significant. The coefficient of Premium is negative and significant, implying IPOs issued with a premium is less underpriced as it is perceived as less risky by the investors. This result too is broadly in line with the results obtained in past studies. Further, the exchange dummy is positive and significant which suggests underpricing is more prevalent in NSE Emerge as compared with BSE SME exchange. The coefficient of RII_allot is negative and significant, implying more retail participation in the SME IPO results in lower underpricing. This could be intuitively explained by the initial price run-ups resulting from higher retail participation. | Table 8: Estimation of Model 1: IPO Underpricing | | iu_adj | Coef. | St.Err. | t-value | p-value | [95% Conf | Interval] | Sig | | Sensex_rtn | 0.901 | 0.342 | 2.63 | 0.011 | 0.212 | 1.590 | ** | | VIX | 1.162 | 0.760 | 1.53 | 0.133 | -0.368 | 2.692 | | | Log_asset | 2.161 | 4.458 | 0.48 | 0.630 | -6.811 | 11.134 | | | Current_ratio | -1.693 | 1.613 | -1.05 | 0.300 | -4.940 | 1.555 | | | Log_age | -1.912 | 3.956 | -0.48 | 0.631 | -9.875 | 6.052 | | | ROCE | 0.002 | 0.034 | 0.06 | 0.953 | -0.066 | 0.070 | | | Debt_equity | -2.197 | 0.696 | -3.16 | 0.003 | -3.598 | -0.796 | *** | | RI_alloted | -0.174 | 0.080 | -2.19 | 0.034 | -0.335 | -0.014 | ** | | exchange | 7.053 | 2.377 | 2.97 | 0.005 | 2.267 | 11.838 | *** | | Premium | -0.060 | 0.021 | -2.83 | 0.007 | -0.103 | -0.017 | *** | | Logissue | 0.344 | 6.736 | 0.05 | 0.960 | -13.215 | 13.902 | | | NIC2 | 7.726 | 4.780 | 1.62 | 0.113 | -1.896 | 17.348 | | | NIC3 | 5.293 | 5.072 | 1.04 | 0.302 | -4.915 | 15.502 | | | NIC4 | 7.825 | 4.554 | 1.72 | 0.093 | -1.343 | 16.992 | * | | NIC5 | 6.857 | 8.768 | 0.78 | 0.438 | -10.793 | 24.506 | | | NIC6 | 11.522 | 6.032 | 1.91 | 0.062 | -0.619 | 23.663 | * | | NIC7 | 9.950 | 5.275 | 1.89 | 0.066 | -0.668 | 20.568 | * | | NIC8 | 27.130 | 14.832 | 1.83 | 0.074 | -2.726 | 56.985 | * | | 2018.IPO_year | -3.592 | 4.775 | -0.75 | 0.456 | -13.203 | 6.020 | | | 2019.IPO_year | -12.321 | 6.170 | -2.00 | 0.052 | -24.741 | 0.099 | * | | 2020.IPO_year | 3.571 | 7.936 | 0.45 | 0.655 | -12.403 | 19.545 | | | Constant | -10.499 | 17.779 | -0.59 | 0.558 | -46.286 | 25.288 | | | Mean dependent var | 3.677 | SD dependent var | 11.173 | | | R-squared | 0.547 | Number of obs | 68.000 | | F-test | 4.957 | Prob > F | 0.000 | | Akaike crit. (AIC) | 510.306 | Bayesian crit. (BIC) | 559.136 | Note: *** p<0.01, ** p<0.05, * p<0.1
Source: Author’s estimates. | Among the firm control variables, only debt to equity ratio is found to be negative and significant. Though one strand of literature on firms’ leverage suggests that debt is a signal of distress and hence results in more underpricing (Su, 2004), another strand of literature suggests that higher pre-leverage IPO is a positive signal of firms’ quality as financial institutions would have screened those firms for their quality. The present result rather supports the finding of Jain and Padmavathi (2012), which studies the impact of pre-IPO leverage on underpricing of IPOs in 227 IPOs in India between 2004-09 and finds a negative relationship between these two. This could be explained by the fact that in the sample, firms with higher debt to equity ratio are also more matured firms and also have a higher return on capital employed and higher pre-IPO liquidity. Also, it is found that institutional investors’ participation and debt equity ratio have a positive association (Appendix Table 6). Thus, a possible explanation could be that for well-informed institutional investors, pre-IPO debt acts as some kind of positive signal in the SME IPO market in India. To examine whether the liquidity of SME stocks has some common pattern over time, the Jonckheere-Terpstra (J-T) test, as well as the test developed by Cuzick (1985), has been applied11. The results indicate that while there is a clear declining trend observed in various aftermarket liquidity indicators (TOR7, TOR20 and TOR60) in SME IPOs listed in BSE, the same cannot be inferred for SME IPOs in NSE Emerge, suggested by an insignificant test statistic found in both the methods (Table 9). | Table 9: Cuzick (1985) and Jonckheere-Terpstra (J-T) Trend Analysis of Liquidity | | Turnover ratios | Sum of ranks | | BSE | NSE | | TOR 7 | 2258.00 | 1702.50 | | TOR 20 | 1681.50 | 2415.50 | | TOR 60 | 1010.50 | 2098.00 | | Cuzick Z stat | -5.20 | 0.77 | | P value | 0.00 | 0.44 | | Jonckheere-Terpstra (JT) Z stat | -5.58 | 1.21 | | P value | 0.00 | 0.88 | | Source: Author’s estimates. | Moving to the next model, i.e., model 2, it is found that the exchange dummy is significant and negative consistently in the three regression estimations with TOR7, TOR 20 and TOR 60 as the dependent variables, indicating that the aftermarket liquidity of SME IPOs is less in NSE Emerge as compared with the BSE SME exchange, though the magnitude of the coefficients suggest that such difference is most significant during the first week after the IPO and gradually reduces thereafter. Retail investors’ participation is found to be positively influencing the liquidity during the 20 and 60 day horizon after launch of the IPO. This result is along expected lines since more retail investors’ participation facilitates more trading in the stocks. Among various firm specific variables, debt equity ratio is found to be positively related with aftermarket liquidity and this is statistically significant. This result could implicitly again support the signalling hypothesis of pre-IPO debt. Though the coefficient of iu_adj is positive in all three regressions, supporting the liquidity hypothesis mentioned earlier, it is not statistically significant. The results in table 10 do not provide enough evidence of issue size, market timing of IPOs and other firm characteristics impacting aftermarket liquidity. | Table 10: Estimation of Model 2: IPO aftermarket Liquidity | | | (1) | (2) | (3) | | TOR7 | TOR20 | TOR60 | | iu_adj | 0.060 | 0.031 | 0.019 | | (0.122) | (0.056) | (0.025) | | Logissue | 7.271 | 2.525 | 0.694 | | (4.630) | (2.340) | (1.028) | | RI_alloted | 0.055 | 0.054** | 0.021** | | (0.050) | (0.021) | (0.010) | | Log_age | 0.946 | 0.938 | 0.172 | | (2.242) | (1.280) | (0.595) | | Log_asset | -1.941 | -1.136 | -0.764 | | (2.492) | (1.246) | (0.577) | | Debt_equity | 1.014** | 0.529* | 0.294* | | (0.483) | (0.275) | (0.156) | | Sensex_rtn | -0.112 | -0.137 | -0.048 | | (0.260) | (0.122) | (0.054) | | VIX | 0.407 | -0.072 | -0.106 | | (0.514) | (0.263) | (0.130) | | exchange | -3.817*** | -1.877*** | -1.029*** | | (1.320) | (0.692) | (0.334) | | _cons | -18.314 | -3.814 | 1.856 | | (13.091) | (6.529) | (3.118) | | Obs. | 68 | 68 | 67 | | R-squared | 0.387 | 0.389 | 0.398 | | Industry Dummy | Yes | Yes | Yes | | IPOyear Dummy | Yes | Yes | Yes | Note: Standard errors are in parenthesis, *** p<0.01, ** p<0.05, * p<0.1
Source: Author’s estimates. | Finally, estimation results of model 3 are provided in Table 11. As can be seen from the results, apart from retail investors’ allocation proportion and adjusted underpricing, no other variable turned out to be significant in the regression. A negative coefficient of RI_alloted indicates SME IPOs with more participation from the retail investors have on an average lower long run abnormal returns. Similarly, the results suggest that SME IPOs with higher initial underpricing have lower long run returns to the investors. None of the coefficients related to firm attributes are significant. | Table 11: Estimation Results of Model 3: Long Run Abnormal Returns | | | (1) | (2) | | BHAR | CAR | | iu_adj | -1.108* | -1.210** | | (0.649) | (0.452) | | Sensex_rtn | 4.488 | 3.721 | | (3.842) | (3.623) | | VIX | -5.211 | 2.769 | | (4.767) | (11.097) | | Debt_equity | -9.121 | -11.388 | | (10.470) | (10.288) | | Current_ratio | -27.841 | -17.679 | | (22.152) | (15.235) | | Log_asset | -63.024 | -38.655* | | (57.293) | (21.239) | | Log_age | 38.833 | 38.245 | | (46.594) | (40.707) | | RI_alloted | -1.883* | -1.991** | | (1.040) | (0.748) | | _cons | 327.967 | 140.262 | | (252.224) | (151.133) | | Obs. | 53 | 53 | | R-squared | 0.280 | 0.224 | Note: BHAR/CAR in the regression excludes raw initial underpricing.
Standard errors are in parenthesis, *** p<0.01, ** p<0.05, * p<0.1
Source: Author’s estimates. | The empirical results find that timed-to-market IPOs in SME exchange market tend to be more underpriced and generate lower long run returns. Further, such timed-to-market IPOs also have higher retail investor participation (Table 12). In sum, it appears that retail investors are more prone to investing in SME IPOs which are issued during the market boom, but eventually generate a lower return in the longer run. The above results indicate the presence of significant information asymmetry in the SME IPO market in India. | Table 12: Market Timing, Retail Investor Participation, and Long run Abnormal Returns | | Dummy_mkt=0 | median | sd | max | min | | BHAR | -9.163 | 34.547 | 95.466 | -56.839 | | CAR | -1.007 | 41.02 | 74.733 | -84.38 | | RI_allot | 35 | 15.545 | 75.81 | 9.64 | | Dummy_mkt=1 | median | sd | max | min | | BHAR | -19.484 | 111.509 | 540.932 | -62.951 | | CAR | -10.294 | 115.538 | 490.163 | -146.035 | | RI_allot | 50 | 21.215 | 89.44 | 11.59 | Note: Dummy_mkt takes value 1 for IPOs with above median value of Sensex_rtn_lag.
Source: Author’s estimates. | V. Conclusion Generally, it is perceived that information asymmetry could be higher in the SME exchanges as compared to the main boards as SMEs often lack a systematic track record and their businesses are more localised. In this context, the present article sheds light on some important characteristics of SME exchanges in India. Contrary to the general perception, it was found that the extent of underpricing in both the SME exchanges is lower when compared to the respective main boards and over time the extent of underpricing has reduced in SME exchanges. In addition, the empirical analysis finds that SME IPOs issued during hot market timing are more underpriced. Retail investors invest more in time-to-market SME IPOs which generate a lower return in the longer run. Though retail investors’ participation facilitates aftermarket liquidity of SME IPOs, from a policy perspective, there is a need of broadening the investor base to suit the risk-return combination offered by these alternate investment markets. At the same time, protecting retail investors’ interest remains important given that many of the SME IPOs have generated negative BHAR/CAR. In this context, SME IPOs’ response data summary also shows that the role of mutual funds, banks and other financial institutions as investors in such markets are still limited. SEBI has already taken steps to enhance the role of anchor investors in SME IPOs by relaxing the minimum size criteria (SEBI, 2018). However, a lot more needs to be done in this direction, especially given that so far, a handful of SME IPOs have anchor investors’ participation. Empirical analysis of the study also throws some interesting questions which, even though could not be addressed in the present paper, opens some new areas of research. Prima facie, the finding that average underpricing is lower in SME exchanges as compared to the main boards could be a result of tepid market response to SME IPOs in India rather than an indication of lesser information asymmetry, though a more detailed investigation into the same is required for better understanding. While results in the paper indicate that pre-IPO debt has a negative association with underpricing, more research is needed to understand the role of debt in the IPO market in India. In addition, there are mixed evidences on the efficacy of IPO grading in the Indian market (Deb & Marisetty, 2010; Baluja, 2013) and further research is needed to understand the role of IPO grading in SME IPO market. Lastly, though traditional measures of underpricing help us to understand the relative position of SME exchange vis-à-vis main boards, a more detailed analysis of the IPO response data and decomposition of underpricing into its two main components, i.e., pre-IPO voluntary underpricing and post-IPO market driven initial return as well as scenario analysis to understand the impact of listing on firms’ performance would throw further insights into the topic and remain as a future research agenda.
References Aggarwal, N., & Thomas, S. (2017). Response of firms to listing: Evidence from SME exchanges (No. 2017-022). Indira Gandhi Institute of Development Research, Mumbai, India. Amihud, Y. (2002) Illiquidity and stock returns: cross-section and time-series effects. Journal of Financial Markets 5: 31–56. Allen, F., & Faulhaber, G. R. (1989). Signaling by underpricing in the IPO market. Journal of financial Economics, 23(2): 303-323. Anand, R., & Singh, B. (2019). Do Firm-and Board-specific Characteristics Corroborate Underpricing? A Study on the Indian IPOs. Management and Labour Studies, 44(1): 86-102. Annual Report (2018-19). Ministry of MSME. https://msme.gov.in/sites/default/files/Annualrprt.pdf Annual Report (2019-20). Ministry of MSME. https://msme.gov.in/sites/default/files/FINAL_MSME_ENGLISH_AR_2019-20.pdf Arora, N., & Singh, B. (2019). Impact of Auditor and Underwriter Reputation on Underpricing of SME IPOs in India. Management and Labour Studies, 44(2): 193–208. https://doi.org/10.1177/058042X19829285 Arora, N. & Singh, B. (2020). Determinants of oversubscription of SME IPOs in India: evidence from quantile regression. Asia-Pacific Journal of Business Administration, Vol. 12 No. 3/4, pp. 349-370. https://doi.org/10.1108/APJBA-05-2020-0160 Austin, P. C. (2009). Using the standardized difference to compare the prevalence of a binary variable between two groups in observational research. Communications in statistics-simulation and computation, 38(6): 1228-1234. Baker, M., & Wurgler, J. (2002). Market timing and capital structure. The journal of finance, 57(1): 1-32. Baluja, G. (2013). Comparative analysis of listing price performance between different graded IPOs in India. Pacific Business Review International, 6(5): 1-7. Barber, B. M., & Lyon, J. D. (1997). Detecting long-run abnormal stock returns: The empirical power and specification of test statistics. Journal of financial economics, 43(3): 341-372. Bhattacharya, A. (2017). Innovations in new venture financing: Evidence from Indian SME IPOs. Global Finance Journal, 34(C): 72-88. Berger, A. N., & Udell, G. F. (2006). A more complete conceptual framework for SME finance. Journal of Banking & Finance, 30(11), 2945-2966. Booth, J. R., & Chua, L. (1996). Ownership dispersion, costly information, and IPO underpricing. Journal of Financial Economics, 41(2), 291-310. Bora, B., Adhikary, A., & Jha, A. (2012). Book building process: A mechanism for efficient pricing in India. International Journal of Trade, Economics and Finance, 3(2), 109. Brennan, M. J., & Franks, J. (1997). Underpricing, ownership and control in initial public oflerings of equity securities in the UK. Journal of financial economics, 45(391), 413. Butler, A. W., Keefe, M. O. C., & Kieschnick, R. (2014). Robust determinants of IPO underpricing and their implications for IPO research. Journal of Corporate Finance, 27, 367-383. Chakrabarti, R. IPOs in a Major Emerging Market Economy—India. In The Oxford Handbook of IPOs. Clarke, J., Khurshed, A., Pande, A., & Singh, A. K. (2016). Sentiment traders & IPO initial returns: The Indian evidence. Journal of Corporate Finance, 37, 24-37. Cuzick, J. (1985). A Wilcoxon‐type test for trend. Statistics in medicine, 4(4), 543-547. Deb, S. S., & Marisetty, V. B. (2010). Information content of IPO grading. Journal of banking & Finance, 34(9), 2294-2305. Dhamija, S., & Arora, R. K. (2017). Impact of quality certification on IPO underpricing: Evidence from India. Global Business Review, 18(2), 428-444. Florackis, C., Gregoriou, A., & Kostakis, A. (2011). Trading frequency and asset pricing on the London Stock Exchange: Evidence from a new price impact ratio. Journal of Banking & Finance, 35(12), 3335-3350. Ghalke, A., Chakravorty, C., & Rao, S. V. D. (2018). Earnings Management in IPO Bound Firms: Evidence From Indian SME Exchanges. Asian Economic and Financial Review, 8(8), 1126-1139. Ghosh, S. (2004). Boom and slump periods in the Indian IPO Market. Reserve Bank of India Occasional Papers, 25(1-3), 39-56. Ghosh, S. (2005). Underpricing of initial public offerings: The Indian experience. Emerging Markets Finance and Trade, 41(6), 45-57. Grinblatt, M., & Hwang, C. Y. (1989). Signalling and the pricing of new issues. The Journal of Finance, 44(2), 393-420. Jain, N., & Padmavathi, C. (2012). Underpricing of initial public offerings in Indian capital market. Vikalpa, 37(1), 83-96. Jain, R. K., Shukla, A. K., & Singh, K. (2013). SME financing through IPOs-An Overview. Reserve Bank of India Occasional Papers, 34(1), 138-151. Hall, B. H. (2002). The financing of research and development. Oxford review of economic policy, 18(1), 35-51. Hawaldar, I. T., Naveen Kumar, K. R., & Mallikarjunappa, T. (2018). Pricing and performance of IPOs: Evidence from Indian stock market. Cogent Economics & Finance, 6(1), 1420350. https://doi.org/10.1080/23322039.2017.1420350 Harwood, A., & Konidaris, T. (2015). SME exchanges in emerging market economies: A stocktaking of development practices. The World Bank. Huang, I. H. (2014). Does market timing persistently affect capital structure? Evidence from stock market liberalization. Pacific-Basin Finance Journal, 26, 123-144. IFC (2018). Financing India’s MSMEs. Estimation of Debt Requirement of MSMEs in India. https://www.intellecap.com/wp-content/uploads/2019/04/Financing-Indias-MSMEs-Estimation-of-Debt-Requireme-nt-of-MSMEs-in_India.pdf IPO Trend Report, Q4 2020, Ernst and Young. https://www.ey.com/en_in/ipo/india-ipo-trends-report Jonckheere, A. R. (1954). A distribution-free k-sample test against ordered alternatives. Biometrika, 41(1/2), 133-145. Kerr, W. R., & Nanda, R. (2015). Financing innovation. Annual Review of Financial Economics, 7, 445-462. Koh, F., & Walter, T. (1989). A direct test of Rock's model of the pricing of unseasoned issues. Journal of Financial Economics, 23(2), 251-272. Krishnamurti, C. & Kumar, P. (2002), The initial listing performance of Indian IPOs, Managerial Finance, Vol. 28 No. 2, pp. 39-51. https://doi.org/10.1108/03074350210767681 Lin, C. T., & Hsu, S. M. (2008). Determinants of the initial IPO performance: evidence from Hong Kong and Taiwan. Applied Financial Economics, 18(12), 955-963. Loughran, T., Ritter, J. R., & Rydqvist, K. (1995). Initial public offerings: International insights. Pacific-Basin Finance Journal, 1(3), 139-140. Loughran, T., & Ritter, J. R. (1995). The new issues puzzle. The Journal of finance, 50(1), 23-51. Madhusoodanan, T. P., & Thiripalraju, M. (1997). Underpricing in initial public offerings: The Indian evidence. Vikalpa, 22(4), 17-30. Marisetty, V. B., & Subrahmanyam, M. G. (2010). Group affiliation and the performance of IPOs in the Indian stock market. Journal of Financial Markets, 13(1), 196-223. Mayur, M., & Mittal, S. (2014). Relationship between Underpricing and Post IPO Performance: Evidence from Indian IPOs. Asia-Pacific Journal of Management Research and Innovation, 10(2), 129-136. OECD (2015). New Approaches to SME and Entrepreneurship Financing: Broadening the Range of Instruments. OECD (2016). Opportunities and Limitations of Public Equity Markets of SMEs. OECD Journals: Financial Market Trends 2015 (1). Pastor, L., & Veronesi, P. (2003). Stock prices and IPO waves (No. w9858). National Bureau of Economic Research. Rajan, R. G., & Zingales, L. (2001). Financial Systems, Industrial Structure, and Growth. Oxford Review of Economic Policy, 17(4), 467-482. Ritter, J. R. (1984). The'; hot issue'; market of 1980. Journal of Business, 215-240. Ritter, J. R. (1991). The long‐run performance of initial public offerings. The journal of finance, 46(1), 3-27. RBI (2019). Report of the Expert Committee on Micro, Small and Medium Enterprises. https://www.rbi.org.in/Scripts/PublicationReportDetails.aspx?UrlPage=&ID=924 Rock, K. (1986). Why new issues are underpriced. Journal of financial economics, 15(1-2), 187-212. Rosenbaum, P. R., & Rubin, D. B. (1983). The central role of the propensity score in observational studies for causal effects. Biometrika, 70(1), 41-55. Sahoo, S., & Rajib, P. (2009). Investment bank prestige and IPO underpricing: An empirical study. IIMB Management Review, 21(3), 189-204. Sahoo, S., & Rajib, P. (2010). After market pricing performance of initial public offerings (IPOs): Indian IPO market 2002–2006. Vikalpa, 35(4), 27-44. Saito, K. A., & Villanueva, D. P. (1981). Transaction Costs of Credit to the Small-scale Sector in the Philippines. Economic Development and Cultural Change, 29(3), 631-640. SEBI (2018). Securities and Exchange Board of India Board Meeting. Press Release No 20/2018. Retrieved from https://www.sebi.gov.in/media/press-releases/jun-2018/sebi-board-meeting_39324.html Singh, A. K., Singhania, S., & Sardana, V. (2019). Do Women on Boards affect Firm's Financial Performance? Evidence from Indian IPO Firms. Australasian Accounting, Business and Finance Journal, 13(2), 53-68. Su, D. (2004). Leverage, insider ownership, and the underpricing of IPOs in China. Journal of International Financial Markets, Institutions and Money, 14(1), 37-54. Tendulkar, S. D., &Bhavani, T. A. (1997). Policy on Modern Small Scale Industries: A Case of Government Failure. Indian Economic Review, 39-64. Terpstra, T. J. (1952). The asymptotic normality and consistency of Kendall’s test against trend, when ties are present in one ranking. Indagationes Mathematicae, 14(3), 327-333. Timmons, J. A., & Bygrave, W. D. (1986). Venture capital's role in financing innovation for economic growth. Journal of Business venturing, 1(2), 161-176. Tripathi, A. R., & Pandey, S. N. (2018). Information asymmetry, IPO grading & pricing efficiency: an empirical analysis of IPOs in India. Journal of Economic Policy and Research, 13(2), 17-24. Wadhwa, K. & Syamala, S.R. (2018), Market timing and pseudo market timing: an empirical examination of IPOs in India. Managerial Finance, Vol. 44 No. 2, pp. 160-177. https://doi.org/10.1108/MF-01-2017-000 Welch, I. (1996). Equity offerings following the IPO theory and evidence. Journal of Corporate Finance, 2(3), 227-259. WFE (2017). WFE Report on Equity Market Financing of SMEs. Retrieved from https://www.world-exchanges.org/our-work/articles/wfe-report-equity-market-financing-smes WFE (2018). An Overview of WFE SME Markets. Retrieved from https://www.world-exchanges.org/news/articles/world-federation-exchanges-publishes-report-global-sme-markets
| Appendix Table 1: SME IPOs in India during Last 3 Years*: Top 20 Sectors | | Industry | No. of issues | Issue amount (Rs. lacs) | Proportion of total | | Textiles | 14 | 18,087 | 8.4 | | Trading (including exports) | 17 | 16,969 | 7.88 | | Steel Tubes/Pipes/Wires/Products | 6 | 15,629 | 7.26 | | Electric/ Electronics Equipment | 9 | 15,596 | 7.25 | | Travel/Transportation/Courier (Passenger/Cargo) | 4 | 11,828 | 5.5 | | Information Technology-Software | 13 | 11,296 | 5.25 | | Pharmaceuticals & Drugs | 6 | 10,694 | 4.97 | | Diamond Cutting & Jewellery | 11 | 10,622 | 4.93 | | Engineering | 7 | 9,504 | 4.42 | | Paints/Varnishes | 1 | 7,401 | 3.44 | | Power Generation & Supply | 3 | 7,030 | 3.27 | | Solvent Extraction/Vanaspati/Edible Oils | 1 | 6,079 | 2.82 | | Electronics-General | 1 | 4,430 | 2.06 | | Paper & Board | 4 | 4,352 | 2.02 | | Electric Lamps & Accessories | 1 | 3,986 | 1.85 | | Housing/Civil Construction/Real Estate | 4 | 3,873 | 1.8 | | Plastics | 5 | 3,755 | 1.74 | | Wood & Wood Products | 3 | 3,698 | 1.72 | | Castings/ Forgings | 3 | 3,413 | 1.59 | | Packaging-Plastic | 1 | 3,374 | 1.57 | Note: *Period: 01/04/2018 to 31/01/2021.
Source: Prime Database. |
| Appendix Table 2: Summary Statistics of Firm Attributes in Sample | | Variable | Mean | Std.Dev. | Min | Max | | Age | 13.44 | 8.09 | 0.00 | 44.00 | | RoA | 5.34 | 19.66 | -139.87 | 34.53 | | Current_ratio | 1.39 | 0.71 | 0.38 | 5.57 | | Log_asset | 2.74 | 0.45 | 0.89 | 3.25 | | Debt_equity | 1.37 | 1.16 | 0.00 | 7.61 | | CFO_ops | 23.51 | 60.60 | -70.90 | 223.60 | | Source: Author’s calculation based on data from Prowess, CMIE. |
| Appendix Table 3: Adjusted Underpricing (iu_adj) in BSE | | Year | BSE Main board | BSE SME exchange | | N | mean | median | sd | N | mean | median | sd | | 2012 | 11 | 3.806 | -.375 | 12.506 | 12 | 15.488 | 3.32 | 41.258 | | 2013 | 3 | 2.106 | -2.298 | 11.59 | 33 | 15.433 | 6.394 | 43.448 | | 2014 | 5 | 25.633 | 23.17 | 33.352 | 38 | 8.832 | 3.687 | 18.138 | | 2015 | 20 | 8.925 | 2.304 | 18.538 | 37 | 6.525 | 5.986 | 12.738 | | 2016 | 27 | 14.012 | 14.238 | 19.507 | 43 | 3.503 | 1.38 | 9.885 | | 2017 | 34 | 22.044 | 3.765 | 40.518 | 55 | 4.706 | 1.766 | 10.189 | | 2018 | 24 | 7.447 | .603 | 23.021 | 63 | 4.152 | 2.23 | 11.855 | | 2019 | 16 | 19.22 | 6.204 | 35.095 | 36 | 2.09 | .956 | 5.456 | | 2020 | 1 | -1.554 | -1.554 | . | 9 | 4.29 | 1.715 | 6.361 | | Source: Author’s calculation based on data from Prime database, BSE and NSE. |
| Appendix Table 4: Adjusted Underpricing (iu_adj) in NSE | | Year | NSE Main board | NSE Emerge | | N | mean | median | sd | N | mean | median | sd | | 2012 | 9 | 3.941 | 1.91 | 12.811 | 2 | 1.352 | 1.352 | 3.593 | | 2013 | 3 | 4.319 | -1.86 | 12.151 | 2 | -9.631 | -9.631 | 11.639 | | 2014 | 5 | 23.659 | 16.31 | 32.797 | 2 | .863 | .863 | 6.786 | | 2015 | 20 | 8.452 | 2.929 | 21.287 | 5 | 3.357 | 2.408 | 3.258 | | 2016 | 27 | 13.081 | 11.452 | 22.6 | 22 | 7.599 | 3.577 | 11.3 | | 2017 | 36 | 22.768 | 7.038 | 40.438 | 78 | 8.054 | 4.417 | 10.549 | | 2018 | 24 | 7.51 | .34 | 21.94 | 81 | 6.061 | 3.017 | 11.264 | | 2019 | 16 | 20.01 | 6.321 | 35.545 | 14 | 2.186 | .541 | 5.822 | | 2020 | 1 | -24.128 | -24.128 | . | 3 | .925 | 2.362 | 3.264 | | Source: Author’s calculation based on data from Prime database, BSE and NSE. |
Appendix Charts
Annex 1: Propensity Score Matching between Treatment and Control Groups of Firms Propensity score matching (PSM) was first proposed by Rosenbaum and Rubin (1983) as a statistical method widely applied on observational data to find out the impact of a policy or treatment, after accounting for covariates that could potentially influence the probability of receiving the treatment and hence could lead to the outcome. In other words, propensity score matching mimics the randomisation on observational data by creating two groups of observations comparable on the covariates, i.e., the treatment and the control group. In the present study, the treatment group is chosen from the set consisting of firms, which are listed in SME exchanges and the control group is selected from the set of firms which were eligible to list in SME exchanges as per the norms specified but did not list themselves in any of the SME exchanges. For the PSM in the paper, log (asset size) (x1) and log (PBDITA as a percentage of total income) (x2) are taken as covariates, since both these could significantly influence firms’ probability of getting listed in exchanges. As Table A1 shows, a significant imbalance exists of cofounders between treated and untreated groups. | Table A1: Balance of Cofounders before Matching | | | Mean in treated | Mean in Untreated | Standardised diff. | | x1 | 2.71 | 3.65 | -1.925 | | x2 | 1.08 | 1.18 | -0.233 | | Source: Author’s estimates. | The logistic regression result for calculating the propensity score and the goodness of fit of the regression is provided in Table A2 and A3. The insignificant Hosmer-Lemeshow chi-square statistic indicates the model is a good fit. | Table A2: Logistic Regression to Calculate Propensity Score Logistic Regression | | t | Coef. | St.Err. | t-value | p-value | [95% Conf | Interval] | Sig | | x1 | 0.038 | 0.017 | -7.44 | 0.000 | 0.016 | 0.090 | *** | | x2 | 0.505 | 0.209 | -1.65 | 0.098 | 0.225 | 1.136 | * | | Constant | 6577.373 | 9184.778 | 6.30 | 0.000 | 426.008 | 102000.000 | *** | | Mean dependent var | 0.101 | SD dependent var | 0.301 | | | Pseudo r-squared | 0.343 | Number of obs | 487.000 | | | Chi-square | 109.062 | Prob > chi2 | 0.000 | | | Akaike crit. (AIC) | 214.885 | Bayesian crit. (BIC) | 227.450 | | Note: *** p<0.01, ** p<0.05, * p<0.1
Source: Author’s estimates. |
| Table A3: Logistic Model for t, Goodness-of-Fit Test | | Group | Prob | Obs_1 | Exp_1 | Obs_0 | Exp_0 | Total | | 1 | 0.002 | 0 | 0 | 49 | 49.000 | 49 | | 2 | 0.004 | 0 | .1 | 49 | 48.900 | 49 | | 3 | 0.007 | 0 | .3 | 49 | 48.700 | 49 | | 4 | 0.012 | 0 | .4 | 48 | 47.600 | 48 | | 5 | 0.023 | 0 | .8 | 49 | 48.200 | 49 | | 6 | 0.053 | 2 | 1.8 | 47 | 47.200 | 49 | | 7 | 0.088 | 3 | 3.3 | 45 | 44.700 | 48 | | 8 | 0.168 | 6 | 6.1 | 43 | 42.900 | 49 | | 9 | 0.310 | 15 | 11.7 | 34 | 37.300 | 49 | | 10 | 0.928 | 23 | 24.5 | 25 | 23.500 | 48 | Note: number of observations = 487
number of groups =10
Hosmer-Lemeshow chi2(8) =3.16
Prob > chi2 =0.9237
Source: Author’s estimates. | After matching with a caliper of 0.1, 45 matches were found. The balance of cofounders after the matching is given below (Table A4). As can be seen, there is a significant improvement in the balance of cofounders. | Table A4: Balance of Cofounders after Matching | | | Mean in treated | Mean in Untreated | Standardised diff. | | x1 | 2.75 | 2.74 | 0.017 | | x2 | 1.14 | 1.16 | -0.042 | | Source: Author’s estimates. | |