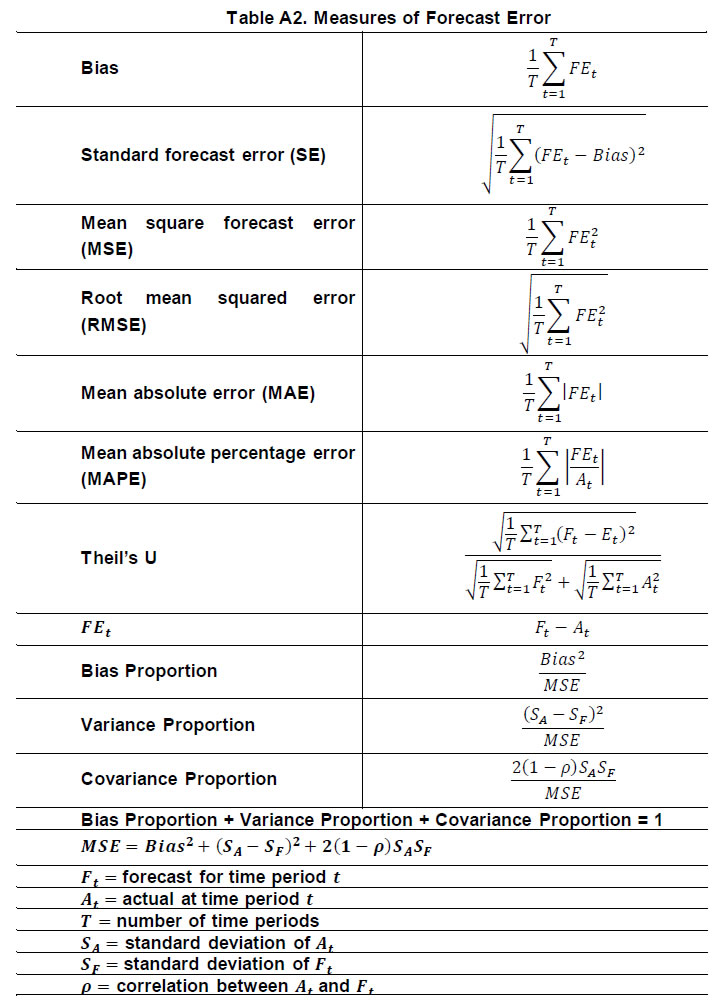
Press Release RBI Working Paper Series No. 02 Taking Cognisance of Households’ Inflation Expectations in India Devendra Pratap Singh, Aditya Mishra and Purnima Shaw@ Abstract *The paper studies the characteristics of inflation expectations in developed and emerging market economies. We find that the properties of inflation expectations in India share similarities to those in other economies, such as exhibiting weak rationality (by failing both the unbiasedness and efficiency tests). The decomposition of the mean square forecast error shows high bias and variance implying the presence of systematic error and an upward bias. The Indian households’ inflation expectations at different points in time are observed to be influenced by different items in their consumption baskets; over the rounds, inflation expectations are observed to be most affected by the future sentiments on prices and inflation in food products, followed by non-food commodities, and cost of services in recent times. Further, there is a huge variation in inflation expectation bias across geography. The paper also concentrates on two of the other main objectives of capturing inflation expectations. First, while the literature provides studies on forecasting inflation using inflation expectations, this paper throws light on the possible challenges. Second, it attempts to find a relationship between households’ inflation expectations and their future savings pattern. We find that an increase in the households’ inflation expectations impacts their savings in debt-based instruments, like bank term deposits, negatively; thus, indicating their reduced preference for bank term deposits when they expect rising inflation. Hence, among other motives, inflation expectations of households should be tracked to assess households’ decisions on future savings in order to channelise investments. JEL Classification: D84, E20, E21, E30, E31 Keywords: Household expenditure, household savings, inflation expectations Introduction Economic theory posits that nominal interest rates combine the expectations of economic agents with respect to real interest rates and inflation. Nevertheless, just as the interest rate in the economic literature is not a singular entity and has different values and connotations for different agents of disparate risk profiles and end-use of funds, similar is the case with inflation expectations. All economic agents (viz., households, firms, financial market players, professional forecasters) have a different basket of goods and services that they consider and have various motives which determine their inflation expectations. Hence, which expectations to use also depends upon the purpose of usage. As Coibion et al. (2020) put it, “Whose expectations matter depends, of course, on the context. In the case of pricing decisions, it is the expectations of firms that are at stake. For consumption and savings decisions, household expectations are more relevant. In the determination of financial asset valuations, marginal investors are likely those whose expectations are most important.” According to mainstream economic theory, during a scenario of increasing inflation expectations with concomitant expected low real interest rates, consumption expenditure may go up, especially on items like consumer durables, commodities like gold, etc., that are readily substitutable across time, consequently lowering savings. Though literature documents a positive change in consumption expenditure in case of a rise in inflation expectations (due to zero lower bound conditions in developed countries and their policy emphasis on increasing consumption), anecdotal evidence from past years of high inflation scenario in India (around 2012-13) suggests that households expected negative real interest rates when inflation expectations were very high, and thus, shifted their savings from financial instruments to commodities (like gold or real estate). It might be expected that they will shift their portfolio from interest yielding deposits to equity and equity-based products, but this may not be very widespread in an economy like India, where penetration of equity markets in terms of forming a part of households’ saving portfolio is still at a nascent stage. Furthermore, Vellekoop and Wiederholt (2019) have found that households’ higher inflation expectations correlate with a lower net worth (both lower assets and liabilities), indicating that such households have more consumption expenditure rather than savings. High inflation expectations are also likely to lead to higher wage demands by workers during wage negotiations and thus lead to the risk of a further future rise in inflation. On the other hand, in a scenario of high real interest rates, households would find it more gainful to save rather than spend on present consumption. In the light of the above documentation, the motives of gauging households’ inflationary expectations can be classified as (i) negotiating wage and rent contracts; (ii) checking whether inflation expectations are anchored; (iii) forecasting inflation; and (iv) using them as a determinant of households’ financial portfolio. Based on expectations for future inflation, workers negotiate with their employers about increasing their wages, which later adds to the inflation pressure. Similarly, house rent contracts have in-built escalation clauses that are influenced by prevailing inflation expectations. Hence, information on inflation expectations of households provides an idea about the plausible future inflation rise, which can then be dampened by monetary policy intervention, should they be high. Anchoring inflation expectations is essential for successful inflation targeting. Anchored inflation expectations, by definition, are neutral to the variations in actual inflation and hence would fail to forecast inflation. However, one of the desired properties in inflation expectations is that they should be able to project the inflation trajectory. If both inflation and inflation expectations are perfectly anchored at one value, only then both purposes can be fulfilled. Regarding the impact of households’ inflation expectations on the wage negotiations that may lead to future wage growth followed by a subsequent rise in inflation, Pattanaik et al. (2020) analysed the characteristics of the Indian households’ inflation expectations and did not find any evidence to establish the influence of expectations on the wage growth. Also, inflation expectations are highly influenced by food and fuel inflation and since both are subject to frequent supply-side shocks, they sometimes result in unanchored inflation expectations, especially in emerging markets, including India. This paper concentrates on the last two properties of inflation expectations, i.e., using households’ inflation expectations for forecasting inflation and gauging their impact on their saving and investment decisions. Section II provides a literature study on linking inflation expectations with inflation and existing methodologies on using them to derive inflation forecasts in India. A cross-country comparison of the characteristics of inflation expectations is also provided in this section. This is followed by a detailed empirical discussion about the challenges which arise from the inherent properties of inflation expectations in India. Section III studies the impact of households’ inflation expectations on actual savings data. The way forward and concluding remarks are given in Sections IV and V, respectively. II. Envisaging the Future Inflation Trajectory II.1 Literature Study Several studies have focused on investigating the formation of survey-based households’ inflation expectations, their characteristics and usage for forecasting inflation. Menz and Poppitz (2013) tested the dependence of inflation expectations with respect to three characteristics, viz., age, income and education, of households in Germany. On the other hand, Ghosh et al. (2020) analysed the macroeconomic determinants of inflation expectations in India and found oil prices and the exchange rate to have a considerable effect. For the Indian case, Sharma and Bicchal (2018), and Das et al. (2019) are among the recent ones who focused on relating households’ inflation expectations with the actual inflation. Using Batchelor’s (2006) methodology of formation of rational inflation expectations, Shaw (2019) provided a procedure by which inflation expectations can be used to forecast the actual inflation and showed the efficiency of the same empirically. Both Das et al. (2019) and Shaw (2019) explored the possibility of bringing down the upward bias, which is an inherent property of inflation expectations. Bias in statistics is a feature of the expected value of a parameter that differs from the true population parameter which is being estimated. Therefore, bias in inflation expectations is defined as the gap between the realised1 inflation and inflation expectations. Bias explains a major portion of the deviation of inflation expectations from the actual inflation. Another portion of the deviation can be attributed to policy measures, the remaining share of aberrations being random and unobserved. Households, by virtue of the way they consume information, suffer from an intrinsic drawback that, due to the cost of collecting and processing information, they update their expectations only periodically (Mankiw and Ricardo, 2002). Moreover, their perception of the economic environment has a major impact on their views. Especially, people who have experienced a phase of high inflation recently, in turn, have higher inflation expectations (Ehrmann and Tzamourani, 2012). Thus, beliefs only adjust gradually to a new economic environment, and this further influences their response to new information and economic shocks. Therefore, in the case of India, food and fuel inflation of yesteryears, along with a general perception of Goods and Services Tax (GST) causing across the board rise in prices, influence the expectations pending a new major information shock. Price volatility and heterogeneous consumption baskets make inflation expectations of households more volatile than for informed agents like professional forecasters and result in more disagreements, regarding both the future as well as past inflation, and leads to more uncertainty in their forecasts. A striking feature of households’ beliefs over inflation is that they not only disagree about future inflation but also about recent inflation dynamics (Ranyard et al., 2008). Coibion et al. (2020) found that the strongest predictor of households’ inflation forecast is their belief regarding recent inflation, unlike for other agents like professional forecasters who have no disagreement between their belief and the actual inflation, the data for which is readily available. Similar results are observed for Reserve Bank’s Inflation Expectations Survey of Households (IESH), but this is not restricted to India. This is a worldwide phenomenon, seen across developed and emerging market economies (Chart 1). For instance, a survey of consumers in Germany showed that, at a time when actual inflation was 0.3 per cent, almost half of the respondents believed that inflation over the previous year had been 5.0 per cent or above (Dräger and Nghiem, 2020). Similar findings were seen for the entire Euro area in 2015 where, despite the actual inflation being below 2.0 per cent for the entire period, the perceived inflation rate across all euro-member countries was just under 5.0 per cent amongst survey respondents (Arioli et al., 2017). Evidence from a survey of Inflation Expectations in Brazil also showed that even as market forecasts are lower than the consumer’s inflation forecasts, market agents tend to underestimate inflation, while consumers overestimate it (Gaglianone, 2017). Even in a deflationary scenario, as in the case of Japan, the inflation expectations are persistently sticky around a certain number. 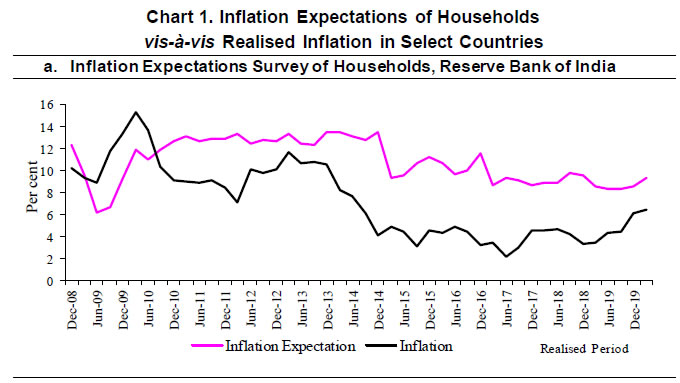  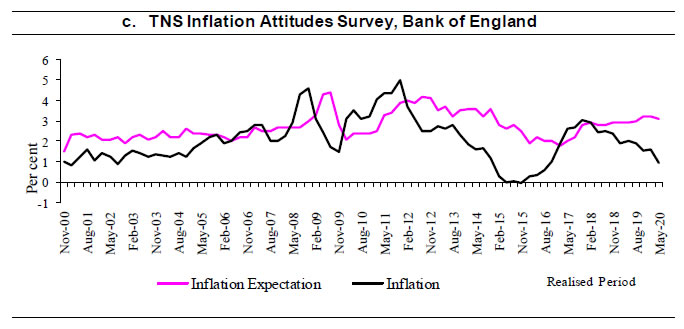  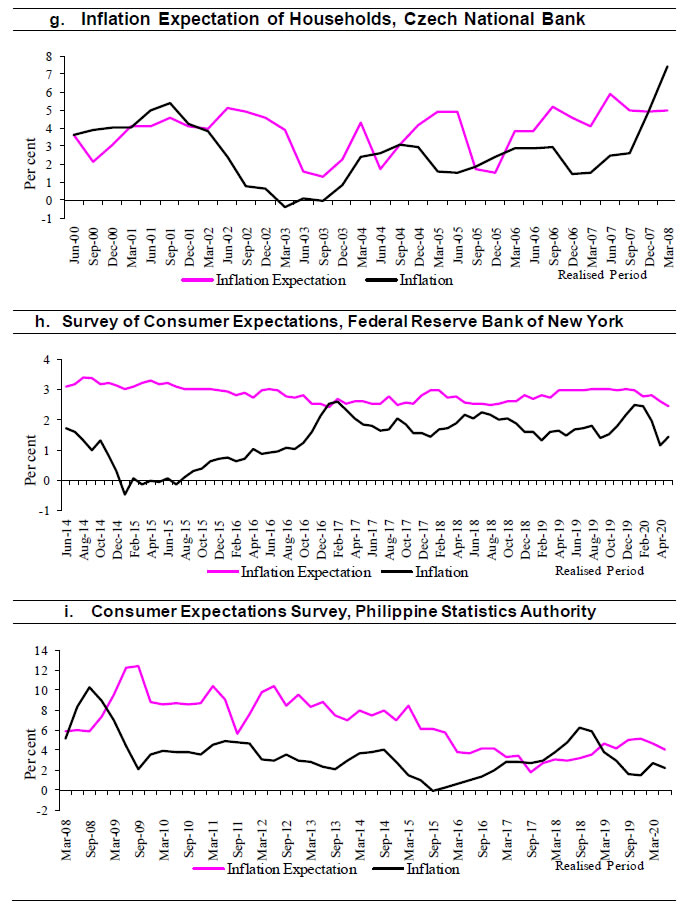 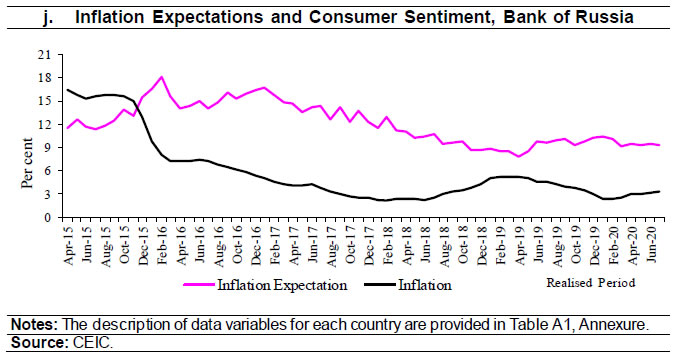 II.2 Empirical Evidence This section attempts to test whether inflation expectations in major countries viz., India, the USA (as reported in the surveys of the University of Michigan and the Federal Reserve Bank of New York), England, Japan, New Zealand, South Africa, Czech Republic, Philippines and Russia are rational. As consumers’ inflation expectations in the USA from the Survey of Consumers, University of Michigan, are available for a very long period i.e., from 1979 onwards, hence, the tests of rational expectations are performed for two separate periods i.e., pre-2008 and post-2008 in addition to the overall period. If inflation expectations satisfy the properties of unbiasedness and efficiency, then they are said to be weakly rational. Following Sharma and Bicchal (2018), results of tests for unbiasedness and efficiency in inflation expectations are given below. To test unbiasedness, the joint null hypothesis of β0 = 0, β1 = 1 in equation (1) is tested by employing the Wald test with corrected standard errors using Newey and West (1987), 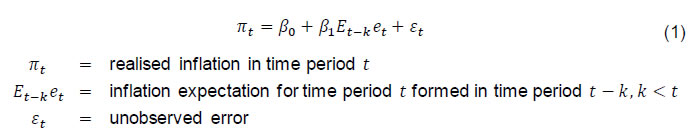 The above test is conducted for one year ahead (k = 12 months) inflation expectations of all the eight datasets and the results are displayed in Table 1. It rejects the null hypothesis of unbiasedness for all the economies. Following Holden and Peel (1990), another test for unbiasedness is to test the null hypothesis β = 0 in equation (2) with corrected standard errors using Newey and West (1987),  with (πt − Et−ket) denoting the forecast errors in inflation expectations with respect to the realised inflation. This test is again rejected for all the datasets, except that of the University of Michigan (Table 2). Inflation expectations in all the countries are positively biased, except for the pre-2008 period in the Michigan survey. Prior to 2008, inflation expectations in this survey were moving in close tandem with the United States city average inflation due to which test for unbiasedness using (2) could not be rejected (Chart 1.b.i). However, since 2008, inflation expectations here too are positively biased (Chart 1.b.ii). The quantum of bias is relatively high in the case of Russia followed by India and the Philippines. The results for the above two tests can be further validated by decomposing the mean square forecast error in inflation expectations vis-à-vis the realised inflation into bias, variance and covariance proportions (Table A2, Annexure). While the relatively high covariance proportion indicates unsystematic or random errors in inflation expectations, high values of bias and variance proportion point towards systematic errors. From Table 3, it is evident that the forecast errors in inflation expectations of the USA as per the Michigan survey, England and those in the Czech Republic are mainly random, while for the other countries, the errors are largely systematic. For testing efficiency, the null hypothesis is that past errors in inflation expectations with respect to the realised inflation do not have a significant impact on the present errors, i.e., the joint null α = βj = 0 ∀ j = 1,2, … , m in equation (3) with the number of lags m being determined by Akaike Information Criterion and Schwarz Criterion, Findings in Table 4 point to the fact that inflation expectations are not efficient in any of the ten countries. The explanatory power of past errors is very high in all countries, except in South Africa and the Czech Republic. But the inflation expectations of neither South Africa nor the Czech Republic could pass the earlier tests of unbiasedness. Combining the results in Tables 1 to 4, it is clear that inflation expectations in these ten countries are not weakly rational. In other words, the properties of Indian households’ inflation expectations are largely similar to those in the other countries with long experiences in conducting the survey. | Table 1. Test for Unbiasedness in Inflation Expectations | | Country | Survey Period | β0 | β1 | P value for Wald
Test F-Statistic | | India | Sep-08 to Mar-19 | 0.277 [4.361] | 0.644 [0.358] | 0.000 | | USA (Michigan) | Jan-78 to May-19 | -1.275 [0.407] | 1.307 [0.130] | 0.002 | | pre-2008 | Jan-78 to Dec-07 | -0.894 [0.399] | 1.310 [0.124] | 0.042 | | post-2008 | Dec-08 to May-19 | 4.531 [0.926] | -0.919 [0.329] | 0.000 | | England | Nov-99 to May-19 | 0.389 [0.661] | 0.616 [0.239] | 0.003 | | Japan | Jun-06 to Mar-19 | 0.335 [0.411] | 0.018 [0.171] | 0.000 | | New Zealand | Mar-96 to Mar-19 | -0.273 [0.809] | 0.708 [0.264] | 0.000 | | South Africa | Mar-11 to Mar-19 | -0.585 [1.653] | 0.928 [0.263] | 0.000 | | Czech Republic | Jun-99 to Mar-07 | 1.302 [1.101] | 0.362 [0.269] | 0.010 | | USA (New York) | Jun-13 to May-19 | 6.706 [1.301] | -1.871 [0.484] | 0.000 | | Philippines | Mar-07 to Jun-19 | 2.956 [1.024] | 0.086 [0.109] | 0.000 | | Russia | Apr-14 to Jul-19 | 0.388 [2.082] | 0.454 [0.179] | 0.000 | Note: Figures in [ ] indicate standard error.
Source: Authors’ calculations. |
| Table 2. Test for Unbiasedness in Inflation Expectations, using Holden and Peel (1990) | | Country | Survey Period | β | P value for Wald
Test F-Statistic | | India | Sep-08 to Mar-19 | -3.577 [0.836] | 0.000 | | USA (Michigan) | Jan-78 to May-19 | -0.176 [0.172] | 0.306 | | pre-2008 | Jan-78 to Dec-07 | 0.290 [0.181] | 0.110 | | post-2008 | Dec-08 to May-19 | -1.263 [0.269] | 0.000 | | England | Nov-99 to May-19 | -0.658 [0.199] | 0.001 | | Japan | Jun-06 to Mar-19 | -2.123 [0.403] | 0.000 | | New Zealand | Mar-96 to Mar-19 | -1.198 [0.192] | 0.000 | | South Africa | Mar-11 to Mar-19 | -1.040 [0.165] | 0.000 | | Czech Republic | Jun-99 to Mar-07 | -1.130 [0.464] | 0.021 | | USA (New York) | Jun-13 to May-19 | -1.490 [0.204] | 0.000 | | Philippines | Mar-07 to Jun-19 | -3.073 [0.749] | 0.000 | | Russia | Apr-14 to Jul-19 | -6.186 [1.004] | 0.000 | Note: Figures in [ ] indicate standard error.
Source: Authors’ calculations. | The Consumer Price Index-Urban (CPIU)2 inflation broadly reflects five phases of inflation as given in Chart 2. Accordingly, households’ one year ahead mean inflation expectations (1Y IE) for each realisation period (respective quarters) are divided into five similar phases and presented in Chart 2 along with the realised CPIU inflation for that quarter. Here, CPIU is considered in place of headline inflation, as the Inflation Expectation Surveys of Households, conducted by RBI, is an urban area-based survey. | Table 3. Decomposition of Mean Squared Forecast Error | | Country | Survey Period | Bias Proportion | Variance Proportion | Covariance Proportion | | India | Sep-08 to Mar-19 | 0.566 | 0.077 | 0.357 | | USA (Michigan) | Jan-78 to May-19 | 0.011 | 0.377 | 0.613 | | pre-2008 | Jan-78 to Dec-07 | 0.035 | 0.384 | 0.580 | | post-2008 | Dec-08 to May-19 | 0.378 | 0.118 | 0.504 | | England | Nov-99 to May-19 | 0.286 | 0.127 | 0.586 | | Japan | Jun-06 to Mar-19 | 0.582 | 0.015 | 0.403 | | New Zealand | Mar-96 to Mar-19 | 0.531 | 0.137 | 0.332 | | South Africa | Mar-11 to Mar-19 | 0.631 | 0.070 | 0.242 | | Czech Republic | Jun-99 to Mar-07 | 0.280 | 0.043 | 0.678 | | USA (New York) | Jun-13 to May-19 | 0.733 | 0.080 | 0.187 | | Philippines | Mar-07 to Jun-19 | 0.493 | 0.015 | 0.492 | | Russia | Apr-14 to Jul-19 | 0.678 | 0.043 | 0.278 | | Source: Authors’ calculations. |
| Table 4. Test for Efficiency in Inflation Expectations | | Country | Survey Period | m | P-value for Wald Test F-Statistic | Adjusted R2 | | India | Sep-08 to Mar-19 | 4 | 0.000 | 0.687 | | USA (Michigan) | Jan-78 to May-19 | 2 | 0.000 | 0.869 | | pre-2008 | Jan-78 to Dec-07 | 1 | 0.000 | 0.832 | | post-2008 | Dec-08 to May-19 | 2 | 0.000 | 0.890 | | England | Nov-99 to May-19 | 2 | 0.000 | 0.697 | | Japan | Jun-06 to Mar-19 | 3 | 0.000 | 0.594 | | New Zealand | Mar-96 to Mar-19 | 4 | 0.000 | 0.653 | | South Africa | Mar-11 to Mar-19 | 1 | 0.000 | 0.216 | | Czech Republic | Jun-99 to Mar-07 | 2 | 0.000 | 0.474 | | USA (New York) | Jun-13 to May-19 | 1 | 0.000 | 0.878 | | Philippines | Mar-07 to Jun-19 | 2 | 0.000 | 0.676 | | Russia | Apr-14 to Jul-19 | 1 | 0.000 | 0.912 | | Source: Authors’ calculations. |
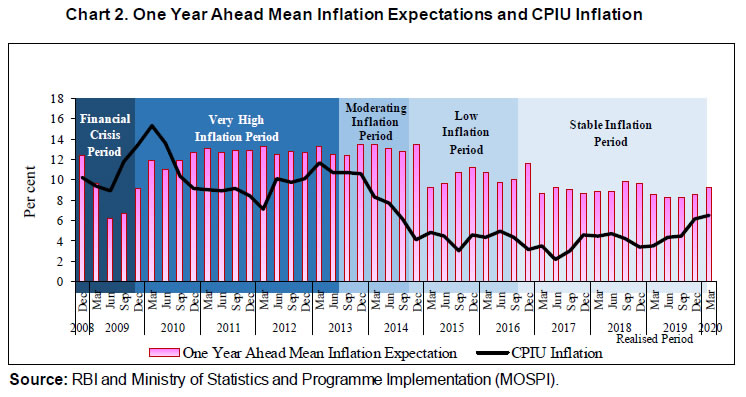
| Table 5. Gap between IY IE mean and CPIU inflation during the major phases in inflation history | | Inflation Phases | Period | Bias* | SE* | MSE* | RMSE* | MAE* | MAPE* | Theil’s U* | | Financial Crisis Period | Dec-08 to Sep-09 | -1.323 | 2.764 | 9.389 | 3.064 | 2.539 | 0.243 | 0.160 | | Very high inflation | Dec-09 to Jun-13 | 1.907 | 2.904 | 12.072 | 3.474 | 3.266 | 0.337 | 0.151 | | Moderating inflation | Sep-13 to Sep-14 | 4.373 | 1.819 | 22.430 | 4.736 | 4.373 | 0.570 | 0.216 | | Low inflation | Dec-14 to Sep-16 | 6.229 | 1.533 | 41.157 | 6.415 | 6.229 | 1.488 | 0.426 | | Stable inflation | Dec-16 onwards | 4.966 | 1.578 | 27.152 | 5.211 | 4.966 | 1.388 | 0.387 | Note: * definition is provided in Table A2, Annexure.
Source: Authors’ calculations. | A look at the gap between inflation expectations and the CPIU inflation (in the above mentioned five major phases of the inflation history) in Table 5 reveals that all the measures displayed a relatively low gap during the ‘very high inflation’ and the ‘moderating inflation’ periods, which then widened during the ‘low inflation’ period. Only in the ‘stable inflation’ period, the gap has narrowed which indicates the sticky nature of the households’ inflation expectations. In other words, households take their time to anchor their expectations about future inflation. Further, the forecast errors are unsystematic in ‘very high inflation’ period on the back of low bias, and later the errors remain systematic (Table 6). | Table 6. Decomposition of Mean Squared Forecast Error in Different Inflation Phases | | Inflation Phases | Bias Proportion* | Variance Proportion* | Covariance Proportion* | | Financial Crisis | 0.186 | 0.207 | 0.606 | | Very high inflation | 0.301 | 0.099 | 0.600 | | Moderating inflation | 0.853 | 0.079 | 0.068 | | Low inflation | 0.943 | 0.013 | 0.044 | | Stable inflation | 0.908 | 0.004 | 0.088 | Note: * definition is provided in Table A2, Annexure.
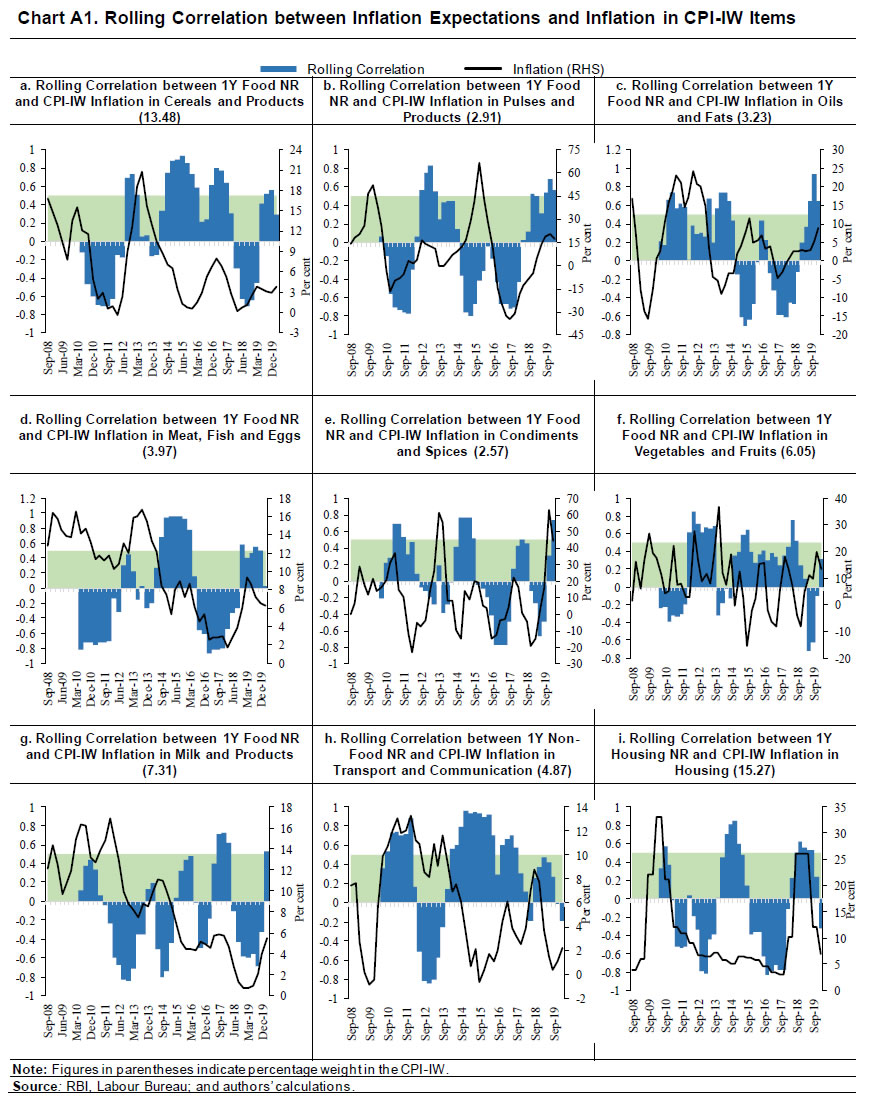
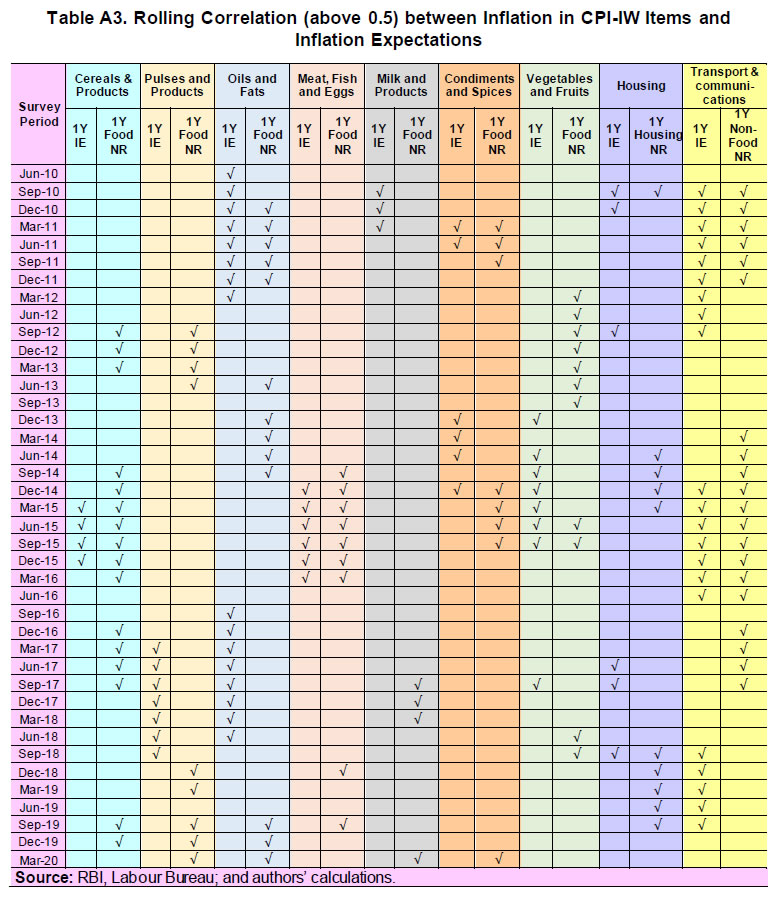
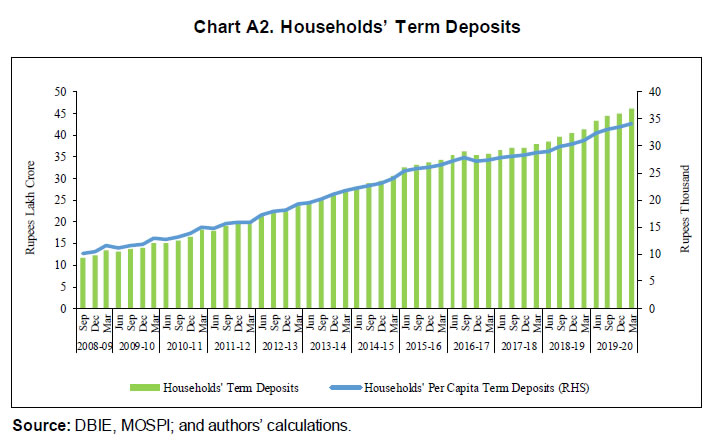
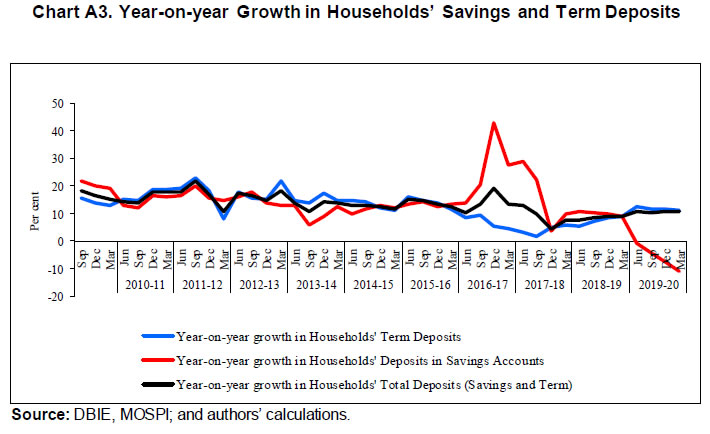
Source: Authors’ calculations. | At this point, it is necessary to investigate the reason for this gap between households’ inflation expectations and actual inflation, for which main factors influencing households’ inflation expectations are required to be identified. In the following paragraphs, qualitative (directional) responses on price and inflation expectations for one year ahead horizon have been used to find out the commodity groups which trigger the formation of expectations. The response options for qualitative questions on the expected direction of prices and inflation for three months ahead and one year ahead horizons are, ‘Prices will increase (PI)’, ‘Price increase more than current rate (PIMCR)’, ‘Price increase similar to current rate (PISCR)’, ‘Price increase less than current rate (PILCR)’, ‘No change in prices (NCP)’ and ‘Decline in prices (DP)’. A cross-tabulation of these responses for the ‘General Products’ vis-à-vis another product group say ‘P’ (either of Food Products/ Non-Food Commodities/ Household Durables/ Cost of Housing/ Cost of Services), can be shown as follows:  The diagonal elements represent the frequency of similar responses for General Products and product ‘P’ and the share of all diagonal elements (out of the total sample size n) D, as given in equation (4), indicates the degree of similarity between the responses for ‘General Products’ and those for ‘P’; higher the value of D, the higher is the similarity. For responses relating to each of the product groups, the χ2 statistic for dependence between responses on General Products and the product group has been computed using equation (5). The χ2 statistic calculates the relative deviation of each of the frequency cells from an expected value of that cell under the null of independence of the responses of General Products and ‘P’. Hence, the higher the value of χ2, stronger is the dependence between responses on General Products and those on ‘P’. In order to test for the null of independence, these computed statistic values are to be compared with the upper 0.05-point of the χ20.05,(5−1)(5−1) distribution; if χ2 > χ20.05,(5−1)(5−1), then the null of independence is rejected at the 5 per cent level of significance. Although, the test has been rejected for the one year ahead expectations on each of the product groups in all the survey rounds, still the tabulated χ2 statistic value can be used to check the degree of dependence as is shown by a heat map in Table 8. Over the rounds, inflation expectations have been mostly affected by the future sentiments on prices and inflation in food products followed by non-food products. However, recently, expectations on cost of services are also influencing the formation of expectations about the general prices and inflation. 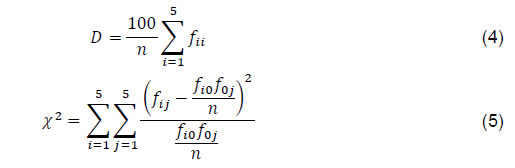 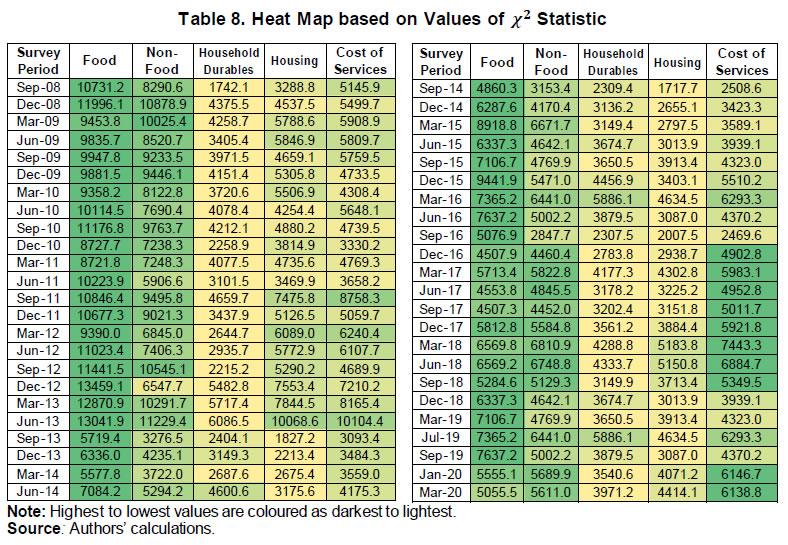 Since inflation expectations are mainly affected by the sentiments on food products, a question may arise as to whether they are able to forecast food inflation. To answer this, it is necessary to identify the food item(s) which households consider while forming their inflation expectations. For this, 8-quarter rolling correlations between the mean value inflation expectations for one year ahead (1Y IE) and CPI-IW3-based inflation for common food items, ‘housing’, and ‘transport and communication’ sub-groups, are computed and plotted in Chart 3. A rolling correlation above 0.5 is considered here as an indicator of high relation between inflation expectations and the item. This analysis was repeated to study rolling correlations between (i) one year ahead net responses4 on inflation expectations for food products (1Y Food NR) and CPIIW inflation in various food groups; (ii) one year ahead net responses on inflation expectations for non-food products5 (1Y Non-Food NR) and CPI-IW inflation in ‘transport and communication’; and (iii) one year ahead net responses on inflation expectations for housing (1Y Housing NR) and CPI-IW inflation in ‘housing’ (Chart A1, Annexure). The CPI-IW product groups bearing a high rolling correlation with the future inflation sentiments captured by the IESH are summarised for both the above analyses in Table A3, Annexure. It can be observed that while all the highly positive correlation values are either preceded or accompanied by a hike in inflation of some items, none of the items shows a consistent highly positive relationship with the inflation expectations in the study period. The high negative correlations encountered are due to the fact that the inflation expectations were being influenced (positively) by some other item(s), during those periods. From the findings in Table A3 in Annexure, it is clear that while inflation expectations were mostly driven by ‘oils and fats’, ‘vegetables and fruits’ and ‘transport and communication’ during the ‘very high inflation’ period (December 2009 to June 2013), more items viz., ‘cereals and products’, ‘meat, fish and eggs’, ‘vegetables and fruits’ and ‘transport and communication’ influenced them during the combined period of ‘moderating inflation’ and ‘low inflation’ (September 2013 to September 2016). On the other hand, future inflation sentiments were impacted by ‘pulses and products’, ‘oils and fats’ and ‘transport and communication’ in the ‘stable inflation’ period (December 2016 onwards). Hence, it may be safely concluded that inflation expectations at different time points get influenced by different items in the consumers’ consumption baskets 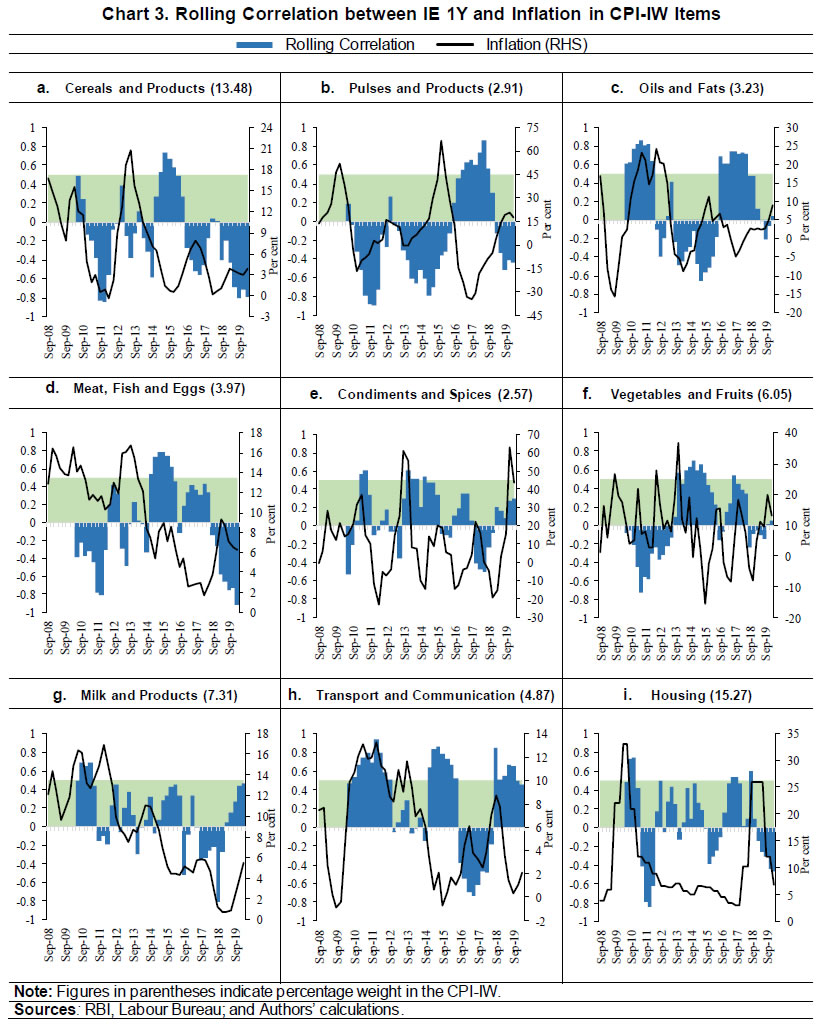 An item having relatively low weight in the CPI basket may have a disproportionate influence on households’ inflation expectations, if it constitutes a major portion of the households’ baskets, e.g., the sub-groups like ‘pulses and products’, ‘condiments and spices’, etc. Further, households’ expectations about future inflation also vary widely across the geography. A dissimilarity matrix calculated using the ‘Euclidean’6 distance measure for the bias in mean values of one year ahead inflation expectations in the survey centres with respect to the realised CPI-IW7 inflation in the respective centres8 shows that there is huge variation in the nature of bias in the inflation expectations across geography (Chart 4). According to the bias, there are two clusters of similar bias in the survey centres, the first consisting of Ahmedabad, Kolkata, Bhopal and Guwahati, and the second cluster consisting of Delhi, Mumbai, Jaipur and Lucknow. Therefore, this scenario of extensive variations in the nature of bias, which points towards a different manner in which households form their inflation expectations, poses a challenge in using them to forecast the official inflation numbers. III. Do Inflation Expectations of Indian Households Influence their Savings Portfolio? Now, we look at the fourth objective of measuring inflation expectations. Inflation expectations are widely considered to impact the households’ savings pattern. Especially in the case of a developing economy, it is desirable for households to save in financial instruments like debt or equity, which can be utilised further into production enhancing activities. However, considering the still nascent stage of development of corporate bond markets and low awareness of equity markets; the financial instrument accessible for most Indian households is bank deposits. If households expect inflation to pick up in the medium term and they suspect low returns due to low real interest rates, it may be preferable for them to invest in commodities like precious metals, jewellery, etc., (investment in real estate, with a requirement of higher initial outlay, may not be as impacted in the short to medium term) than saving in term deposits. Alternatively, instead of withdrawing the existing savings, households may not like to park their savings further in banks and might rather prefer to earn relatively higher returns by investing in other modes of investment which blocks precious capital in unproductive assets, resulting in undesirable outcomes like higher interest rates for producers, lower production, higher imports, etc. In a one of its kind study, Vellekoop and Wiederholt (2019) map the household-level data on inflation expectations in the Netherlands with the administrative data on households’ wealth to show that changes in households’ inflation expectations lead to changes in their portfolio of financial savings. In the Indian case, Yadav and Shankar (2016) used data from the two household surveys conducted by the RBI, the Consumer Confidence Survey and the IESH, to establish an empirical relationship between inflation expectations and consumers’ spending in India. They found that rising households’ inflation expectations lead to higher current spending and an outlook of reduction in future spending. A large number of factors may determine a household’s saving behaviour. Callen and Thimann (1997) found growth, unemployment, real interest rate, inflation, demographics, household wealth etc., as the most commonly used factors in empirical studies. Ghosh and Ghosh (2020) found the most important determinants of household saving rates in India to be per capita real income, inflation, real interest rate, dependency ratio and access to banking. As the current studies are mostly focused on the previous decade, demographic factors were not considered for further analysis. Considering the unavailability of administrative data on households’ wealth in India, this section attempts to find the impact of inflation expectations of Indian households on aggregate term deposits of households from September 2008 to March 2020, after removing the effect of other factors playing a crucial role in explaining term deposits, like household expenditure, term deposit real interest rate, prices, etc. For this exercise, quarterly term deposits with Scheduled Commercial Banks from the ‘Quarterly Statistics on Deposits and Credit of Scheduled Commercial Banks’ available in the RBI’s Database on Indian Economy (DBIE) is considered from September 2008 to March 2020. As data prior to March 2012 contains only total deposits, the average share of term deposits in total deposits during the latest eighteen quarters is used to arrive at the amount of term deposits for the period prior to March 2012. From the total term deposits, households’ share is computed using the data ‘Ownership of Deposits with Scheduled Commercial Banks’ available in the DBIE. Households’ term deposits form about half of the total deposits in the banks; recently the share has increased to about 60 per cent. The year-on-year growth in deposits reveals a slowdown from December 2011 onwards, which has started reviving only recently, since December 2017 (Charts A2 and A3, Annexure). Households’ term deposits are converted into per capita term deposits to remove the impact of the increase in the population on aggregate deposits (Charts A2 and A3, Annexure). This series is further de-seasonalised (DPCTt). Explanatory variables viz., CPI-Combined inflation (πt), State Bank of India’s (SBI’s) real interest rates on term deposits for the duration of ‘1 year to less than 2 years’ (RIRt)9, de-seasonalised per capita Private Final Consumption Expenditure at constant prices with base 2011-12 (DPCEt), households’ three months ahead mean inflation expectations (Etet+3) and one year ahead mean inflation expectations (Etet+12) are considered. In addition, a dummy for the event of withdrawal of legal tender character from the Specified Bank Notes (SBNs) is also used, since it is expected to be a significant event impacting saving and investment behaviour of households, even if in the short term. First, a base model below shows the relationship of all the explanatory variables, except inflation expectations, with the term deposits.  The base model’s results are presented in Table 9. The effect of interest rates is positively significant for its first quarter lag. The increase in per capita expenditure leads to a decrease in the term deposits during a quarter. In combination with the considered variables, the effect of withdrawal of the legal tender status of SBNs is significant, and the effect is negative. This is substantiated by the households’ deposits data which shows that households’ total deposits peaked after the withdrawal of SBNs, primarily due to sharp increase in deposits in savings accounts (Chart A3, Annexure). Term deposits did not show a commensurate increase and the annual growth rate was only 5.4 per cent in Q3:2016-17. 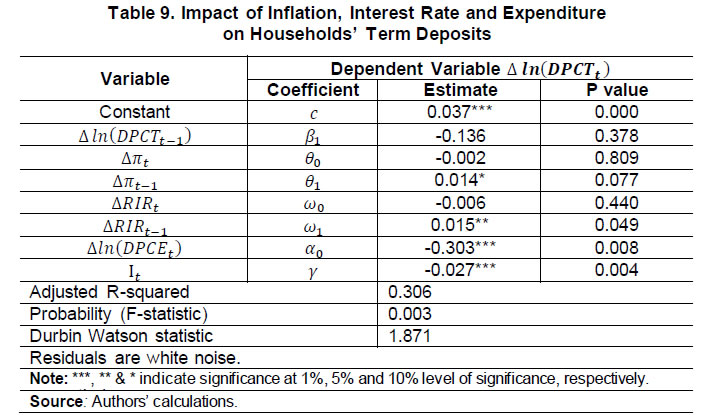 Considering equation (6) as the base model, the three months ahead inflation expectation series Etet+3 is now added. As already observed in Section II.2, inflation expectations in India are not even weakly rational. Further, they are rather adaptive in nature and dependent on the recent inflation movements. Hence, this effect of inflation in the formation of inflation expectations is required to be removed before adding it as an explanatory variable. This is because inflation is already taken as one of the variables to explain the changes in the deposits. So, the series Etet+3−πt is considered instead of Etet+3. The results are shown in Table 10. A similar analysis is repeated with one year ahead inflation expectations (Table 11). There is not much evidence to support the significance of the first quarter lagged value of per capita term deposits of households (Tables 10 and 11). Households’ term deposits are negatively impacted by an increase in expenditure during the quarter. It is evident that adding households’ inflation expectations into the base model improves the model performance (in terms of the adjusted R-squared). The negative coefficients of inflation expectations indicate that an increase in inflation expectations influences households’ savings behaviour, specifically with regard to their term deposits with banks. The coefficient of Etet+3−πt is only -0.003 which means if Etet+3−πt is 4 per cent, then Δ ln(DPCTt) is -0.012. Suppose ln(DPCTt) decreases from 10.00 to 9.99. This implies DPCTt decreases from Rs.22026.47 to Rs.21850.96; these being the amount in per capita, which is sizeable for the population at large. Hence, although expenditure (with elasticity 0.303) is the main driver of changes in the term deposits, the influence of inflation expectations is worth attention. Thus, the analysis shows that inflation expectations have a significant impact on households’ savings behaviour. Other variables like household gold consumption, retail share in equity and mutual funds’ investments, etc., may help in finding whether households find alternative avenues of investments. 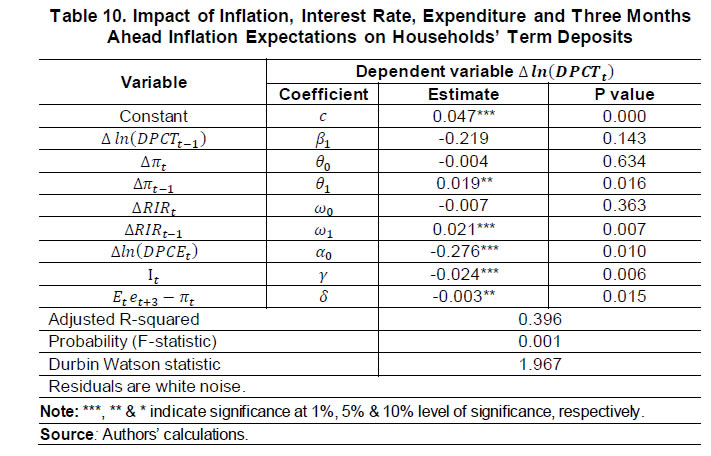 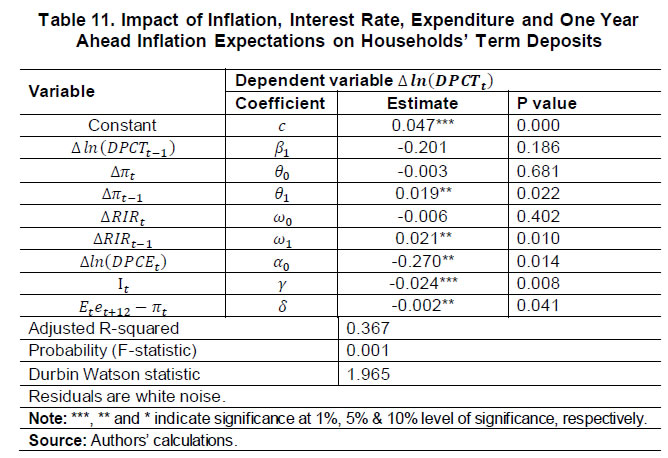 IV. Way forward So, one question that is often asked is, how can the accuracy of households’ inflation perceptions and expectations be improved? People may be better informed with higher media coverage, but studies do indicate that although it increases the chance of people revising their expectations, this may not necessarily produce better forecasts (Ehrmann et al., 2014). In addition, ideologies also influence their views on the economy, which is further complicated by the fact that people prefer reading like-minded news (Gentzkow et al., 2014). It is always important to remember that predicting any type of inflation is not the primary purpose of an inflation expectation survey. The primary objective is to capture households’ inflation expectations correctly. The fact that inflation expectations are not unbiased and efficient estimates only mean that directional changes indicated by the IESH have information value and the perceived inflation rate is not important. Moreover, even if it is assumed that the respondents are perfectly rational and have considered all the available information in forming their expectations, the environment will still have many shocks over the short and medium terms which will cause the realised inflation to deviate from the ‘predicted’ trajectory. Also, with the information on inflation expectations available, policy interventions may curb the possible hikes in inflation. Having said that, the major challenge confronting Central Banks, in this regard, is measuring these inflation expectations. Since the game of inflation expectations comprises a motley group of agents viz., households, firms, forecasters and financial market players, different methods must be adopted to gauge their varied inflation expectations. While the expectations of financial markets are readily available through indicators like bond yields, professional forecasters regularly publish and disseminate their expectations which may be based on lead information, spreadsheet analysis and econometric models. It is the firms and the households that pose the biggest challenge in measuring inflation expectations since their inflation expectations are not readily available. Thus, a worldwide practice is to conduct periodic surveys of these agents to gauge their inflation expectations and sentiments regarding the economy. In this regard, one way is to continuously improve the conduct of these surveys. But this by itself, may not be able to check the bias of the respondents. Among various other goals, Central Banks’ communication of their policy measures is focused on anchoring the short-term and long-run inflation expectations. These communications are mainly directed towards professional forecasters and market participants. However, it needs to be explored if making these communications more accessible to the household participants can reduce the bias in their estimates. A communication strategy with multiple layers, each treating the different participants differently, may be helpful in the formation of a better-informed market cohort (Coibion et al., 2020). V. Conclusion This paper identifies four objectives of gauging households’ inflation expectations. Firstly, inflation expectation of households is an important indicator of the possible future wage contract negotiations by the employees. Secondly, anchoring inflation expectations assist in improved inflation targeting. Thirdly, inflation expectations provide useful insights in forecasting inflation; and lastly, they influence the financial decisions of households and determine their financial portfolio. In case of India, while the first three objectives are empirically investigated, the last one has not been attempted yet. The available literature also does not comprehensively provide causal evidence of wage setting behaviour being impacted by households’ inflation expectations. Further, they are highly influenced by food and fuel inflation, and hence are not anchored. Regarding the third objective of capturing households’ inflation expectations, there exist studies that have utilised inflation expectations in India to forecast the inflation trajectory. The common approach of these studies has been to reduce a major portion of the forecast errors (the rest being attributed to the monetary policy transmission and unobserved error) in the inflation expectations i.e., the bias. The above-mentioned literature gaps can set future research agenda in this area. While bias in households’ inflation expectations has been well acknowledged by other studies, this paper establishes the same based on a cross-country empirical analysis. Similar to India, inflation expectations are biased and not efficient in other countries too, like the USA, England, Japan, New Zealand, South Africa, Czech Republic, Philippines and Russia. This indicates that inflation expectations of Indian households are similar in nature to those of other developed and emerging economies, except for the relatively higher bias than in other economies, barring Russia. This paper further throws light on the challenges in using households’ inflation expectations for forecasting inflation. Inflation expectations in India have been sticky as households take the time in trusting that a relatively low inflation era is here to stay. Quantitative inflation expectations in India are formed based on the households’ experiences of food and fuel inflation. This paper computes chi-square test statistic using qualitative responses of households and performs a robustness check to re-confirm that the expectations are mainly influenced by food products and other non-food commodities. Drilling down further, changes in inflation expectations do not necessarily reflect the volatility of any particular food item; rather various food items, irrespective of their weight in the Consumer Price Index basket, influence the households’ sentiments at various time points due to their weightage in the households’ consumption baskets. Different factors influence inflation expectations of households during different time periods, depending on the price movement in specific items. A sudden price shock in any item may result in it having a disproportionate influence on households’ inflation perception and future expectations. Further, huge differences exist between the sentiments of respondents across the cities. In such a scenario, forecasting inflation using inflation expectations of households poses several challenges. The paper then moves on to the last objective i.e., whether households’ inflation expectations in India impact their savings pattern, specifically in their term deposits with scheduled commercial banks. Inflation expectations play a vital role in regulating households’ consumption behaviour and the consequent savings. Accounting for the impact of per capita expenditure, inflation, interest rate and the recent withdrawal of Specified Bank Notes, increase in three months ahead and one year ahead inflation expectations result in slower growth in future per capita term deposits. In other words, inflation expectations in India track households’ future term deposits in banks, keeping other variables constant. When sentiments about future inflation are on the higher side, households change their savings portfolio with respect to bank deposits. Future research may focus on extending this analysis to further throw light on whether households shift their investments from banks to other forms like precious metals, gold, mutual funds etc.
References Arioli, R., Bates, C., Dieden, H., Duca, I., Friz, R., Gayer, C., Kenny, G., Meyler, A. & Pavlova, I. (2017). EU consumers’ quantitative inflation perceptions and expectations: an evaluation. European Central Bank, Occasional Paper 186. Batchelor, R. (2006). How robust are quantified survey data? Evidence from the United States. Cass Business School, City of London, January. Callen, T. & Thimann, C. (1997). Empirical determinants of household saving: evidence from OECD countries. International Monetary Fund, WP/97/181. Coibion, O., Gorodnichenko, Y., Kumar, S. & Pedemonte, M. (2020). Inflation expectations as a policy tool? Journal of International Economics, 124, https://doi.org/10.1016/j.jinteco.2020.103297 Das, A., Lahiri, K., & Zhao, Y. (2019). Inflation expectations in India: learning from household tendency surveys. International Journal of Forecasting, 35(3), 980-993. Dräger, L. & Nghiem, G. (2020). Are consumers’ spending decisions in line with an Euler equation? Review of Economics and Statistics, https://doi.org/10.1162/rest_a_00909 Ehrmann, M., Pfajfar, D. & Santoro, E. (2014). Consumer attitudes and the epidemiology of inflation expectations. Bank of Canada, Working Paper Number 2014-28. Ehrmann, M. & Tzamourani, P. (2012). Memories of high inflation. European Journal of Political Economy, 28(2): 174-191. Gaglianone, W. P. (2017). Empirical findings on inflation expectations in Brazil: a survey. Banco Central Do Brasil, Working Paper 464. Gentzkow, M., Shapiro, J. M. & Sinkinson, M. (2014). Competition and ideological diversity: historical evidence from US newspapers. American Economic Review, 104(10), 3073-3114. Ghosh, S. K. & Ghosh, P. (2020). The determinants of household savings in India. Business Standard. Retrieved from https://www.business-standard.com/article/opinion/the-determinants-of-household-savings-in-india-120021201923_1.html Ghosh, T., Sahu, S., & Chattopadhyay, S. (2020). Inflation expectations of households in India: role of oil prices, economic policy uncertainty, and spillover of global financial uncertainty. Bulletin of Economic Research, https://doi.org/10.1111/boer.12244 Holden, K. & Peel, D.A. (1990). On testing for unbiasedness and efficiency of forecasts. The Manchester School, 58(2), 120–127. Mankiw, N. G. & Ricardo, R. (2002). Sticky information versus sticky prices: a proposal to replace the new Keynesian Phillips Curve. Quarterly Journal of Economics, 117(4): 1295-1328. Menz, J. O. & Poppitz, P. (2013). Households’ disagreement on inflation expectations and socioeconomic media exposure in Germany. Deutsche Bundesbank, Discussion Paper 27/2013. Newey, W. & West, K. (1987). A simple positive semi-definite, heterosckedasticity and autocorrelations consistent covariance matrix. Econometrica, 55, 703–708. Pattanaik, S., Muduli, S. & Ray, S. (2020). Inflation expectations of households: do they influence wage-price dynamics in India? Macroeconomics and Finance in Emerging Market Economies, 13(3): 244-263. Ranyard, R., Missier, F. D. & Bonini, N. (2008). Perceptions and expectations of price changes and inflation: a review and conceptual framework. Journal of Economic Psychology, 29(4): 378-400. Sharma, N. K. & Bicchal, M. (2018). The properties of inflation expectations: evidence for India. Economia, 19(1), 74–89. Shaw, P. (2019). Using rational expectations to predict inflation. Reserve Bank of India Occasional Papers 40(1): 2019. Vellekoop, N. & Wiederholt, M. (2019). Inflation expectations and choices of households. Sustainable Architecture for Finance in Europe, Working Paper Number 250. Yadav, S. & Shankar, R. (2016). Inflation expectations and consumer spending in India: evidence from the Consumer Confidence survey. Reserve Bank of India Occasional Papers Volume 35 and 36, Number 1 and 2: 2014 and 2015.
Annexure | Table A1. Description of Variables in Chart 1 | | Country | Variables in Chart | Description | | India | Inflation Expectations | One year ahead mean inflation expectations | | Inflation | Monthly CPI Urban inflation figures (base 2012) averaged over 3 months | | USA | Inflation Expectations | One year ahead median inflation expectations (from surveys of University of Michigan and Federal Reserve Bank of New York) | | Inflation | United States City average monthly CPI Urban inflation (base 1982-84) and New York- Newark-Jersey City monthly CPI Urban inflation (base 1982-84) | | England and Japan | Inflation Expectations | One year ahead median inflation expectations | | Inflation | Monthly CPI inflation figures (base 2015) of United Kingdom and Japan, respectively, averaged over 3 months | | New Zealand | Inflation Expectations | One year ahead median inflation expectations | | Figures available for Mar-95, Jun-95 and then from Mar-96 onwards | | Inflation | Quarterly CPI inflation (base 2017) of New Zealand | | South Africa | Inflation Expectations | One year ahead mean inflation expectations | | The survey initiated in Dec-00, however, a question on one year ahead inflation expectation added from Mar-11 onwards | | Inflation | Monthly CPI inflation figures (base Dec-16) of South Africa, averaged over 3 months | | Czech Republic | Inflation Expectations | One year ahead mean inflation expectations | | The survey was discontinued in 2007 | | Inflation | Monthly CPI inflation figures (base 2015) of the Czech Republic, averaged over 3 months | | Philippines | Inflation Expectations | One year ahead inflation expectations | | Inflation | Monthly CPI inflation figures (base 2006) of Philippines, averaged over 3 months | | Russia | Inflation Expectations | One year ahead median inflation expectations | | Inflation | Monthly CPI inflation figures (base same month of the previous year) of Russia |
 |